Artificial Intelligence
Automate model retraining with Amazon SageMaker Pipelines when drift is detected
Training your machine learning (ML) model and serving predictions is usually not the end of the ML project. The accuracy of ML models can deteriorate over time, a phenomenon known as model drift. Many factors can cause model drift, such as changes in model features. The accuracy of ML models can also be affected by concept drift, the difference between data used to train models and data used during inference. Therefore, teams must make sure that their models and solutions remain relevant and continue providing value back to the business. Without proper metrics, alarms, and automation in place, the technical debt from simply maintaining existing ML models in production can become overwhelming.
Amazon SageMaker Pipelines is a native workflow orchestration tool for building ML pipelines that take advantage of direct Amazon SageMaker integration. Three components improve the operational resilience and reproducibility of your ML workflows: pipelines, model registry, and projects. These workflow automation components enable you to easily scale your ability to build, train, test, and deploy hundreds of models in production, iterate faster, reduce errors due to manual orchestration, and build repeatable mechanisms.
In this post, we discuss how to automate retraining with pipelines in SageMaker when model drift is detected.
From static models to continuous training
Static models are a great place to start when you’re experimenting with ML. However, because real-world data is always changing, static models degrade over time, and your training dataset won’t represent real behavior for long. Having an effective deployment model monitoring phase is an important step when building an MLOps pipeline. It’s also one of the most challenging aspects of MLOps because it requires having an effective feedback loop between the data captured by your production system and the data distribution used during the training phase. For model retraining to be effective, you also must be continuously updating your training dataset with new ground truth labels. You might be able to use implicit or explicit feedback from users based on the predictions you provide, such as in the case of recommendations. Alternatively, you may need to introduce a human in the loop workflow through a service like Amazon Augmented AI (Amazon A2I) to qualify the accuracy of predictions from your ML system. Other considerations are to monitor predictions for bias on a regular basis, which can be supported through Amazon SageMaker Clarify.
In this post, we propose a solution that focuses on data quality monitoring to detect concept drift in the production data and retrain your model automatically.
Solution overview
Our solution uses an open-source AWS CloudFormation template to create a model build and deployment pipeline. We use Pipelines and supporting AWS services, including AWS CodePipeline, AWS CodeBuild, and Amazon EventBridge.
The following diagram illustrates our architecture.

The following are the high-level steps for this solution:
- Create the new Amazon SageMaker Studio project based on the custom template.
- Create a SageMaker pipeline to perform data preprocessing, generate baseline statistics, and train a model.
- Register the model in the SageMaker Model Registry.
- The data scientist verifies the models metrics and performance and approves the model.
- The model is deployed to a real-time endpoint in staging and, after approval, to a production endpoint.
- Amazon SageMaker Model Monitor is configured on the production endpoint to detect a concept drift of the data with respect to the training baseline.
- Model Monitor is scheduled to run every hour, and publishes metrics to Amazon CloudWatch.
- A CloudWatch alarm is raised when metrics exceed a model-specific threshold. This results in an EventBridge rule starting the model build pipeline.
- The model build pipeline can also be retrained with an EventBridge rule that runs on a schedule.
Dataset
This solution uses the New York City Taxi and Limousine Commission (TLC) Trip Record Data public dataset to train a model to predict taxi fare based on the information available for that trip. The available information includes the start and end location and travel date and time from which we engineer datetime features and distance traveled.
For example, in the following image, we see an example trip for location 65 (Downtown Brooklyn) to 68 (East Chelsea), which took 21 minutes and cost $20.

If you’re interested in understanding more about the dataset, you can use the exploratory data analysis notebook in the GitHub repository.
Get started
You can use the following quick start button to launch a CloudFormation stack to publish the custom SageMaker MLOps project template to the AWS Service Catalog:
![]()
Create a new project in Studio
After your MLOps project template is published, you can create a new project using your new template via the Studio UI.
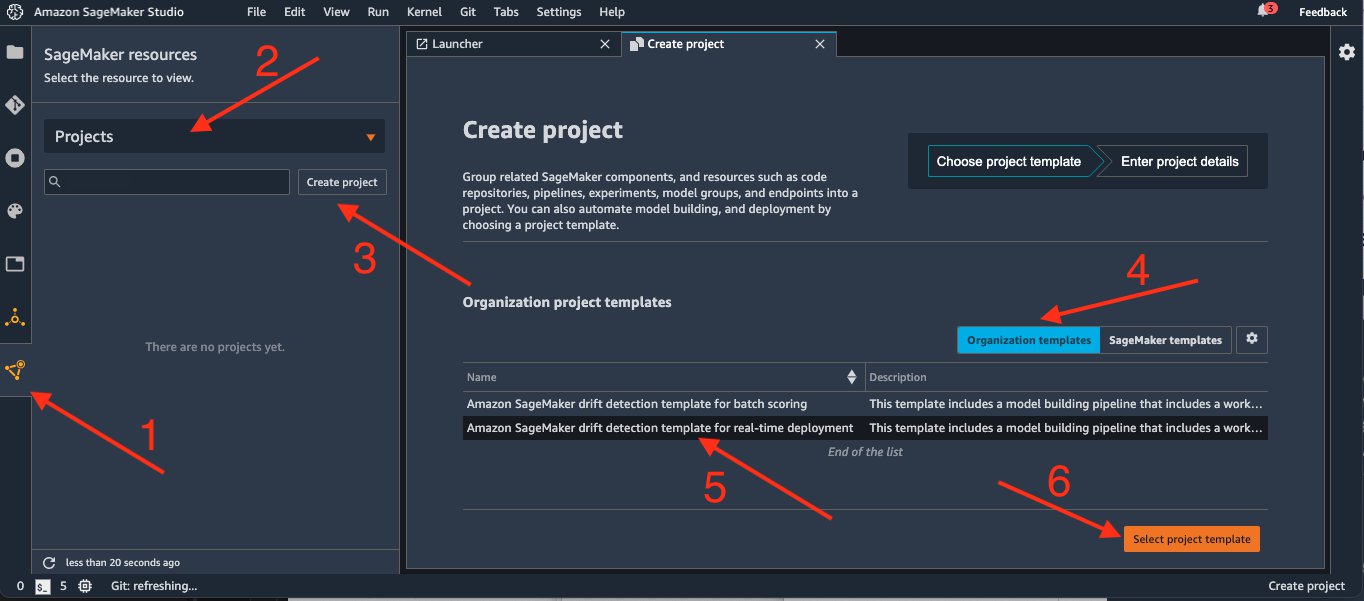
- In the Studio sidebar, choose SageMaker Components and registries.
- Choose Projects on the drop-down menu.
- Choose Create Project.
On the Create project page, SageMaker templates is chosen by default. This option lists the built-in templates. However, you want to use the template you published for the drift detection pipeline.
- Choose Organization templates.
- Choose Amazon SageMaker drift detection template for real-time deployment.
- Choose Select project template.
If you have recently updated your AWS Service Catalog project, you may need to refresh Studio to make sure it finds the latest version of your template.
- In the Project details section, for Name, enter
drift-detection.
Your project name must have 32 characters or fewer.
- Under Project template parameters, for RetrainSchedule, keep the default of
cron(0 12 1 * ? *). - Choose Create project.

When you choose Create project, a CloudFormation stack is created in your account. This takes a few minutes. If you’re interested in the components that are being deployed, navigate to the CloudFormation console. There you can find the stack that is being created.
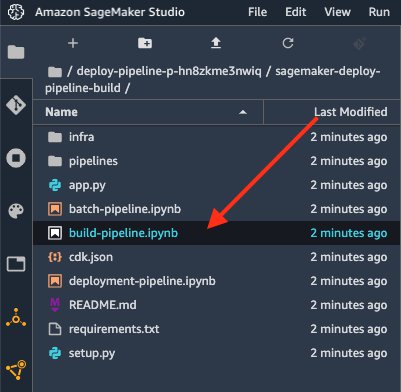
When the page reloads, on the main project page you can find a summary of all resources created in the project. For now, we need to clone the sagemaker-drift-detection-build repository.
- On the Repository tab, choose clone repo… and accept the default values in the dialog box.

This clones the repository to the Studio space for your user. The notebook build-pipeline.ipynb is provided as an entry point for you to run through the solution and to help you understand how to use it.
- Open the notebook.
- Choose the Python 3 (Data Science) kernel for the notebook.
If a Studio instance isn’t already running, an instance is provisioned. This can take a couple of minutes. By default, an ml.t3.medium instance is launched, which is enough to run our notebook.
- When the notebook is open, edit the second cell with the actual project name you chose:
- Run the first couple of cells to initialize some variables we need later and to verify we have selected our project:
Next, we must define the dataset that we’re using. In this example, we use data from NYC Taxi and Limousine Commission (TLC).
- Download the data from its public Amazon Simple Storage Service (Amazon S3) location and upload to the artifact bucket provisioned by the project template:
For your own custom template, you could also upload your data directly in the input_data_uri location, because this is where the pipeline expects to find the training data.
Run the training pipeline
To run the pipeline, you can continue running the cells in the notebook. You can also start a pipeline run through the Studio interface.
- First, go back to the main project view page and choose the Pipelines tab.

- Choose the pipeline
drift-detection-pipeline, which opens a tab containing a list of past runs.
When you first get to this page, you can see a previous failed run of the pipeline. This was started when the project was initialized. It failed because at the time there was no data for the pipeline to use.
You can now start a new pipeline with the data.
- Choose Start an execution.
- For Name, enter
First-Pipeline-execution. - Choose Start.

When the pipeline starts, it’s added to the list of pipeline runs with a status of Executing.

- Choose this pipeline run to open its details.
Pipelines automatically constructs a graph showing the data dependency for each step in the pipeline. Based on this, you can see the order in which the steps are completed.
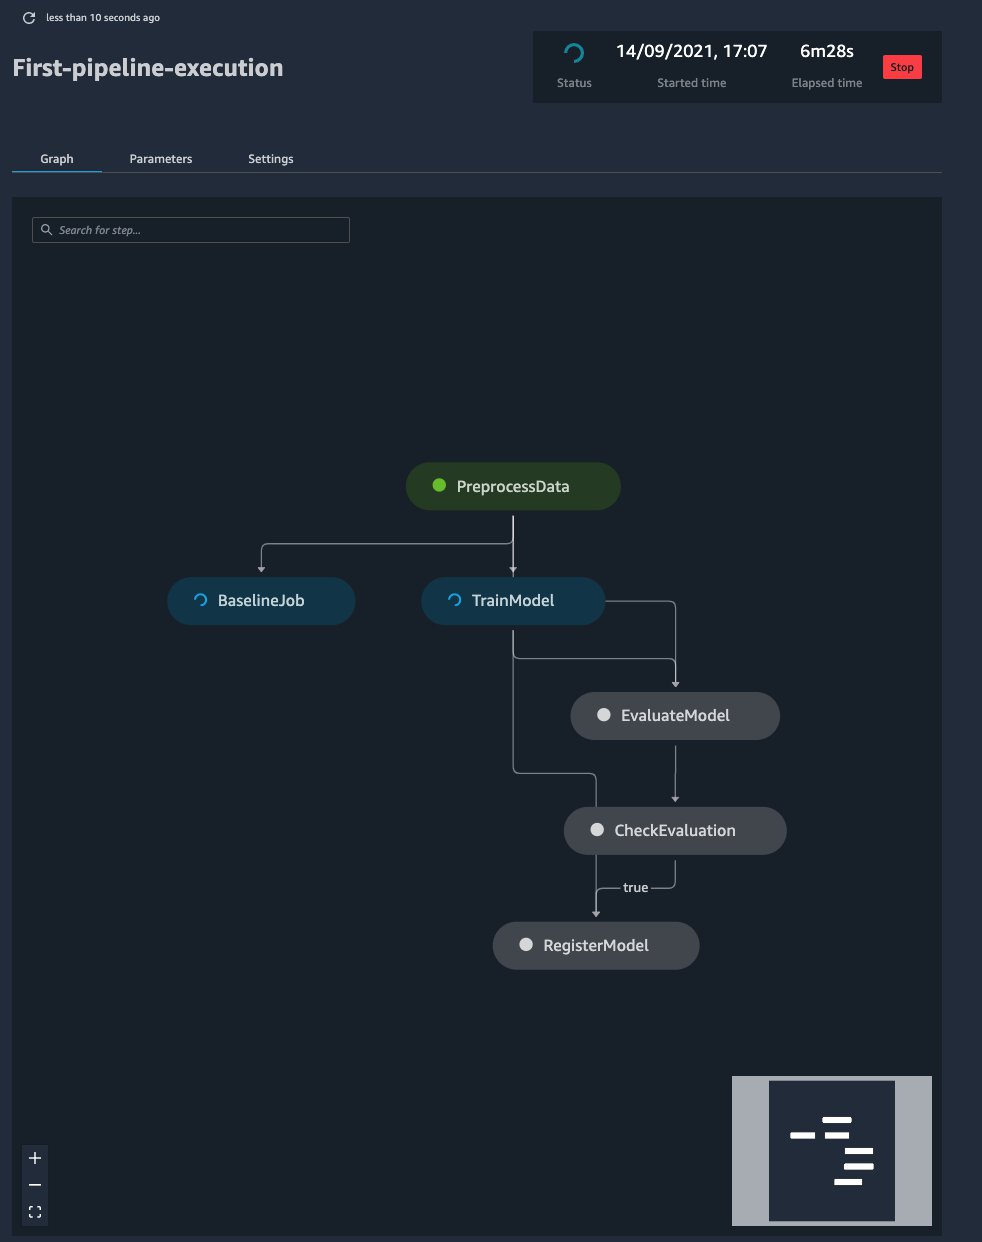
If you wait for a few minutes and refresh the graph, you can notice that the BaselineJob and TrainModel steps run at the same time. This happened automatically. SageMaker understands that these steps are safe to run in parallel because there is no data dependency between them. You can explore this page by choosing the different steps and tabs on the page. Let’s look at what the different steps are doing:
- PreprocessData – This step is responsible for preprocessing the data and transforming it into a format that is appropriate for the following ML algorithm. This step contains custom code developed for the particular use case.
- BaselineJob – This step is responsible for generating a baseline regarding the expected type and distribution of your data. This is essential for the monitoring of the model. Model Monitor uses this baseline to compare against the latest collected data from the endpoint. This step doesn’t require custom code because it’s part of the Model Monitor offering.
- TrainModel – This step is responsible for training an XGBoost regressor using the built-in implementation of the algorithm by SageMaker. Because we’re using the built-in model, no custom code is required.
- EvaluateModel and CheckEvaluation – In these steps, we calculate an evaluation metric that is important for us, in this case the root mean square error (rmse) on the test set. If it’s less than the predefined threshold (7), we continue to the next step. If not, the pipeline stops. The
EvaluateModelstep requires custom code to compute the metric we’re interested in. - RegisterModel – During this step, the trained model from the
TrainModelstep is registered in the model registry. From there, we can centrally manage and deploy the trained models. No custom code is required at this step.
Approve and deploy a model
After the pipeline has finished running, navigate to the main project page. Go to the Model groups tab, choose the drift-detection model group, and then a registered model version. This brings up the specific model version page. You can inspect the outputs of this model including the following metrics. You can also get more insights from the XGBoost training report.

The deployment pipeline for a registered model is triggered based on its status. To deploy this model, complete the following steps:
- Choose Update status.
- Change the pending status to Approved.
- Choose Update status.

Approving the model generates an event in CloudWatch that gets captured by a rule in EventBridge, which starts the model deployment.
To see the deployment progress, navigate to the CodePipeline console. From the pipelines section, choose sagemaker-drift-detection-deploy to see the deployment of the approved model in progress.

This pipeline includes a build stage that gets the latest approved model version from the model registry and generates a CloudFormation template. The model is deployed to a staging SageMaker endpoint using this template.
Now you can return to the notebook to test the staging endpoint by running the following code:
Promote the model to production
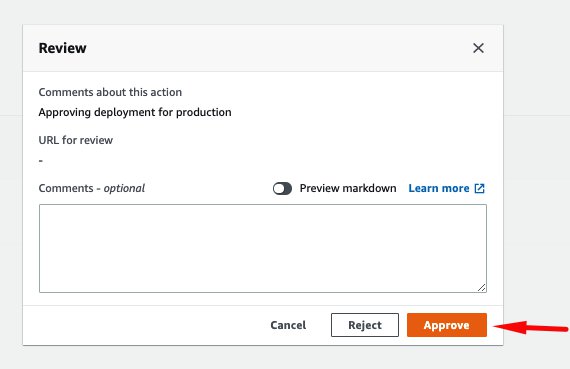
If the staging endpoint is performing as expected, the model can be promoted to production. If this is the first time running this pipeline, you can approve this model by choosing Review in CodePipeline, entering any comments, and choosing Approve.
In our example, the approval of a model to production is a two-step process, reflecting different responsibilities and personas:
- First, we approved the model in the model registry to be tested on a staging endpoint. This would typically be performed by a data scientist after evaluating the model training results from a data science perspective.
- After the endpoint has been tested in the staging environment, the second approval is to deploy the model to production. This approval could be restricted by AWS Identity and Access Management (IAM) roles to be performed only by an operations or application team. This second approval could follow additional tests defined by these teams.
The production deployment has a few extra configuration parameters compared to the staging. Although the staging created a single instance to host the endpoint, this stage creates the endpoint with automatic scaling with two instances across multiple Availability Zones. Automatic scaling makes sure that if traffic increases, the deployed model scales out in order to meet the user request throughput. Additionally, the production variant of the deployment enables data capture, which means all requests and response predictions from the endpoint are logged to Amazon S3. A monitoring schedule, also deployed at this stage, analyzes this data. If data drift is detected, a new run of the build pipeline is started.
Monitor the model
For model monitoring, an important step is to define sensible thresholds that are relevant to your business problem. In our case, we want to be alerted if, for example, the underlying distribution of the prices of fares change. The deployment pipeline has a prod-config.json file that defines a metric and threshold for this drift detection.
- Navigate back to the main project page in Studio.
- Choose the Endpoints tab, where you can see both the staging and the prod endpoints are
InService.

- Choose the prod endpoint to display additional details.
If you choose the prod version, the first thing you see is the monitoring schedule (which hasn’t run yet).
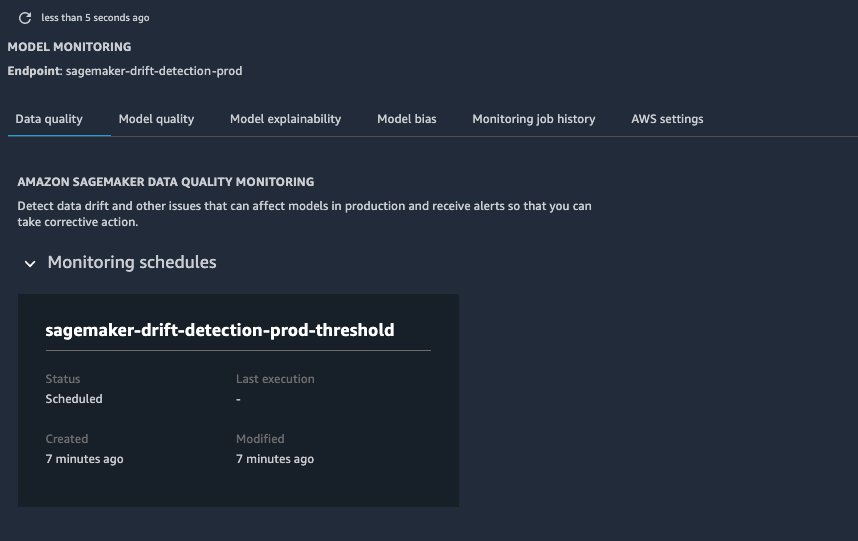
- Test the production endpoint and the data capture by sending some artificial traffic using the notebook cells under the Test Production and Inspect Data Capture sections.
This code also modifies the distribution of the input data, which causes a drift to be detected in the predicted fare amount when Model Monitor runs. This in turn raises an alarm and restarts the training pipeline to train a new model.
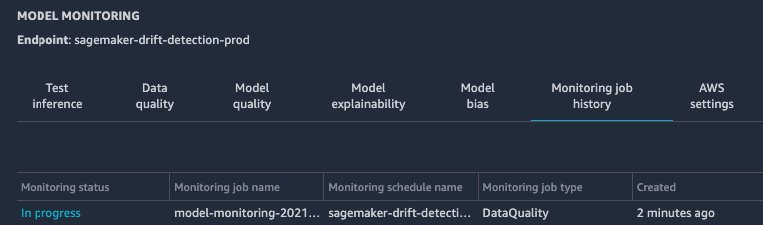
The monitoring schedule has been set to run hourly. After the hour, you can see that a new monitoring job is now In progress. This should take about 10 minutes to complete, at which point you should see its status change to Issue Found due to the data drift that we introduced.
To monitor the metrics emitted by the monitoring job, you can add a chart in Studio to inspect the different features over a relevant timeline.
- Choose the Data Quality tab of the Model Monitoring page.
- Choose Add chart, which reveals the chart properties.

- To get more insights into the monitoring job, choose the latest job to inspect the job details.
In Monitor Job Details, you can see a summary of the discovered constraint violations.
- To discover more, copy the long string under Processing Job ARN.
- Choose View Amazon SageMaker notebook, which opens a pre-populated notebook.
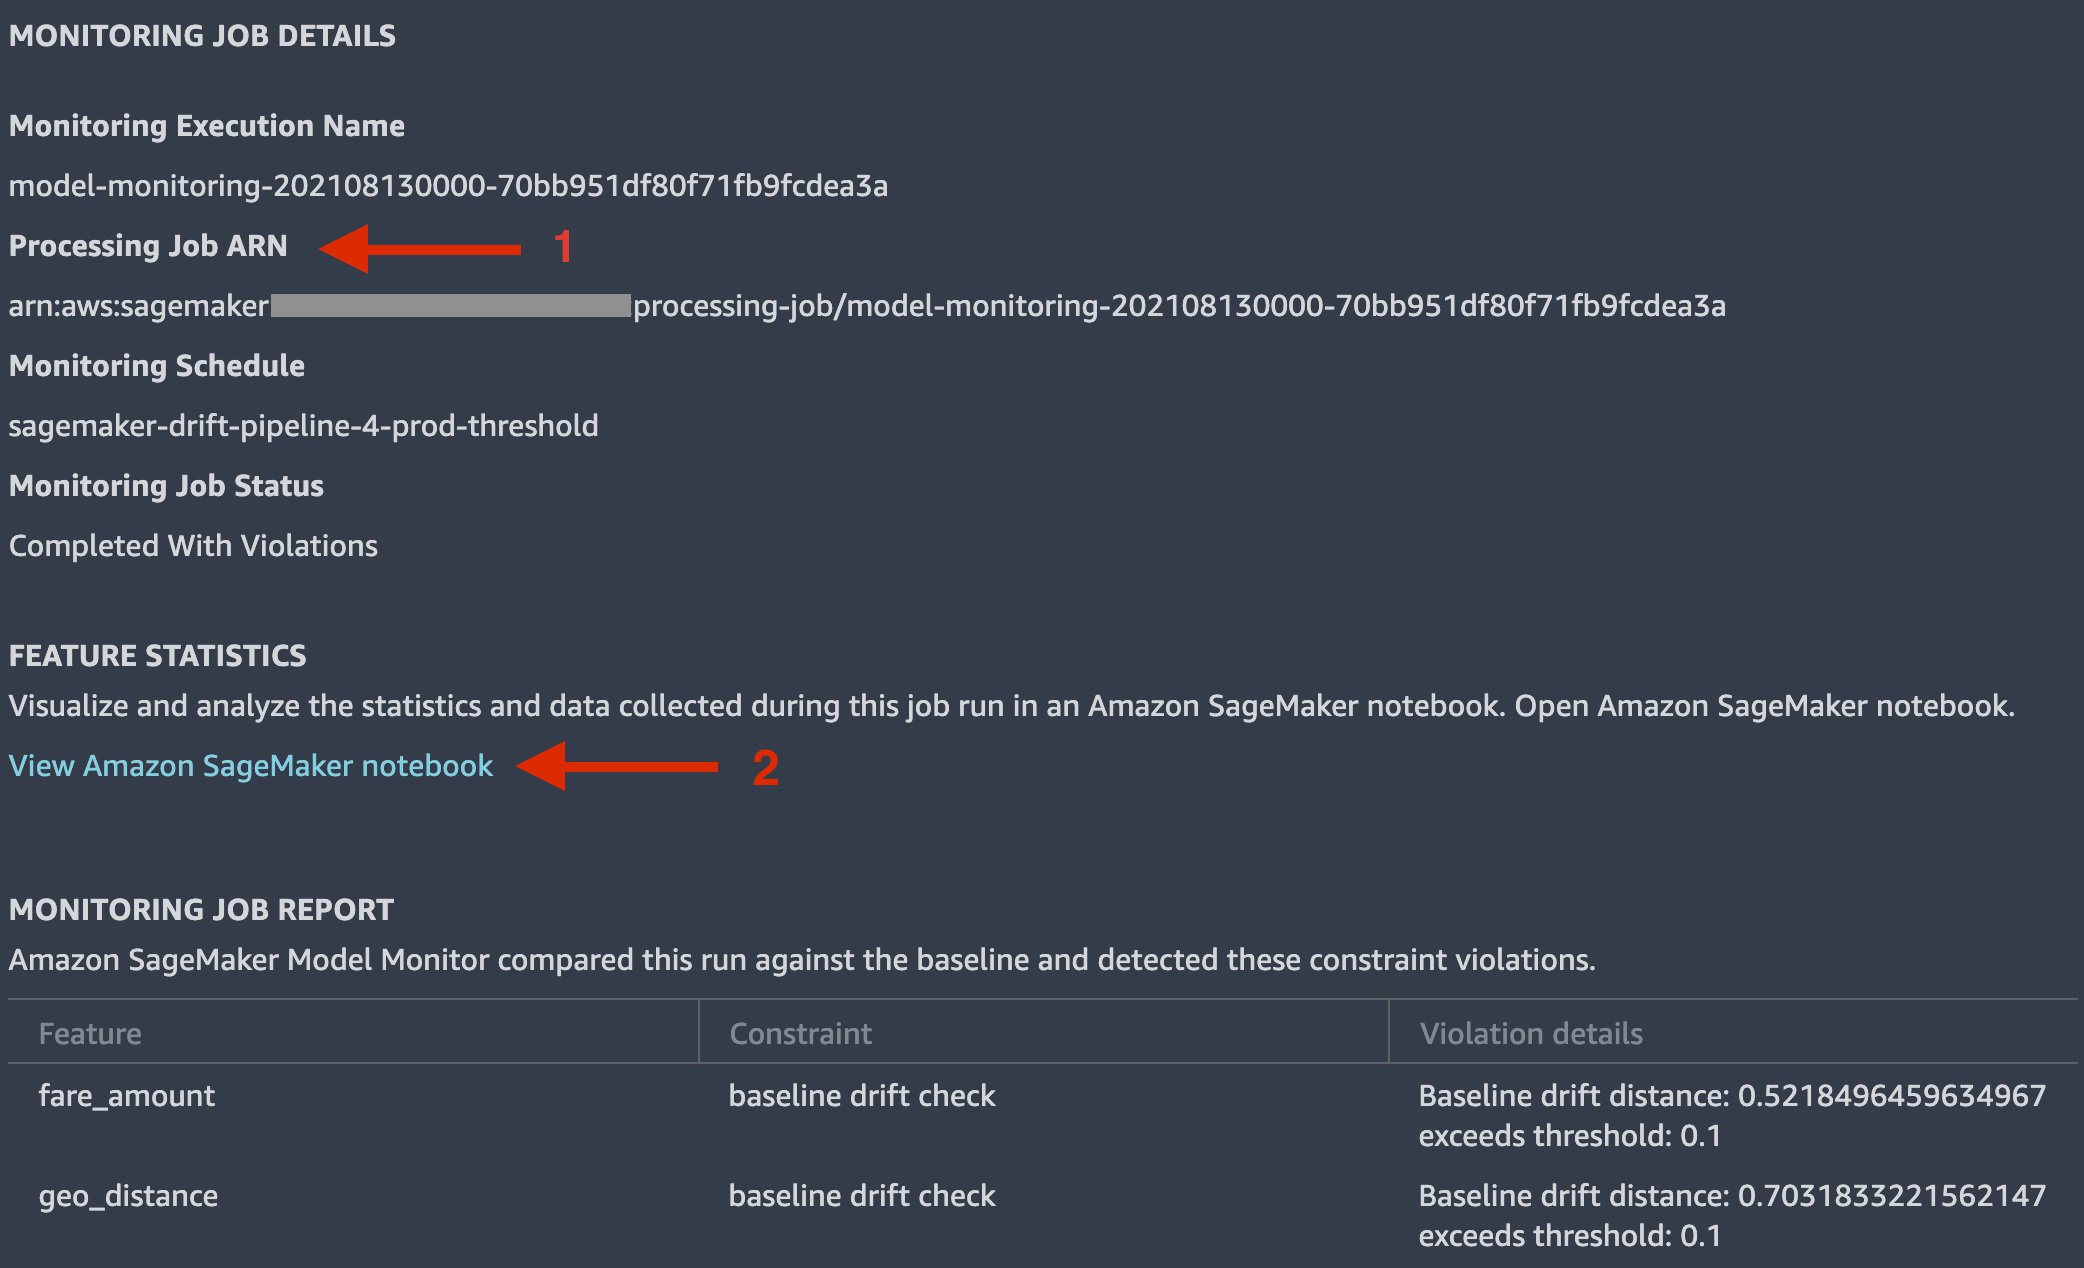
- In the notebook the cell, replace
FILL-IN-PROCESSING-JOB-ARNwith the ARN value you copied. - Run all the notebook cells.
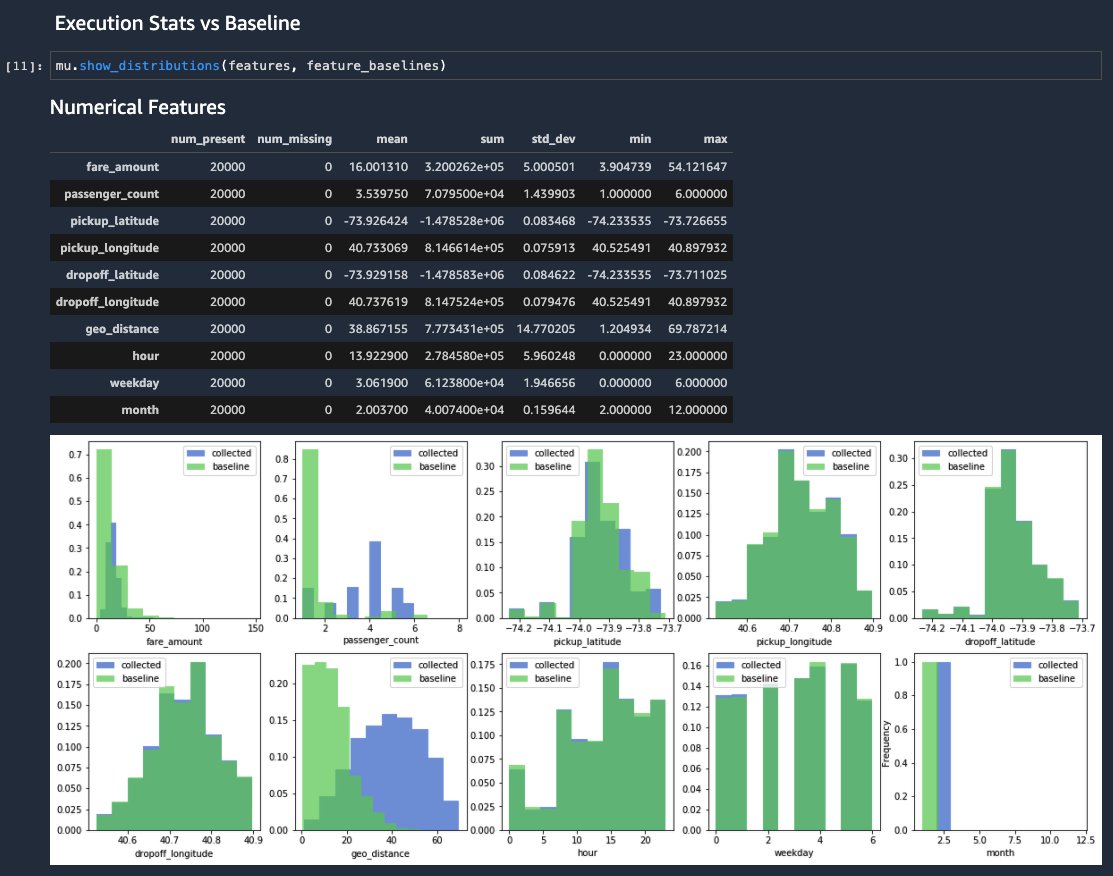
This notebook outputs a series of tables and graphs, including a distribution that compares the newly collected data (in blue) to the baseline metrics distribution (in green). For the geo_distance and passenger_count features for which we introduced artificial noise, you can see the shifts in distributions. Similarly, as a consequence you can notice a shift in the distribution for the fare_amount predicted value.
Retrain the model
The preceding change in data raises an alarm in response to the CloudWatch metrics published from Model Monitor exceeding the configured threshold. Thanks to the Pipelines integration with EventBridge, the model build pipeline is started to retrain the model on the latest data.

Navigating to the CloudWatch console and choosing Alarms should show that the alarm sagemaker-drift-detection-prod-threshold is in the status In Alarm. When the alarm changes to In alarm, a new run of the pipeline is started. You can see this on the pipeline tab of the main project in the Studio interface.

At this point, the new model that is generated suffers from the same drift if we use that same generated data to test the endpoint. This is because we didn’t change or update the training data. In a real production environment, for this pipeline to be effective, a process should exist to load newly labeled data to the location where the pipeline is getting the input data. This last detail is crucial when building your solution.
Clean up
The build-pipeline.ipynb notebook includes cells that you can run to clean up the following resources:
- SageMaker prod endpoint
- SageMaker staging endpoint
- SageMaker pipeline workflow and model package group
- Amazon S3 artifacts and SageMaker project
You can also clean up resources using the AWS Command Line Interface (AWS CLI):
- Delete the CloudFormation stack created to provision the production endpoint:
aws cloudformation delete-stack —stack-name sagemaker-<<project_name>>-deploy-prod
- Delete the CloudFormation stack created to provision the staging endpoint:
aws cloudformation delete-stack —stack-name sagemaker-<<project_name>>-deploy-staging
- Delete the CloudFormation stack created to provision the SageMaker pipeline and model package group:
aws cloudformation delete-stack —stack-name sagemaker-<<project_name>>-deploy-pipeline
- Empty the S3 bucket containing the artifacts output from the drift deployment pipeline:
aws s3 rm —recursive s3://sagemaker-project-<<project_id>>-region_name
- Delete the project, which removes the CloudFormation stack that created the deployment pipeline:
aws sagemaker delete-project —project-name <<project_name>>
- Delete the AWS Service Catalog project template:
aws cloudformation delete-stack —stack-name <<drift-pipeline>>
Conclusion
Model Monitor allows you to capture incoming data to the deployed model, detect changes, and raise alarms when significant data drift is detected. Additionally, Pipelines allows you to orchestrate building new model versions. With its integration with EventBridge, you can run a pipeline either on a schedule or on demand. The latter feature allows for integration between monitoring a model and automatically retraining a model when a drift in the incoming feature data has been detected.
You can use the code repository on GitHub as a starting point to try out this solution for your own data and use case.
Additional references
For additional information, see the following resources:
- Introducing the new AWS Well-Architected Machine Learning Lens
- Human-in-the-loop review of model explanations with Amazon SageMaker Clarify and Amazon A2I
- Bring your own container to project model accuracy drift with Amazon SageMaker Model Monitor
About the Author
 Julian Bright is an Principal AI/ML Specialist Solutions Architect based out of Melbourne, Australia. Julian works as part of the global Amazon Machine Learning team and is passionate about helping customers realize their AI and ML journey through MLOps. In his spare time, he loves running around after his kids, playing soccer and getting outdoors.
 Georgios Schinas is a Specialist Solutions Architect for AI/ML in the EMEA region. He is based in London and works closely with customers in UK. Georgios helps customers design and deploy machine learning applications in production on AWS with a particular interest in MLOps practices. In his spare time, he enjoys traveling, cooking and spending time with friends and family.
 Theiss Heilker is an AI/ML Solutions Architect at AWS. He helps customer create AI/ML solutions and accelerate their Machine Learning journey. He is passionate about MLOps and in his spare time you can find him in the outdoors playing with his dog and son.
 Alessandro Cerè is a Senior ML Solutions Architect at AWS based in Singapore, where he helps customers design and deploy Machine Learning solutions across the ASEAN region. Before being a data scientist, Alessandro was researching the limits of Quantum Correlation for secure communication. In his spare time, he’s a landscape and underwater photographer.