AWS Public Sector Blog
Supporting health equity with data insights and visualizations using AWS

This is a guest post by Ajay K. Gupta, co-founder and chief executive officer (CEO) of HSR.health, and chair of the Holy Cross Health Board of Directors.
HSR.health is a healthcare technology (HealthTech) nonprofit that uses geospatial artificial intelligence (GeoAI) to improve the quality of healthcare. HSR.health uses GeoAI to gain insights on things like social and environmental determinants of health, disease and infection rates, health risks, and challenges to access for line-of-service healthcare. We study the relationship between these components and use visualization tools to tell the story of how diverse, compounding health factors affect populations. We then deliver actionable data insights to our clients, including healthcare decision makers, government leaders, the emergency response community, health systems, and global public health organizations.
To support these initiatives, HSR.health uses Amazon Web Services (AWS) to develop solutions that support improvements in healthcare around the world to make care more available and affordable for all.
Addressing health inequity through technology
When HSR.health was founded, we sought to answer one simple question: how can technology improve access to and the quality of healthcare? HSR.health set out to use data and technology to identify the health factors that most impact people. We use geospatial technologies and advanced data science techniques, paired with novel public health models, to help accurately predict the spread and severity of disease. This data informs clinical and social mitigation efforts to address these health factors, and helps resource health facilities to treat the affected. We envision a future in which healthcare is more integrated with technology to improve patient outcomes and lower health care costs.
After producing data insights, our role then is to help identify for public health decision makers—which include regulators, legislators, health system executives, pharmaceutical researchers, and more—the factors that contribute to health inequity across areas and across populations. Once identified, decision makers can change or accommodate those factors so that outcomes can be more balanced, creating more health equity in our society.
The Maryland Hospital Association is currently using our GeoMD Platform across multiple healthcare service lines. GeoMD includes both our Care Desert Analyses and our Social Determinants of Health Risk Index. This synthesis offers unique insight on the impact that the lack of health access has on individual people and their communities. Furthermore, this analysis provides actionable data to health systems that assists in forming solutions to care for their communities. For example, one feature of the GeoMD Platform pinpoints and depicts the average driving distance to all the health clinics in Maryland. The user is able to interact with this data by filtering it by numerous social determinants of health with varying granularity. This provides a deep-level look at a community’s access to care and gives a 360 degree vision of the gaps within the healthcare system, and streamlines the user’s ability to find solutions.
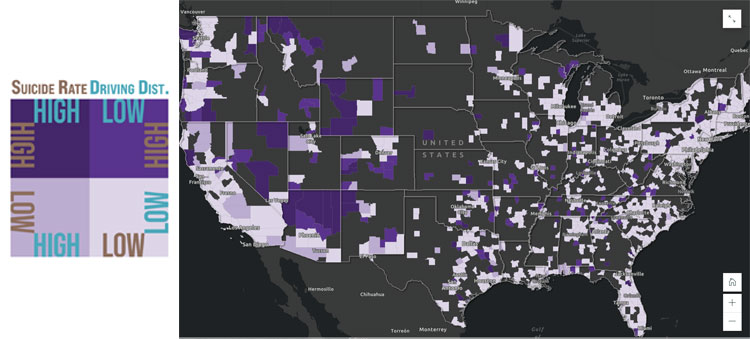
Figure 1. An example of Care Desert Analysis and Social Determinant of Health Index synthesis. The pictured images show the relationship between suicide rate and driving distance to a mental healthcare facility on a US map.
Growing cloud infrastructure to generate actionable health insights in real-time
Working across complex datasets allows health indicators to emerge that might be unusual or overlooked. By building our core infrastructure, including our data pipeline, in AWS, we can gain insights as quickly as we can digest and analyze data, and surface those findings—with subsequent policy and intervention recommendations—in real-time. This became essential during the COVID-19 pandemic when measuring and predicting infection rates, disease spread, and emergency care capacity was critical to protecting the population. It was important to focus on health risks globally because diseases travel; to address health risks anywhere, you must know about health risks everywhere. At the height of the pandemic, we scaled the sophistication of our cloud infrastructure to make our analysis more efficient and effective.
As a cloud-native organization, we began with Amazon Elastic Compute Cloud (Amazon EC2) instances to house our spatial data infrastructures. We then employed simple AWS CloudFormation templates that utilized Amazon Simple Storage Service (Amazon S3) with Amazon Route 53 to stand up a webpage that shared dashboard visuals allowing clients and partners to interact with our analysis. For instance, our collaborators can access our spatial data infrastructure (SDI) and import our analysis into their infrastructure to share with their communities—increasing the overall audience that has access to our health risk insights.
Prior to the COVID-19 pandemic, our analysis was more static. For example, we manually analyzed datasets that were only updated periodically, like Medicare cost versus Census data. At the onset of the pandemic, we saw the need to scale our cloud infrastructure to address public health questions that arose in real-time: How is the virus’s transmission changing? How is vaccine distribution affecting the rate of severe cases? We made the decision to evolve our cloud infrastructure to a data lake architecture. Now, all of our raw data, intermediate calculations, and final products are stored in Amazon S3, and we utilize AWS Lambda functions to create automated workflows for data cleaning and analysis. As a part of the data processing component, we also utilize Amazon Athena and AWS Glue. With the implementation of the data lake architecture, we generate insights that inform healthcare decisions instantaneously—allowing decisions to be informed by more current information.
Storytelling with data visualization tools: Using insights to affect change
Beyond generating critical data insights, HSR.health uses geospatial analysis to map care desserts and produce health indexes that span more than 40 different health topics. Users can analyze data across 300-400 different dashboards and explore social and environmental determinants of health, hospital admissions, readmissions, health care costs, and access to line-of-service or specialty care.
A care desert is a location with inadequate healthcare facilities or health resources to meet the needs of the population in a particular area or region. Care deserts can be measured in different ways: by population, by distance (driving distance, walking distance, commuting distance using public transportation), by political jurisdiction, and more. HSR.health currently presents our geospatial analysis through StoryMaps and dashboards using the Esri ecosystem and the ArcGIS platform. Since the program’s inception, we have identified six service line care desserts – down to the neighborhood level – across the United States. These care deserts include primary care, pediatric care, women’s healthcare , kidney care, mental health care, and pharmacies. This initiative has also been used to identify and analyze primary care and pediatric care for private clients. Our role is to not only make healthcare decision makers aware of care deserts, but also to identify the reasons why and under what circumstances they exist, so they can affect change.

Figure 2. Mental health care desert analysis, depicting the number of mental healthcare clinics per county.
Maximizing productivity and agility through the cloud
As a nonprofit organization, we’re mindful of maximizing cost savings and the efficiency of our workloads. An unexpected solution came when we utilized AWS Cost Explorer to audit our AWS cost and usage over time. By analyzing our technical activity and seeking ways to work more effectively in the cloud, we were able to measure the workloads of our data scientists and public health analysts without obtrusive monitoring or oversight. It provided insight into what our remote employees were working on (and potential barriers they were encountering) and helped us identify workloads that were replicable and scalable to become more efficient as an organization.
For example, we were able to identify that one of our pipelines was contributing to abnormally high costs associated with using AWS Lambda to automate our workflows. From this, the team optimized the memory utilization and modified the parameters of the Lambda function to reduce the memory utilization for that process—both reducing costs and increasing efficiency.
Expanding impact in health equity at scale
Through many lessons learned over the past three years, we know that healthcare is an increasingly global challenge that requires global solutions. The next phase of our organization is to continue to expand our impact globally, raising the bar on health equity across the planet. We will continue to produce healthcare analysis from existing data sources, and create novel approaches to monitoring global health. We’re exploring what health information we can extract from satellite imagery to investigate things like water-borne illnesses, the effects of natural disasters, land use changes like deforestation, and mapping health infrastructure. We are currently in a pilot with AWS in the use of the Geospatial ML with Amazon SageMaker product, currently in preview, to explore the ability to extract health risk indicators from Earth observation (EO) data from satellite imagery, such as LandSat or Sentinel-2.
Finally, we’re continuing to improve mechanisms for relaying our insights to decision makers, advocates, and thought leaders who are invested in expanding access and lowering cost to health care for all.
Nonprofits of all sizes are using AWS to increase support, expand awareness, and advance mission impact locally and globally. Learn more about AWS for nonprofits. Plus, discover how HealthTechs use AWS to increase the pace of innovation, lower development costs, and speed time to market by leveraging the comprehensive portfolio of services and solutions on AWS.
Read related stories on the AWS Public Sector Blog:
- Advancing health equity with ET3 programs and AWS
- Helping prevent sudden cardiac arrest in young athletes with AI
- Supporting our nonprofit customers through change and transformation
- New global program to help customers develop solutions to improve health outcomes and health equity
- AWS Nonprofit Credit Program expands support for nonprofits of all sizes
Subscribe to the AWS Public Sector Blog newsletter to get the latest in AWS tools, solutions, and innovations from the public sector delivered to your inbox, or contact us.
Please take a few minutes to share insights regarding your experience with the AWS Public Sector Blog in this survey, and we’ll use feedback from the survey to create more content aligned with the preferences of our readers.