Artificial Intelligence
Building a business intelligence dashboard for your Amazon Lex bots
July 2024: The solution in this blog post is now obsolete with the release of Amazon Lex V2.
You’ve rolled out a conversational interface powered by Amazon Lex, with a goal of improving the user experience for your customers. Now you want to track how well it’s working. Are your customers finding it helpful? How are they using it? Do they like it enough to come back? How can you analyze their interactions to add more functionality? Without a clear view into your bot’s user interactions, questions like these can be difficult to answer. The recent release of conversation logs for Amazon Lex makes it easy to get near-real-time visibility into how your Lex bots are performing, based on actual bot interactions. With conversation logs, all bot interactions can be stored in Amazon CloudWatch Logs log groups. You can use this conversation data to monitor your bot and gain actionable insights for enhancing your bot to improve the user experience for your customers.
In a prior blog post, we demonstrated how to enable conversation logs and use CloudWatch Logs Insights to analyze your bot interactions. This post goes one step further by showing you how to integrate with an Amazon QuickSight dashboard to gain business insights. Amazon QuickSight lets you easily create and publish interactive dashboards. You can choose from an extensive library of visualizations, charts, and tables, and add interactive features such as drill-downs and filters.
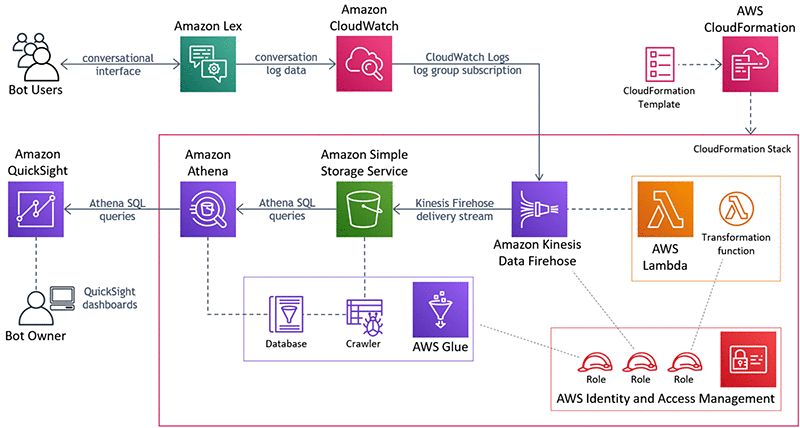
Solution architecture
In this business intelligence dashboard solution, you will use an Amazon Kinesis Data Firehose to continuously stream conversation log data from Amazon CloudWatch Logs to an Amazon S3 bucket. The Firehose delivery stream employs a serverless AWS Lambda function to transform the raw data into JSON data records. Then you’ll use an AWS Glue crawler to automatically discover and catalog metadata for this data, so that you can query it with Amazon Athena. A template is included below that will create an AWS CloudFormation stack for you containing all of these AWS resources, as well as the required AWS Identity and Access Management (IAM) roles. With these resources in place, you can then create your dashboard in Amazon QuickSight and connect to Athena as a data source.
This solution allows you to use your Amazon Lex conversation logs data to create live visualizations in Amazon QuickSight. For example, using the AutoLoanBot from the previously mentioned blog post, you can visualize user requests by intent, or by intent and user, to gain an understanding about bot usage and user profiles. The following dashboard shows these visualizations:
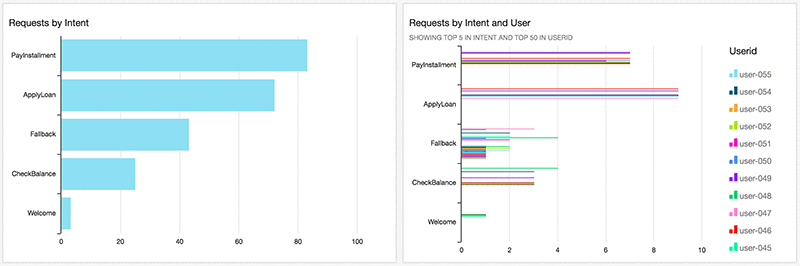
This dashboard indicates that payment activity and loan applications are most heavily used, but checking loan balances is used much less frequently.
Deploying the solution
To get started, configure an Amazon Lex bot and enable conversation logs in the US East (N. Virginia) Region.
For our example, we’re using the AutoLoanBot, but you can use this solution to build an Amazon QuickSight dashboard for any of your Amazon Lex bots.
The AutoLoanBot implements a conversational interface to enable users to initiate a loan application, check the outstanding balance of their loan, or make a loan payment. It includes the following intents:
- Welcome – Responds to an initial greeting from the user
- ApplyLoan – Elicits information such as the user’s name, address, and Social Security Number, and creates a new loan request
- PayInstallment – Captures the user’s account number, the last four digits of their Social Security Number, and payment information, and processes their monthly installment
- CheckBalance – Uses the user’s account number and the last four digits of their Social Security Number to provide their outstanding balance
- Fallback – Responds to any requests that the bot cannot process with the other intents
To deploy this solution, complete the following steps:
- Once you have your bot and conversation logs configured, use the following button to launch an AWS CloudFormation stack in us-east-1:

- For Stack name, enter a name for your stack. This post uses the name lex-logs-analysis:

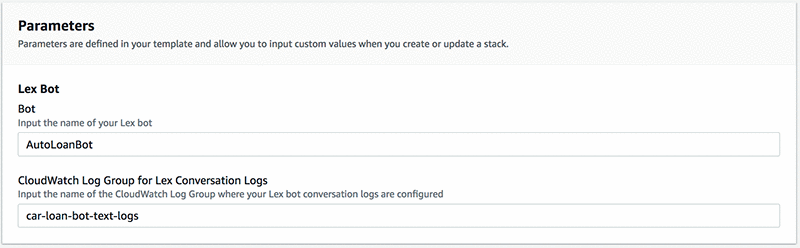
- Under Lex Bot, for Bot, enter the name of your bot.
- For CloudWatch Log Group for Lex Conversation Logs, enter the name of the CloudWatch Logs log group where your conversation logs are configured.
This post uses the bot AutoLoanBot and the log group car-loan-bot-text-logs:
- Choose Next.
- Add any tags you may want for your CloudFormation stack.
- Choose Next.
- Acknowledge that IAM roles will be created.
- Choose Create stack.
After a few minutes, your stack should be complete and contain the following resources:
- A Firehose delivery stream
- An AWS Lambda transformation function
- A CloudWatch Logs log group for the Lambda function
- An S3 bucket
- An AWS Glue crawler and database
- Four IAM roles
This solution uses the Lambda blueprint function kinesis-firehose-cloudwatch-logs-processor-python, which converts the raw data from the Firehose delivery stream into individual JSON data records grouped into batches. For more information, see Amazon Kinesis Data Firehose Data Transformation.
AWS CloudFormation should also have successfully subscribed the Firehose delivery stream to your CloudWatch Logs log group. You can see the subscription in the AWS CloudWatch Logs console, for example:

At this point, you should be able to test your bot, see your log data flowing from CloudWatch Logs to S3 via the Firehose delivery stream, and query your conversation log data using Athena. If you are using the AutoLoanBot, you can use a test script to generate log data (conversation logs do not log interactions through the AWS Management Console). To download the test script, choose test-bot.zip.
The Firehose delivery stream runs every minute and streams the data to the S3 bucket. The crawler is configured to run every 10 minutes (you can also run it anytime manually via the console). After the crawler has run, you can query your data via Athena. The following screenshot shows a test query you can try in the Athena Query Editor:

This query shows that some users are running into issues trying to check their loan balance. You can set up Amazon QuickSight to do more in-depth analyses and visualizations of this data. To do this, complete the following steps:
- From the console, launch Amazon QuickSight.
If you’re not already using QuickSight, you can start with a free trial using Amazon QuickSight Standard Edition. You need to provide an account name and notification email address. In addition to choosing Amazon Athena as a data source, make sure to include the S3 bucket where your conversation log data is stored (you can find the bucket name in your CloudFormation stack).
It can take a few minutes to set up your account.
- When your account is ready, choose New analysis.
- Choose New data set.
- Choose Anthena.
- Specify the data source
auto-loan-bot-logs. - Choose Validate connection and confirm connectivity to Athena.
- Choose Create data source.
- Select the database that AWS Glue created (which includes
lexlogsdatabasein the name).
Adding visualizations
Now you can add visualizations in Amazon QuickSight. To create the two visualizations shown above, complete the following steps:
- From the + Add icon at the top of the dashboard, select Add visual.
- Drag the
intentfield to the Y axis on the visual. - Add another visual by repeating the first two steps.
- On the second visual, drag
useridto the Group/Color field well. - To sort the visuals, drag
requestidto the Value field in each one.
You can create some additional visualizations to gain some insights into how well your bot is performing. For example, you can evaluate how effectively your bot is responding to your users by drilling down into the requests that fell through to the fallback intent. To do this, duplicate the preceding visualizations but replace the intent dimension with inputTranscript, and add a filter for missedUtterance = 1. The following graphs show summaries of missed utterances, and missed utterances by user.

You can also create a word cloud visualization for missed utterances. To do this, complete the following steps:
- From the + Add icon at the top of the dashboard and select Add visual.
- Change the visual type to Word Cloud.
- Drag
inputTranscriptto the Group By - Add a filter
missedUtterance = 1. - Choose Apply.
- To refine the formatting of the word cloud, choose Format visual from the drop-down menu at the top right corner.
- Choose the desired formatting options on the left-side toolbar.
The following screen shot shows your word cloud visualization for missed utterances.
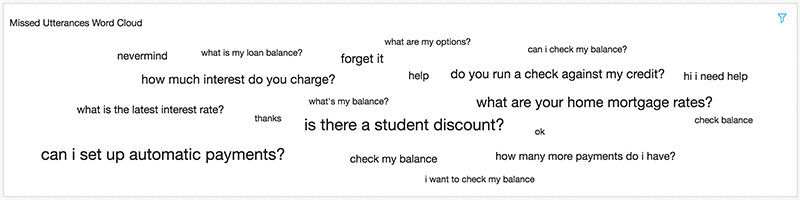
This type of visualization provides a powerful view into how your users are interacting with your bot. In this example, you could use this insight to improve the existing CheckBalance intent, implement an intent to help users set up automatic payments, field general questions about your auto loan services, and even redirect users to a sister bot that handles home mortgage applications.
Conclusion
Monitoring bot interactions is critical in building effective conversational interfaces. You can understand what your users are trying to accomplish and how to streamline their user experience. Amazon QuickSight in conjunction with Amazon Lex conversation logs makes it easy to create dashboards by streaming the conversation data via Kinesis Data Firehose. You can layer this analytics solution on top of any of your Amazon Lex bots – give it a try!
About the authors
 Brian Yost is a Senior Consultant with AWS Professional Services. In his spare time, he enjoys mountain biking, home brewing, and tinkering with technology.
 Michal Marshall is a Senior Software Development Engineer at Amazon AI. He works on building and maintaining scalable distributed systems for the Amazon AI. In his spare time, he can be found playing sports, snowboarding, or backpacking in the mountains.