AWS Partner Network (APN) Blog
How Epsagon Increased Performance on AWS Lambda by 65% and Reduced Cost by 4x
By James Bland, Sr. Partner Solutions Architect, DevOps at AWS
By Ran Ribenzaft, AWS Serverless Hero, CTO & Co-Founder at Epsagon
 |
Providing a better experience at lower cost is the desired result of any organization and product. In most cases, it requires software re-architecting, planning, infrastructure configurations, benchmarking, and more.
Epsagon provides a solution for monitoring and troubleshooting modern applications running on Amazon Web Services (AWS).
The entire stack of Epsagon leverages the AWS serverless ecosystem such as AWS Lambda functions, Amazon DynamoDB, Amazon Simple Notification Service (SNS), Amazon Simple Queue Service (SQS), AWS Fargate, and more.
Epsagon is an AWS Partner Network (APN) Advanced Technology Partner with AWS Competencies in Data & Analytics, DevOps, AWS Containers, and Retail.
In this post, we share some of the best practices Epsagon has developed to improve the performance and reduce the cost of using serverless environments.
Understanding Performance and Cost
In AWS Lambda functions, cost equals performance. The main pricing factors are the number of requests and the GB-second duration. The GB-second duration is calculated from the time your code begins executing until it returns or otherwise terminates, rounded up to the nearest 100ms, multiplied by the memory configuration.
For example, a quick calculation on a 128MB function that runs for 1,600 ms results in $0.000003332 per invocation. When this function is running a million times a day, it results in a charge of $99 per month. If it runs 20 million times a day, it results in a charge of $1999 per month. That’s a price to start thinking about.
If we improved the performance of that 128MB function by 600ms, it would save $749 per month. That’s a savings of 37 percent. We have a strategy to make that happen.
Optimizing Performance and Cost
Let’s begin with Epsagon’s busiest AWS Lambda function: the logs parser. This function is responsible for analyzing close to one million Lambda function logs and converting them into metrical data and alerts. This function looks for common patterns in logs such as ‘REPORT’ lines, ‘Task timed out,’ and more.
Today, this service handles tens of billions of logs per day. To improve its performance and reduce cost, Epsagon built the following resilient pipeline.
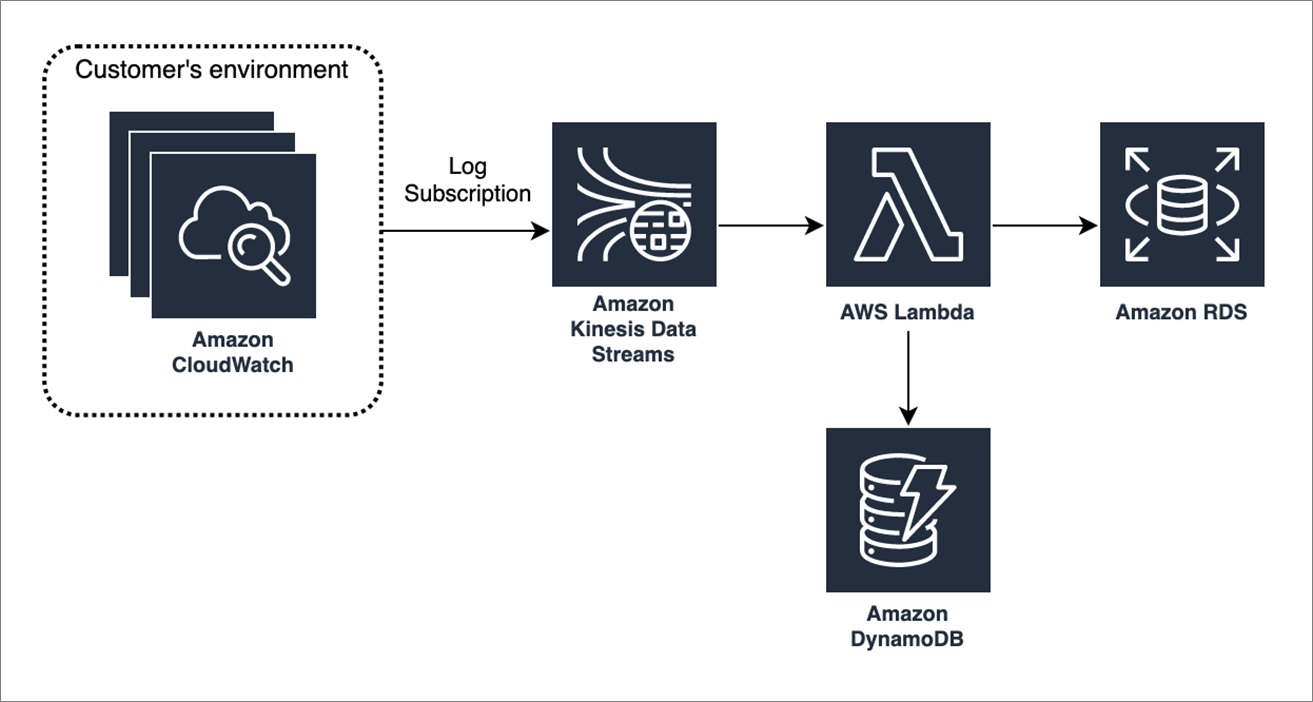
Figure 1 – Pipeline for Epsagon log parser.
These are the major components of the pipeline:
- The AWS CloudWatch Log Groups subscribe to an Amazon Kinesis Data Stream on our account.
- A log group is a group of log streams that share the same retention, monitoring, and access control settings. The data stream continuously captures gigabytes of data per second from hundreds of thousands of sources such as website clickstreams, IT logs, and more.
- The Amazon Kinesis Data Stream service triggers the Lambda function to parse the gigabytes of data it has collected.
- The Lambda function gets enriched data from Amazon DynamoDB (data is pre-populated by an async process).
- The Lambda function stores the invocation data (transformed into metrical data) into Amazon Relational Database Service (Amazon RDS).
Before we begin, we need to know what our current performance benchmark and costs are. Using Epsagon, we can easily spot the log parser as our most expensive function.
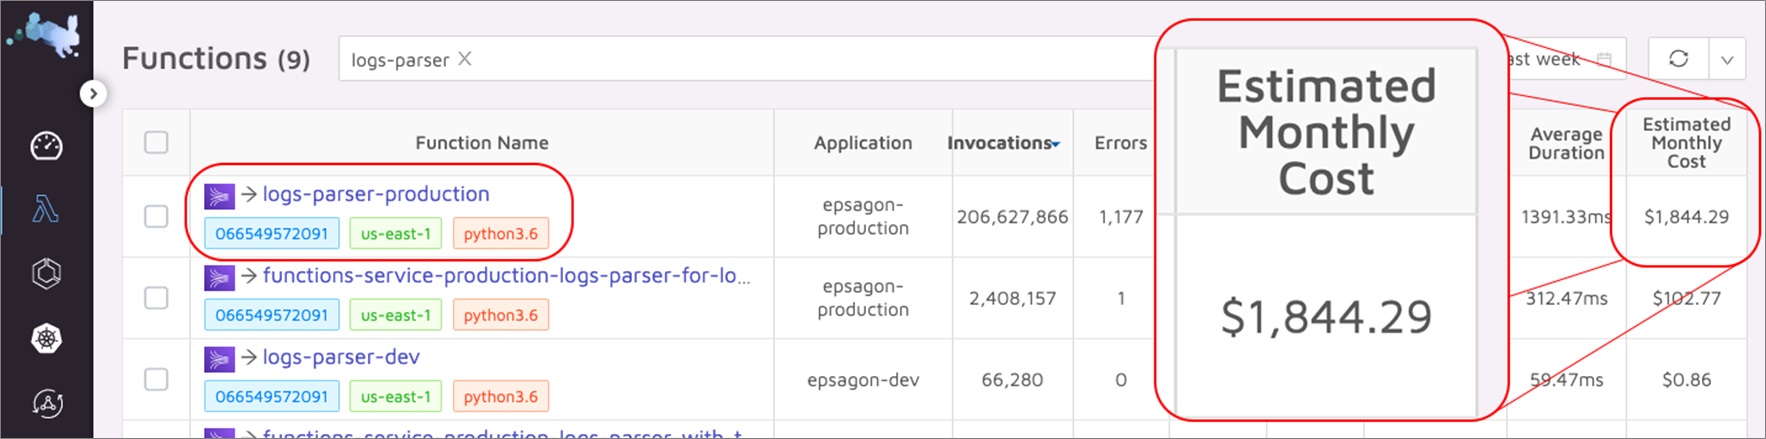
Figure 2 – Starting performance benchmark and cost.
To optimize both the performance and cost of our log parser, we employed these techniques:
- Batching
- Caching
- Set SDK-keepalive to true
- Initialize connections outside of the handler
- Tuning memory configuration.
Batching
A great way to significantly improve performance in pipelines such as the log parser is to batch and group data together to minimize the number of invocations. In our log parser, we found three types of invocations we can batch:
- Amazon Kinesis to AWS Lambda trigger batch size.
- Calls to Amazon DynamoDB.
- Calls to Amazon RDS.
We tested different batch sizes, and found out that by increasing Amazon Kinesis Data Stream batch size from 10 to 200 records, we retained almost the same duration. However, since we had much bigger chunks of data, we incurred fewer invocations.
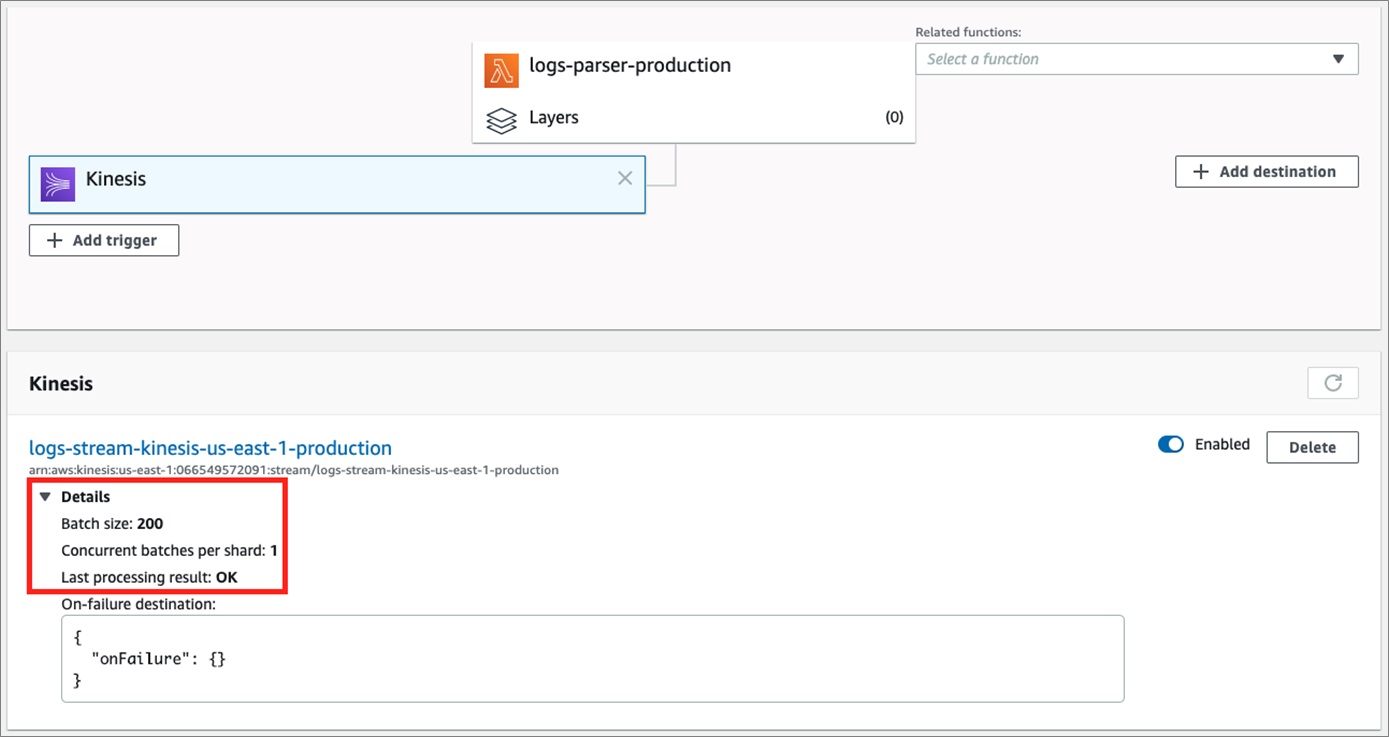
Figure 3 – Increasing KDS batch size reduced the number of invocations.
Since we were now handling bigger batches, we did not separately query the data of each record from DynamoDB. Instead, we used the batch_get_item call at the beginning of the process. It returns, in a single call, the enriched data for all the records.
For example:
Instead of storing the processed rows into the PostgreSQL RDS database individually, we batched them all into one INSERT CALL.
The combination of both optimizations, the use batch_get_item and a single INSERT call, saved us about 400ms of invocations, on average. With very few changes in code and one configuration parameter, we reduced our number from about ~1400ms to 1000ms of invocations.
Caching
When using an external data source, caching the data locally can make a lot of sense. If the data is accessed often, as it is by DynamoDB in our log parser, local copies can improve performance and reduce costs. Of course, local caching makes sense only if the data is not constantly changing at very fast intervals.
To implement simple caching in our log parser, we set an item in the cache by using the following pattern in Python:
The CACHE function gets the key and the value to set in our cache, and appends the timestamp that fed into the cache.
Now, let’s look on how to retrieve data from the cache:
Using these lines of Python code, we can implement local caching with a time-to-live (TTL) for each item. For our log parser, we selected 3600 seconds, or one hour. Our cached data can be shared by the same instance of Lambda invocation. It’s not shared between parallel instances, and newly initialized instances.
This approach reduces the number of calls to DynamoDB by 30 percent. It also reduces our average DB-second duration by another 100ms.
Set HTTP/HTTPS agent keepalive to True
In the Node.js sdk library, the default HTTP connection to AWS resources is set to ‘connection: close.’ It means that after every call, the connection is closed, and upon a new request, the whole handshake process starts from scratch.
In Node.js, you can set the keepAlive property of an HTTP or HTTPS agent to ‘true’. For example:
The preceding code globally sets the ‘connection: keep-alive’ flag for all clients. For more information on this setting, see Reusing Connections with Keep-Alive in Node.js. With Python and AWS SDK for Python (Boto3), the setting is unnecessary as ‘connection: close’ is not set as default.
In our log parser, setting keepAlive to true didn’t introduce a significant performance improvement. We only improved by about 50ms because we were already batching our calls, and in this specific function we didn’t make many calls using the aws-sdk resources. However, in many other cases we managed to remove hundreds of milliseconds from our function duration.
Initialize Connections Outside of the Handler
This tip is already familiar to most engineers: don’t initialize a client or connection from inside your handler function. Instead, initialize the client or connection from outside your handler function.
Let’s examine the following scenario:
In the preceding code, if the connection to our database takes 20ms, it means that every invocation incurs an extra duration that is not really necessary. Instead, we take all connections out of the handler function so it will take place only once, when a new function instance spawns:
This change improves performance further, especially on high concurrent Lambda functions. We saved another 30ms on average.
Tuning Memory Configuration
It became clear to us the function’s memory also affects the CPU and network performance. Choosing the right amount of memory can result in a faster function, and in some cases, lower cost.
The memory calculation can be tricky, but we’ll use a simple example to get across the basic idea.
If a function is running at 1000ms on average, and we define it with 128MBs, the price per invocation would be ~$0.000002. If doubling the memory would also double the performance, if the function had 256MB memory, it would run at 500ms on average. This means the price per invocation would be ~$0.000002. The same price, but twice as fast.
Let’s compare a few more scenarios:
| Memory | Average Duration | Price |
| 128MB | 1000ms | ~$0.000002 |
| 256MB | 500ms | ~$0.000002 |
| 512MB | 250ms | ~$0.0000024 |
Note that 512MB of memory increases the cost because the pricing of an invocation is rounded up to the nearest 100ms; hence, we’re paying for 300ms.
The hardest part is to understand which memory size works best for each Lambda function. Luckily, with the open source lambda-memory-performance-benchmark, we were able to measure the best performance configuration:=.
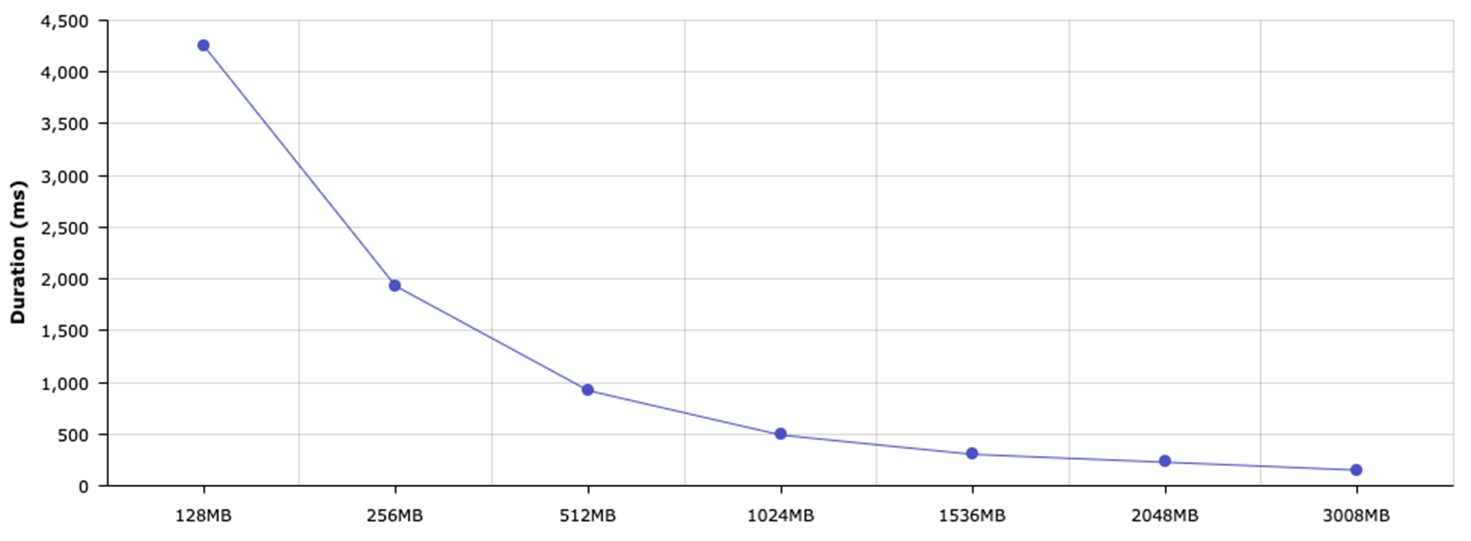
Figure 4 – Caption goes here.
Our 512MB configuration resulted in ~950ms on average, whereas a 1536MB configuration resulted in ~304ms. To take our analysis even further, we selected 1644MB of memory, and it resulted in less than 300ms.
The main reason to go with 1644MB is the 100ms interval pricing. On such a high scale, this 15ms difference between 290ms and 305ms has a significant impact on cost.
Conclusion
Our optimization process helped us realize that with proper visibility into our stack, we were able to clearly identify what and how to optimize. We not only improved the performance of the main AWS Lambda function in our pipeline, but also reduced the cost of the others services: Amazon Kinesis Data Streams, Amazon DynamoDB, and Amazon RDS tables:
| Resource | Before | After | Why |
| AWS Lambda | $1,850 | $350 |
Fewer invocations Faster average duration |
| Amazon DynamoDB | $800 | $500 | Fewer calls (less Read Capacity Units) |
| Amazon Kinesis Data Stream | $270 | $120 | Fewer shards since invocations run faster |
| Amazon RDS | $510 | $260 | Fewer concurrent calls (reduced IOPS, a smaller instance could be used) |
Overall, we managed to improve the performance by x4 (~1400ms to ~300ms) for an improved customer experience, while also reducing the overall cost of this service by 65 percent ($3,430 to $1,230 monthly).
It’s important to understand that when the scale is large, each small improvement in performance can dramatically impact the overall cost of services.
To get started measuring the performance and costs of your functions, use:
- lambda-memory-performance-benchmark (open source)
- lambda-cost-calculator (open source)
- Epsagon platform
.

.
Epsagon – APN Partner Spotlight
Epsagon is an AWS Competency Partner specializing in automated tracing for cloud microservices. Its solution builds on AWS tools by providing automated end-to-end tracing across distributed AWS services, and services outside of AWS.
Contact Epsagon | Solution Overview | AWS Marketplace
*Already worked with Epsagon? Rate this Partner
*To review an APN Partner, you must be an AWS customer that has worked with them directly on a project.