Artificial Intelligence
Seamlessly connect Amazon Athena with Amazon Lookout for Metrics to detect anomalies
Amazon Lookout for Metrics is an AWS service that uses machine learning (ML) to automatically monitor the metrics that are most important to businesses with greater speed and accuracy. The service also makes it easier to diagnose the root cause of anomalies, such as unexpected dips in revenue, high rates of abandoned shopping carts, spikes in payment transaction failures, increases in new user sign-ups, and many more. Lookout for Metrics goes beyond simple anomaly detection. It allows developers to set up autonomous monitoring for important metrics to detect anomalies and identify their root cause in a matter of a few clicks to detect anomalies in its metrics—all with no ML experience required.
Amazon Athena is an interactive query service that makes it easy to analyze data in Amazon Simple Storage Service (Amazon S3) using standard SQL. Simply point to your data in Amazon S3, define the schema, and start querying using standard SQL. Most results are delivered within seconds. With Athena, there’s no need for complex ETL jobs to prepare your data for analysis. This makes it easy for anyone with SQL skills to quickly analyze large-scale datasets.
With today’s launch, Lookout for Metrics can now seamlessly connect to your data in Athena to set up highly accurate anomaly detectors. This lets you quickly deploy state-of-the-art anomaly detection via ML with Lookout for Metrics against any datasets that are available in Athena.
Athena connectivity extends the capabilities of Lookout for Metrics by bringing the following benefits:
- It extends the capabilities of Lookout for Metrics in terms of filetype support. Prior to this, Lookout for Metrics supported CSV and JSONLines formatted files, but with Athena this has been expanded to Parquet, Avro, Plaintext, and more. If you can parse it via Athena, then it’s now possible to import and leverage with Lookout for Metrics.
- It also introduces support for data with federated queries. Prior to this launch, if your data was stored in multiple databases or sources, you would need to define a complete complex ETL process as well as manage its performance characteristics before you could export all of the data into a CSV or JSONLines file and input it into Lookout for Metrics for Anomaly Detection. With federated queries from Athena, you define the disparate sources as well as how the join should be performed and when the data has been processed and can be queried by Athena, it’s immediately ready for Lookout for Metrics. This enables you to hand over the burden for data transformation, aggregation, and delivery location to Athena and just focus on the identified anomalies from Lookout for Metrics.
Solution overview
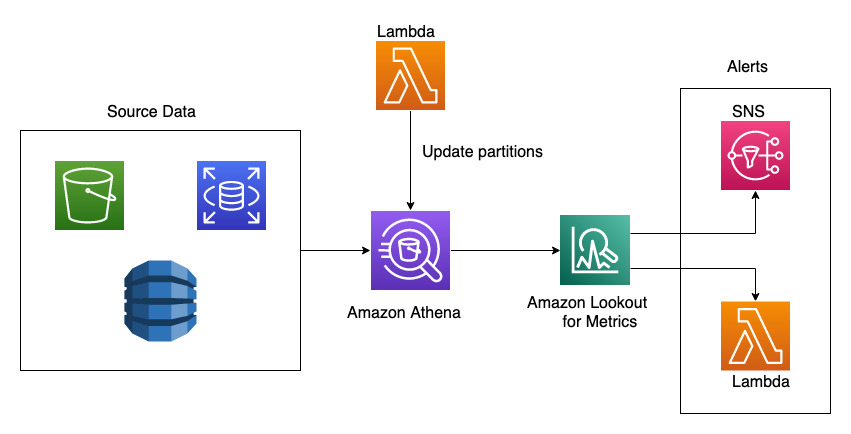
In this post, we demonstrate how to integrate an Athena table and detect anomalies in the revenue metrics. We also track how order rate and inventory metrics are impacted. The source data lies in Amazon S3 and we’ve configured Athena tables to be able to query the data in it. An AWS Lambda is responsible for updating the partitions within Athena, which are used by Lookout for Metrics to detect anomalies. This solution enables you to use an Athena data source for Lookout for Metrics.
You could use the provided AWS CloudFormation stack to set up resources for the walkthrough. It contains resources to continuously generate live data and makes them query-able in Athena.
- Launch the stack from the following link and select next on the Create Stack page.

- On the Specify stack details page, add the values from above, give it a Stack name (for example,
L4MAthenaDetector), and select Next. - On the Configure stack options page, leave everything as-is and select Next.
Set up a new detector with Athena as the data source
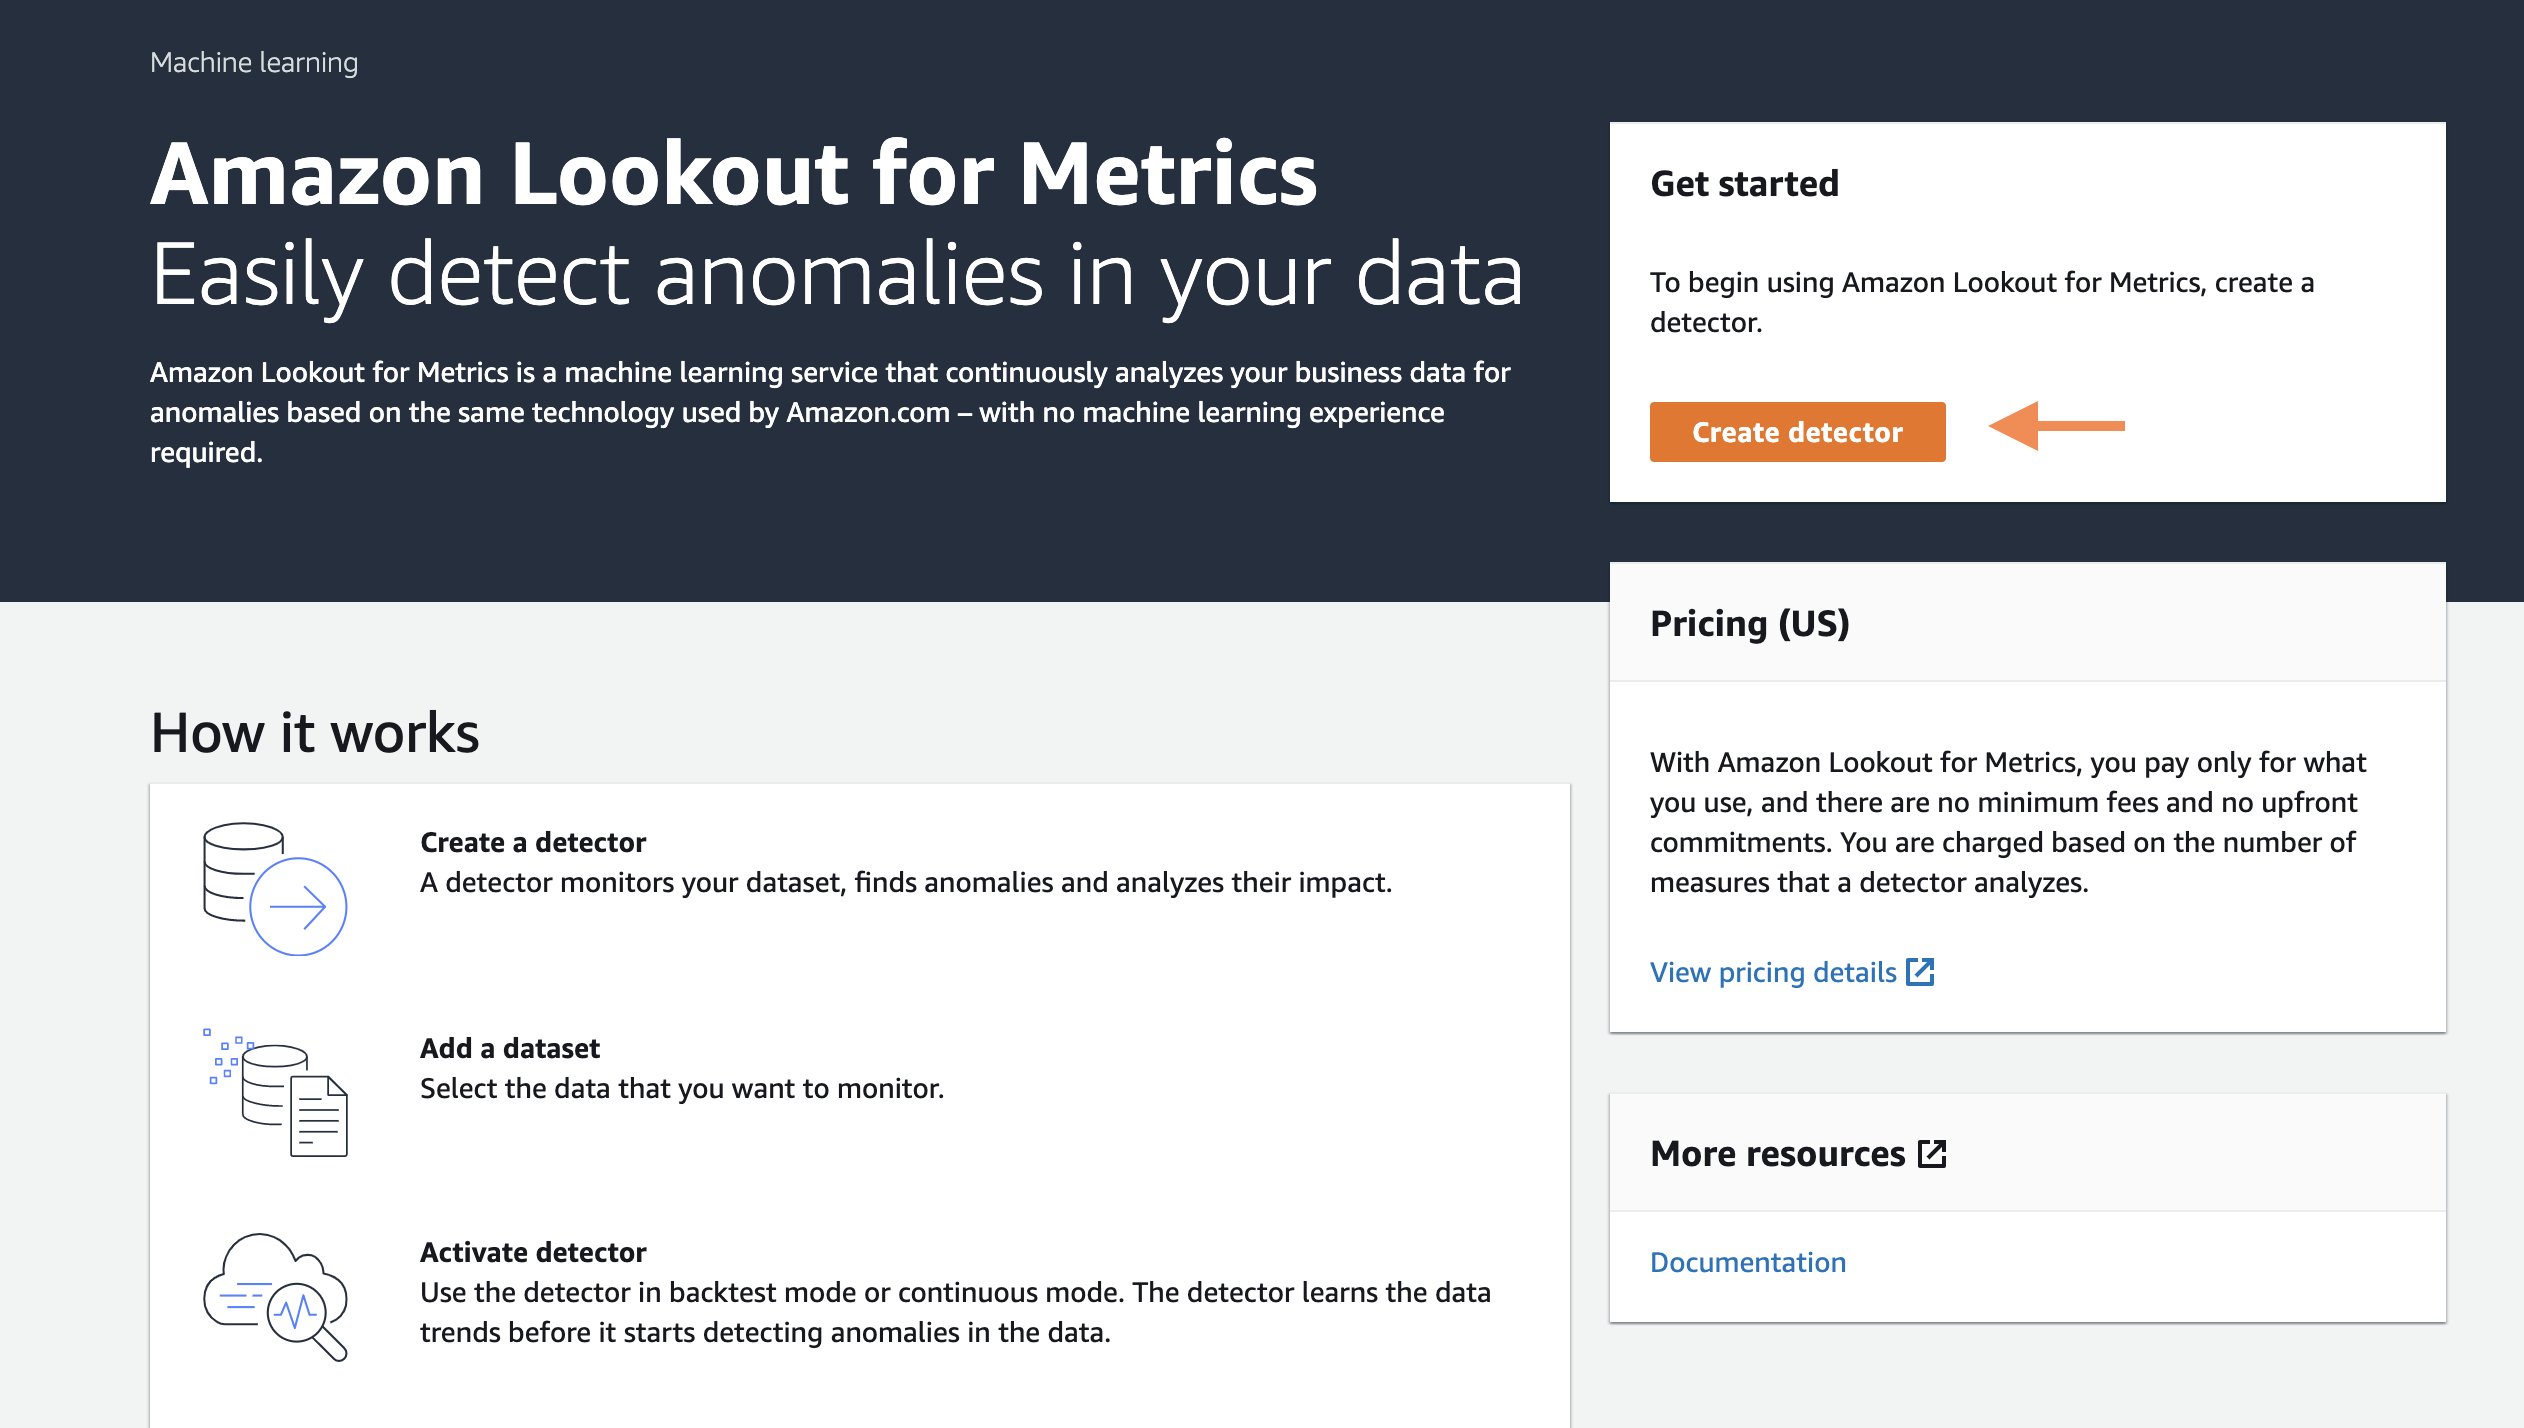
Step 1
Log in to the AWS Console to get started with creating an Anomaly Detector with Lookout for Metrics. The first step is to select the “Create detector” button.
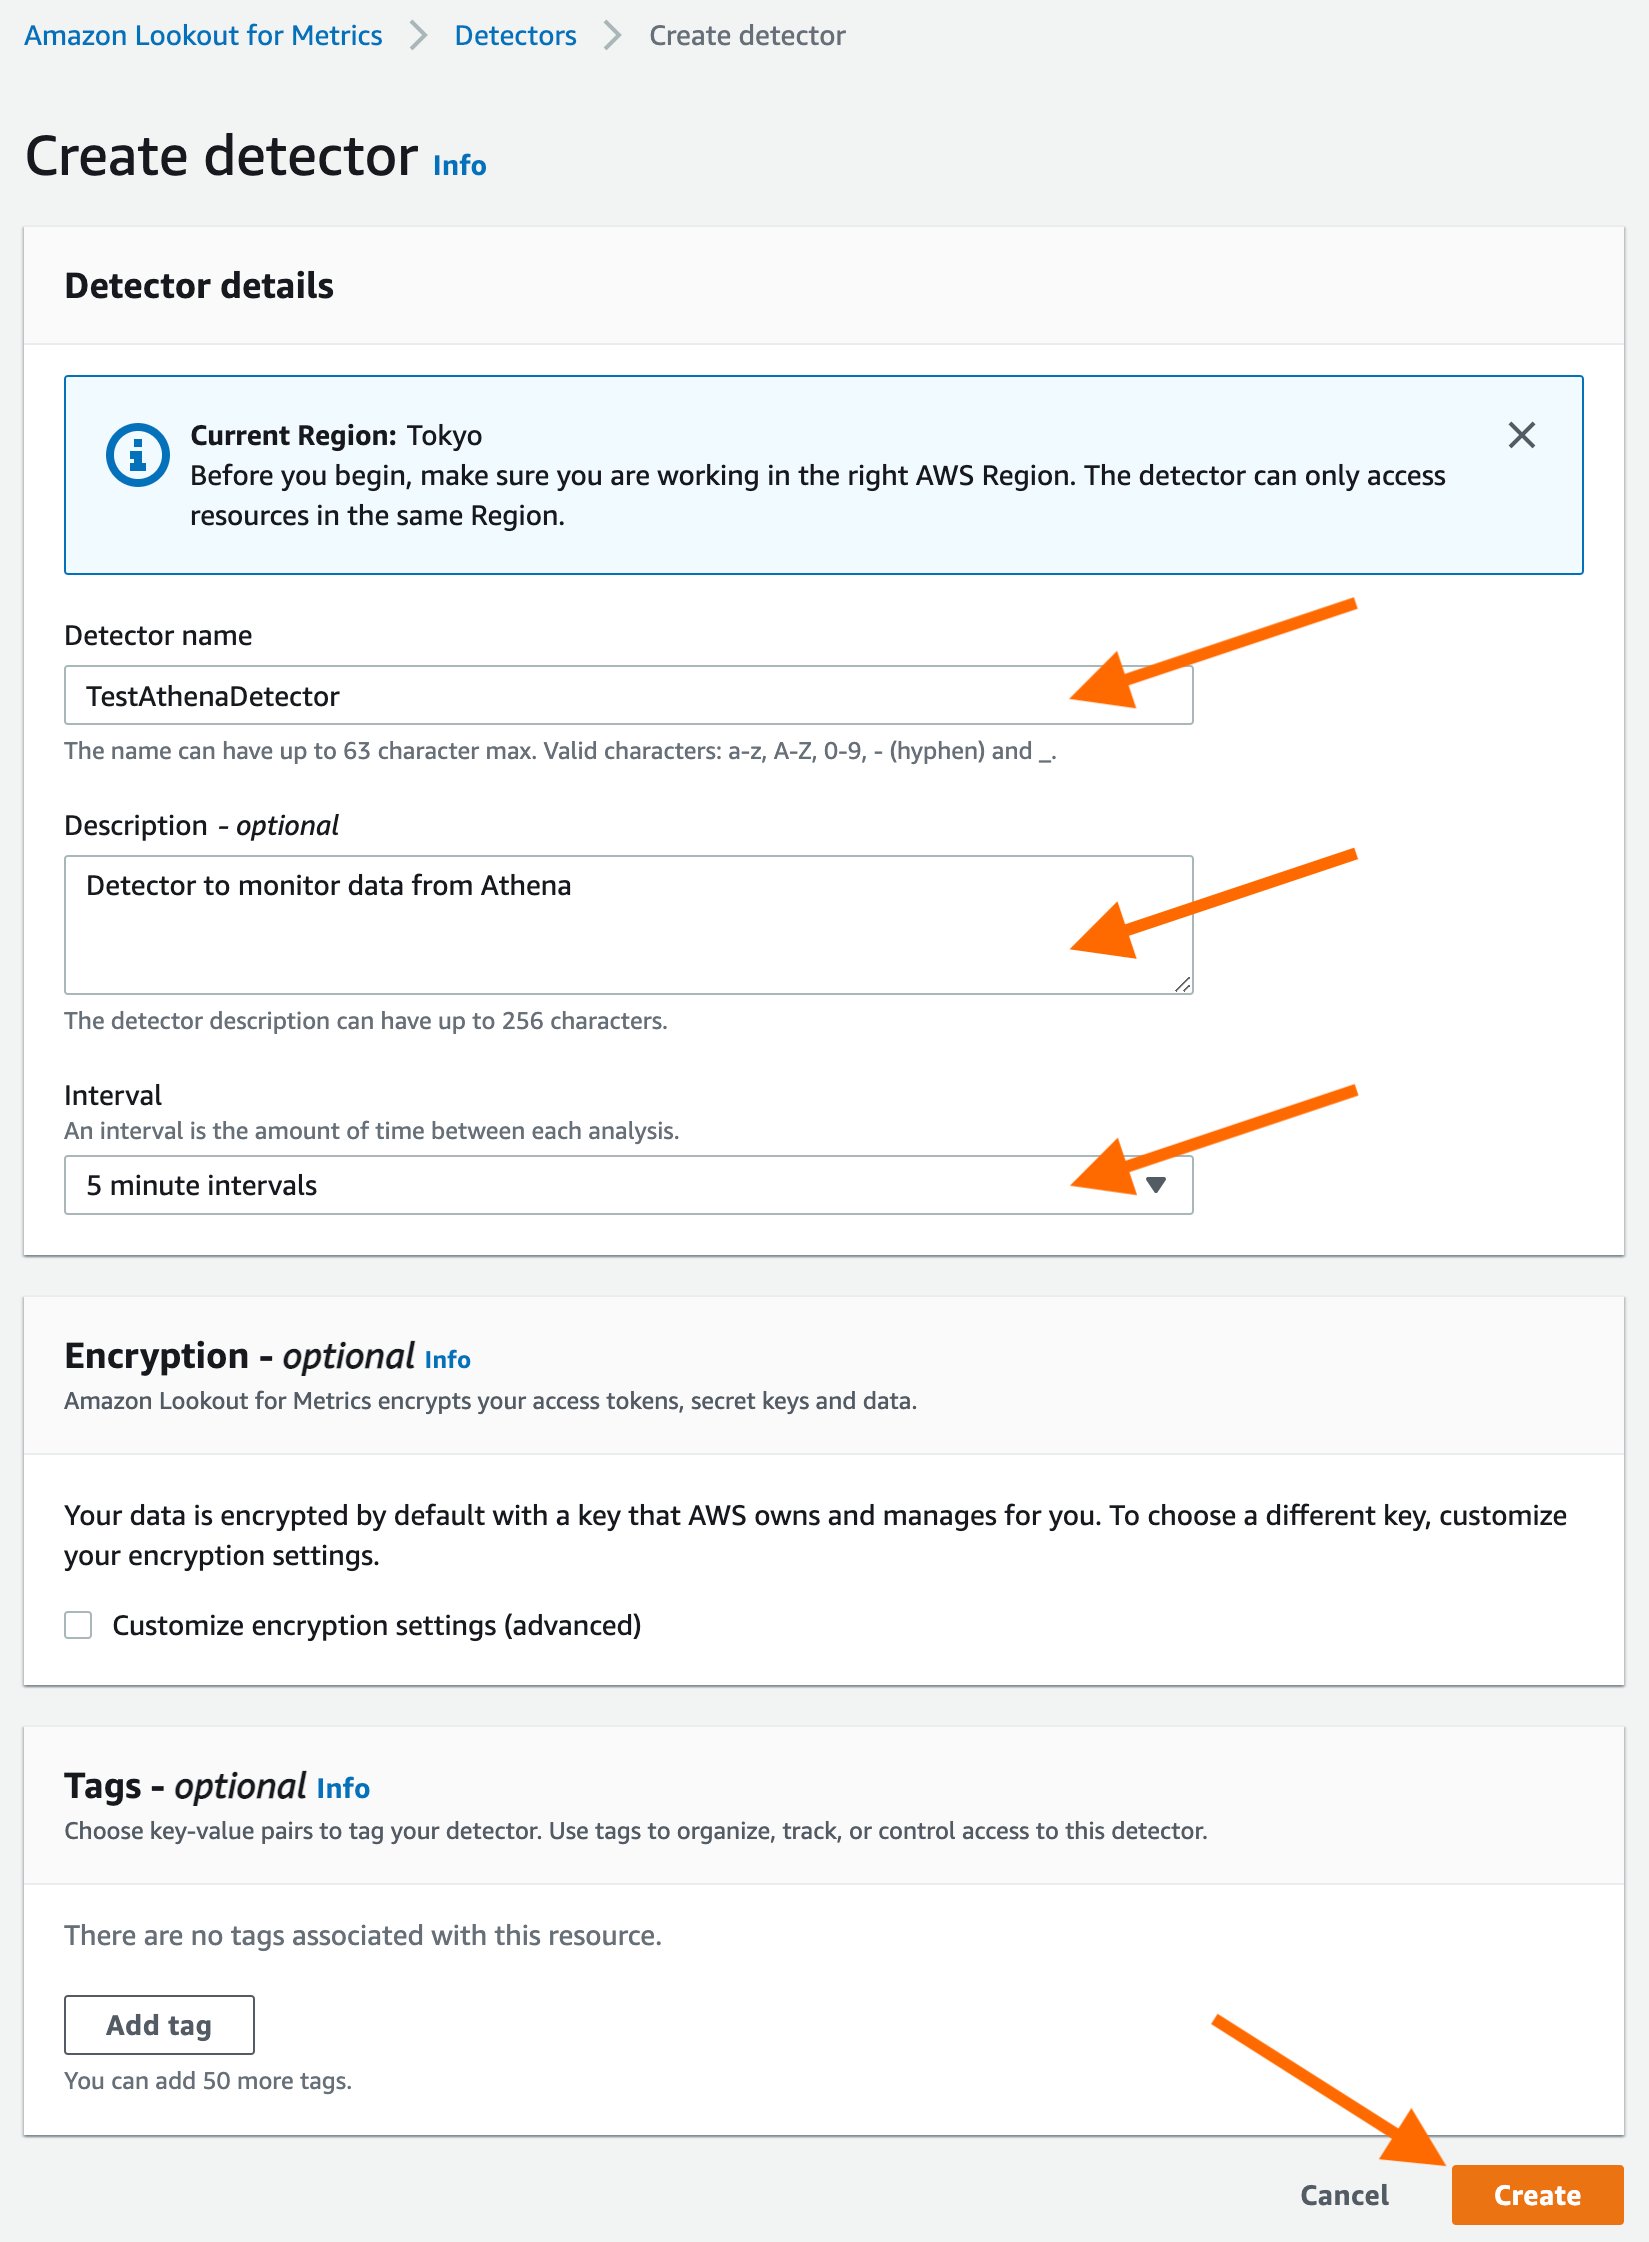
Step 2
Fill out the mandatory detector fields like name. Select the detection interval for the detector, which is determined by the frequency at which you want Lookout for Metrics to query your data and monitor them for anomalies. Encryption information is not mandatory. Encryption information allows Lookout for Metrics to encrypt your data using your AWS Key Management Service (KMS) key. In this example, we’ll skip adding an encryption key, Lookout for Metrics would use default encryption to encrypt your data if no encryption information is provided, and proceed by selecting the “Create” button.
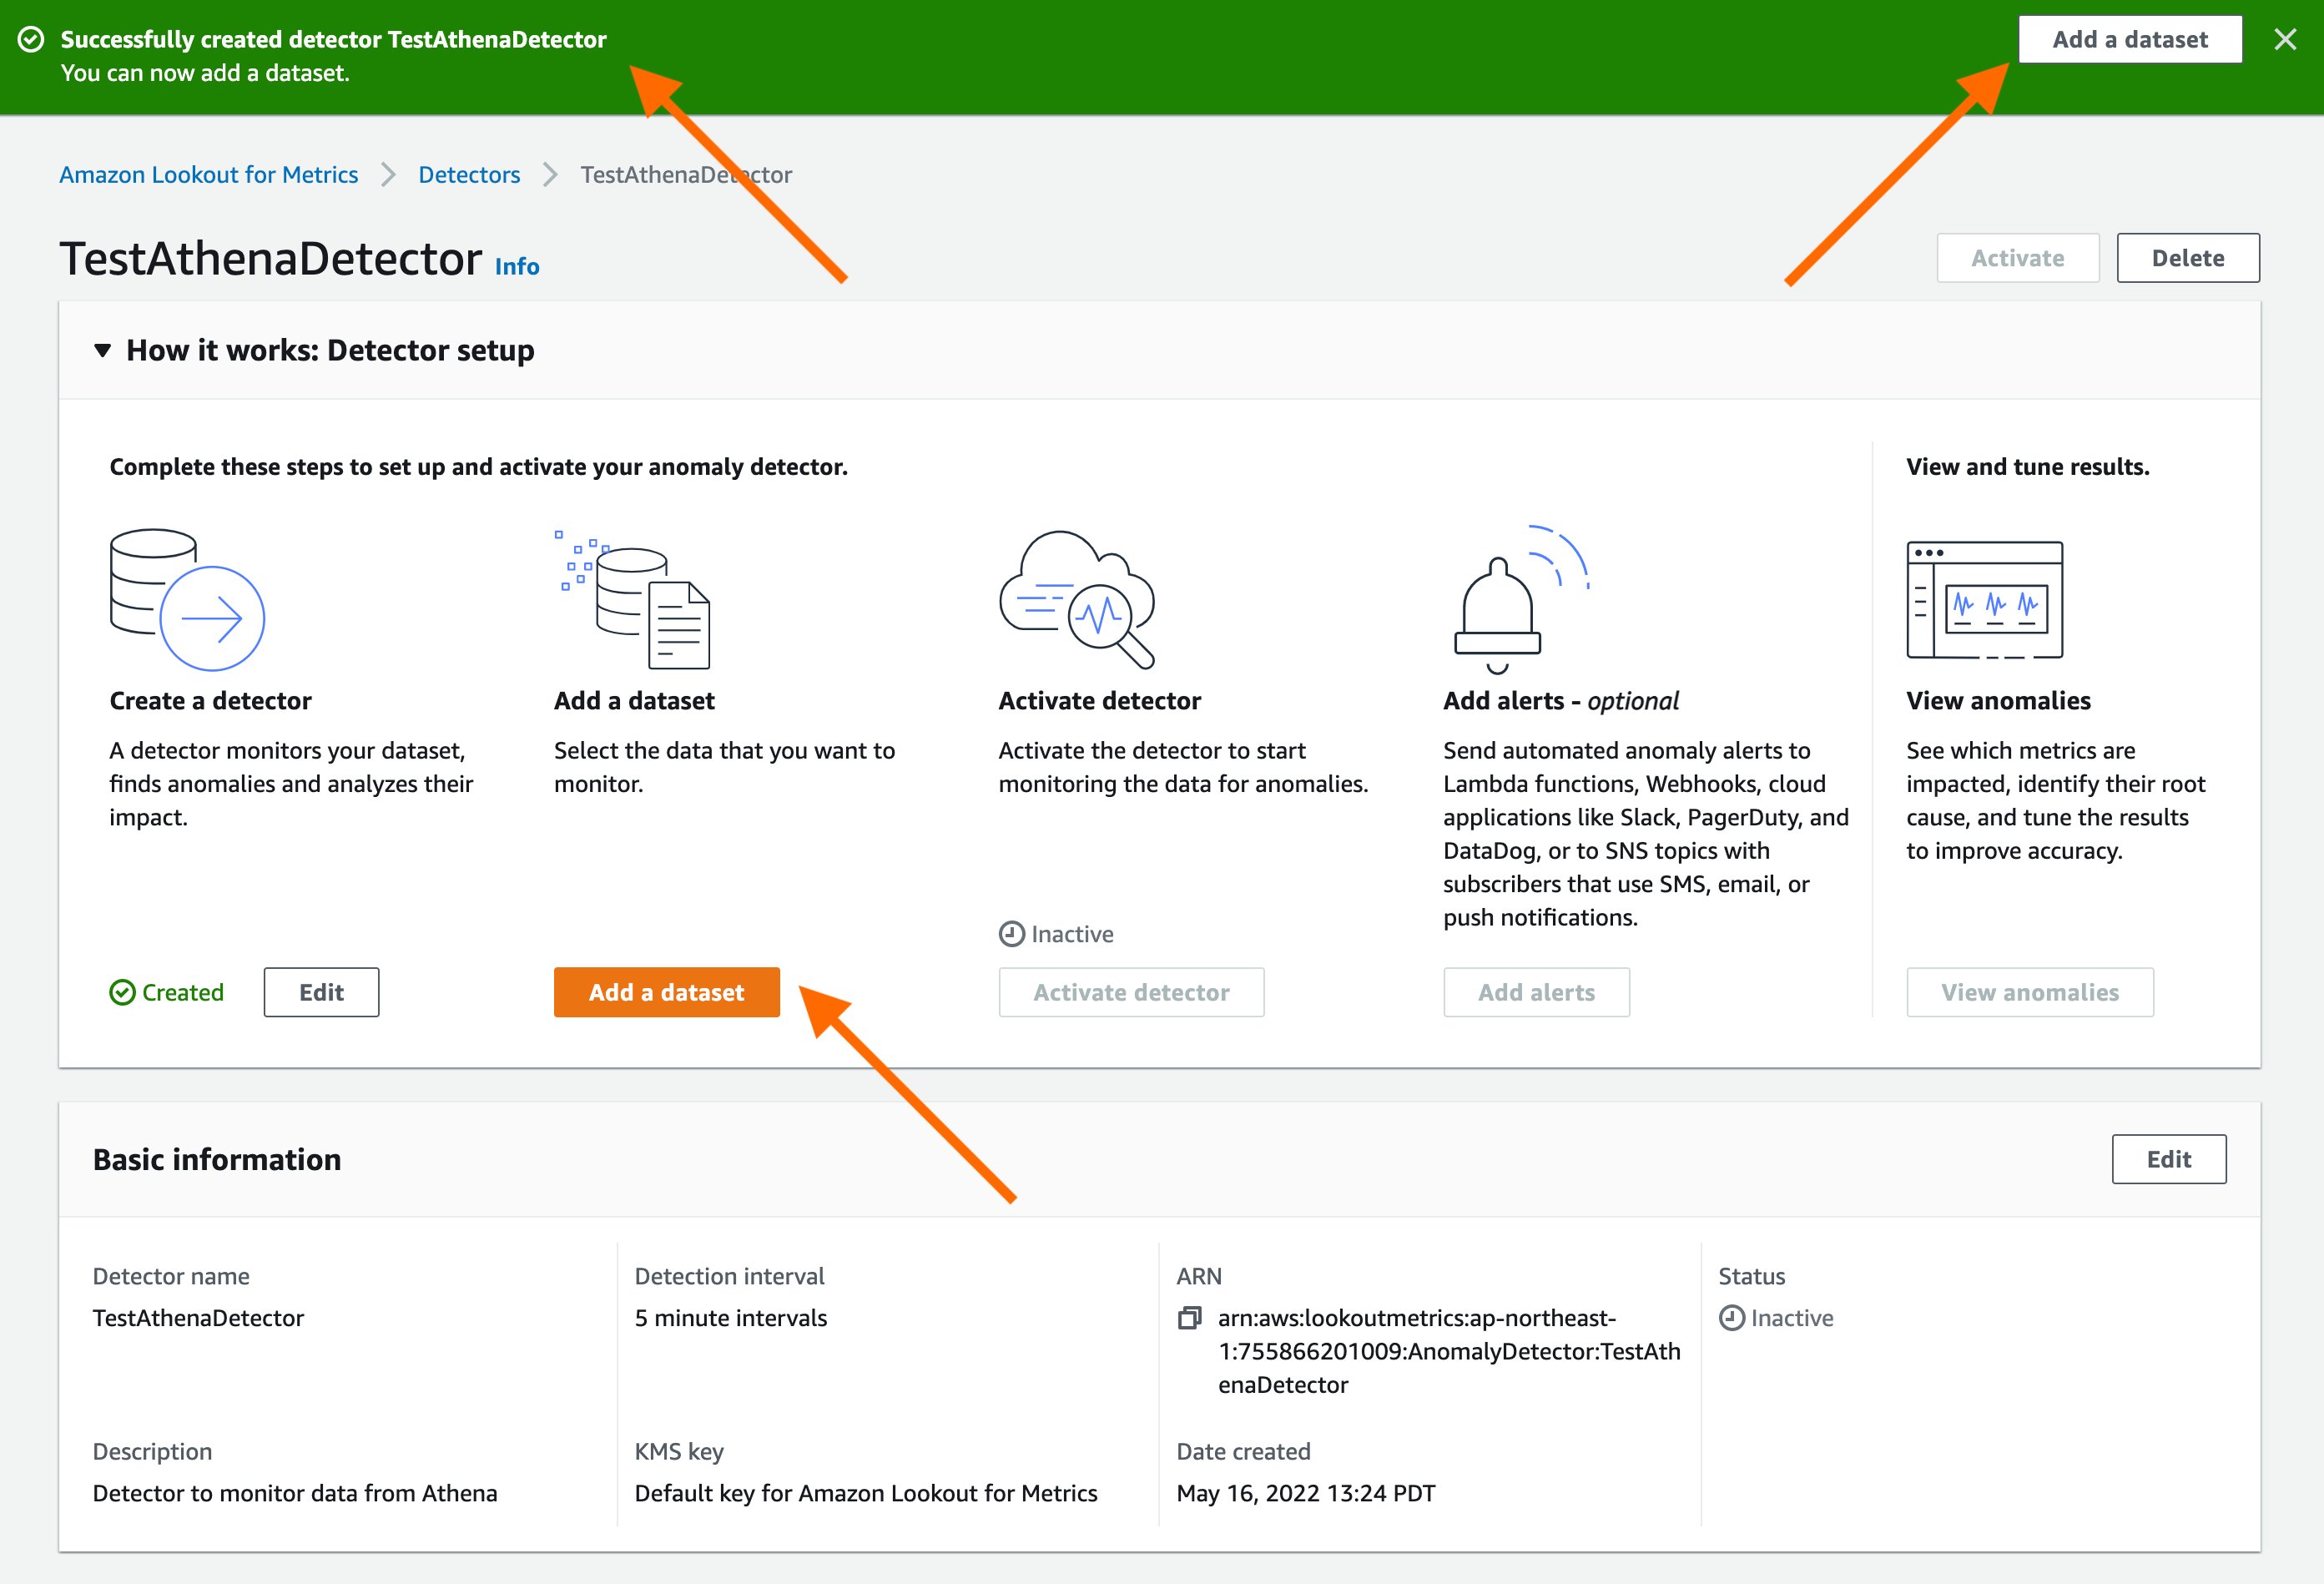
Step 3
Upon creation of the anomaly detector, you’ll see confirmation in a banner at the top. You can proceed by selecting “Add a dataset” through either the banner or the button under “Add a dataset”.
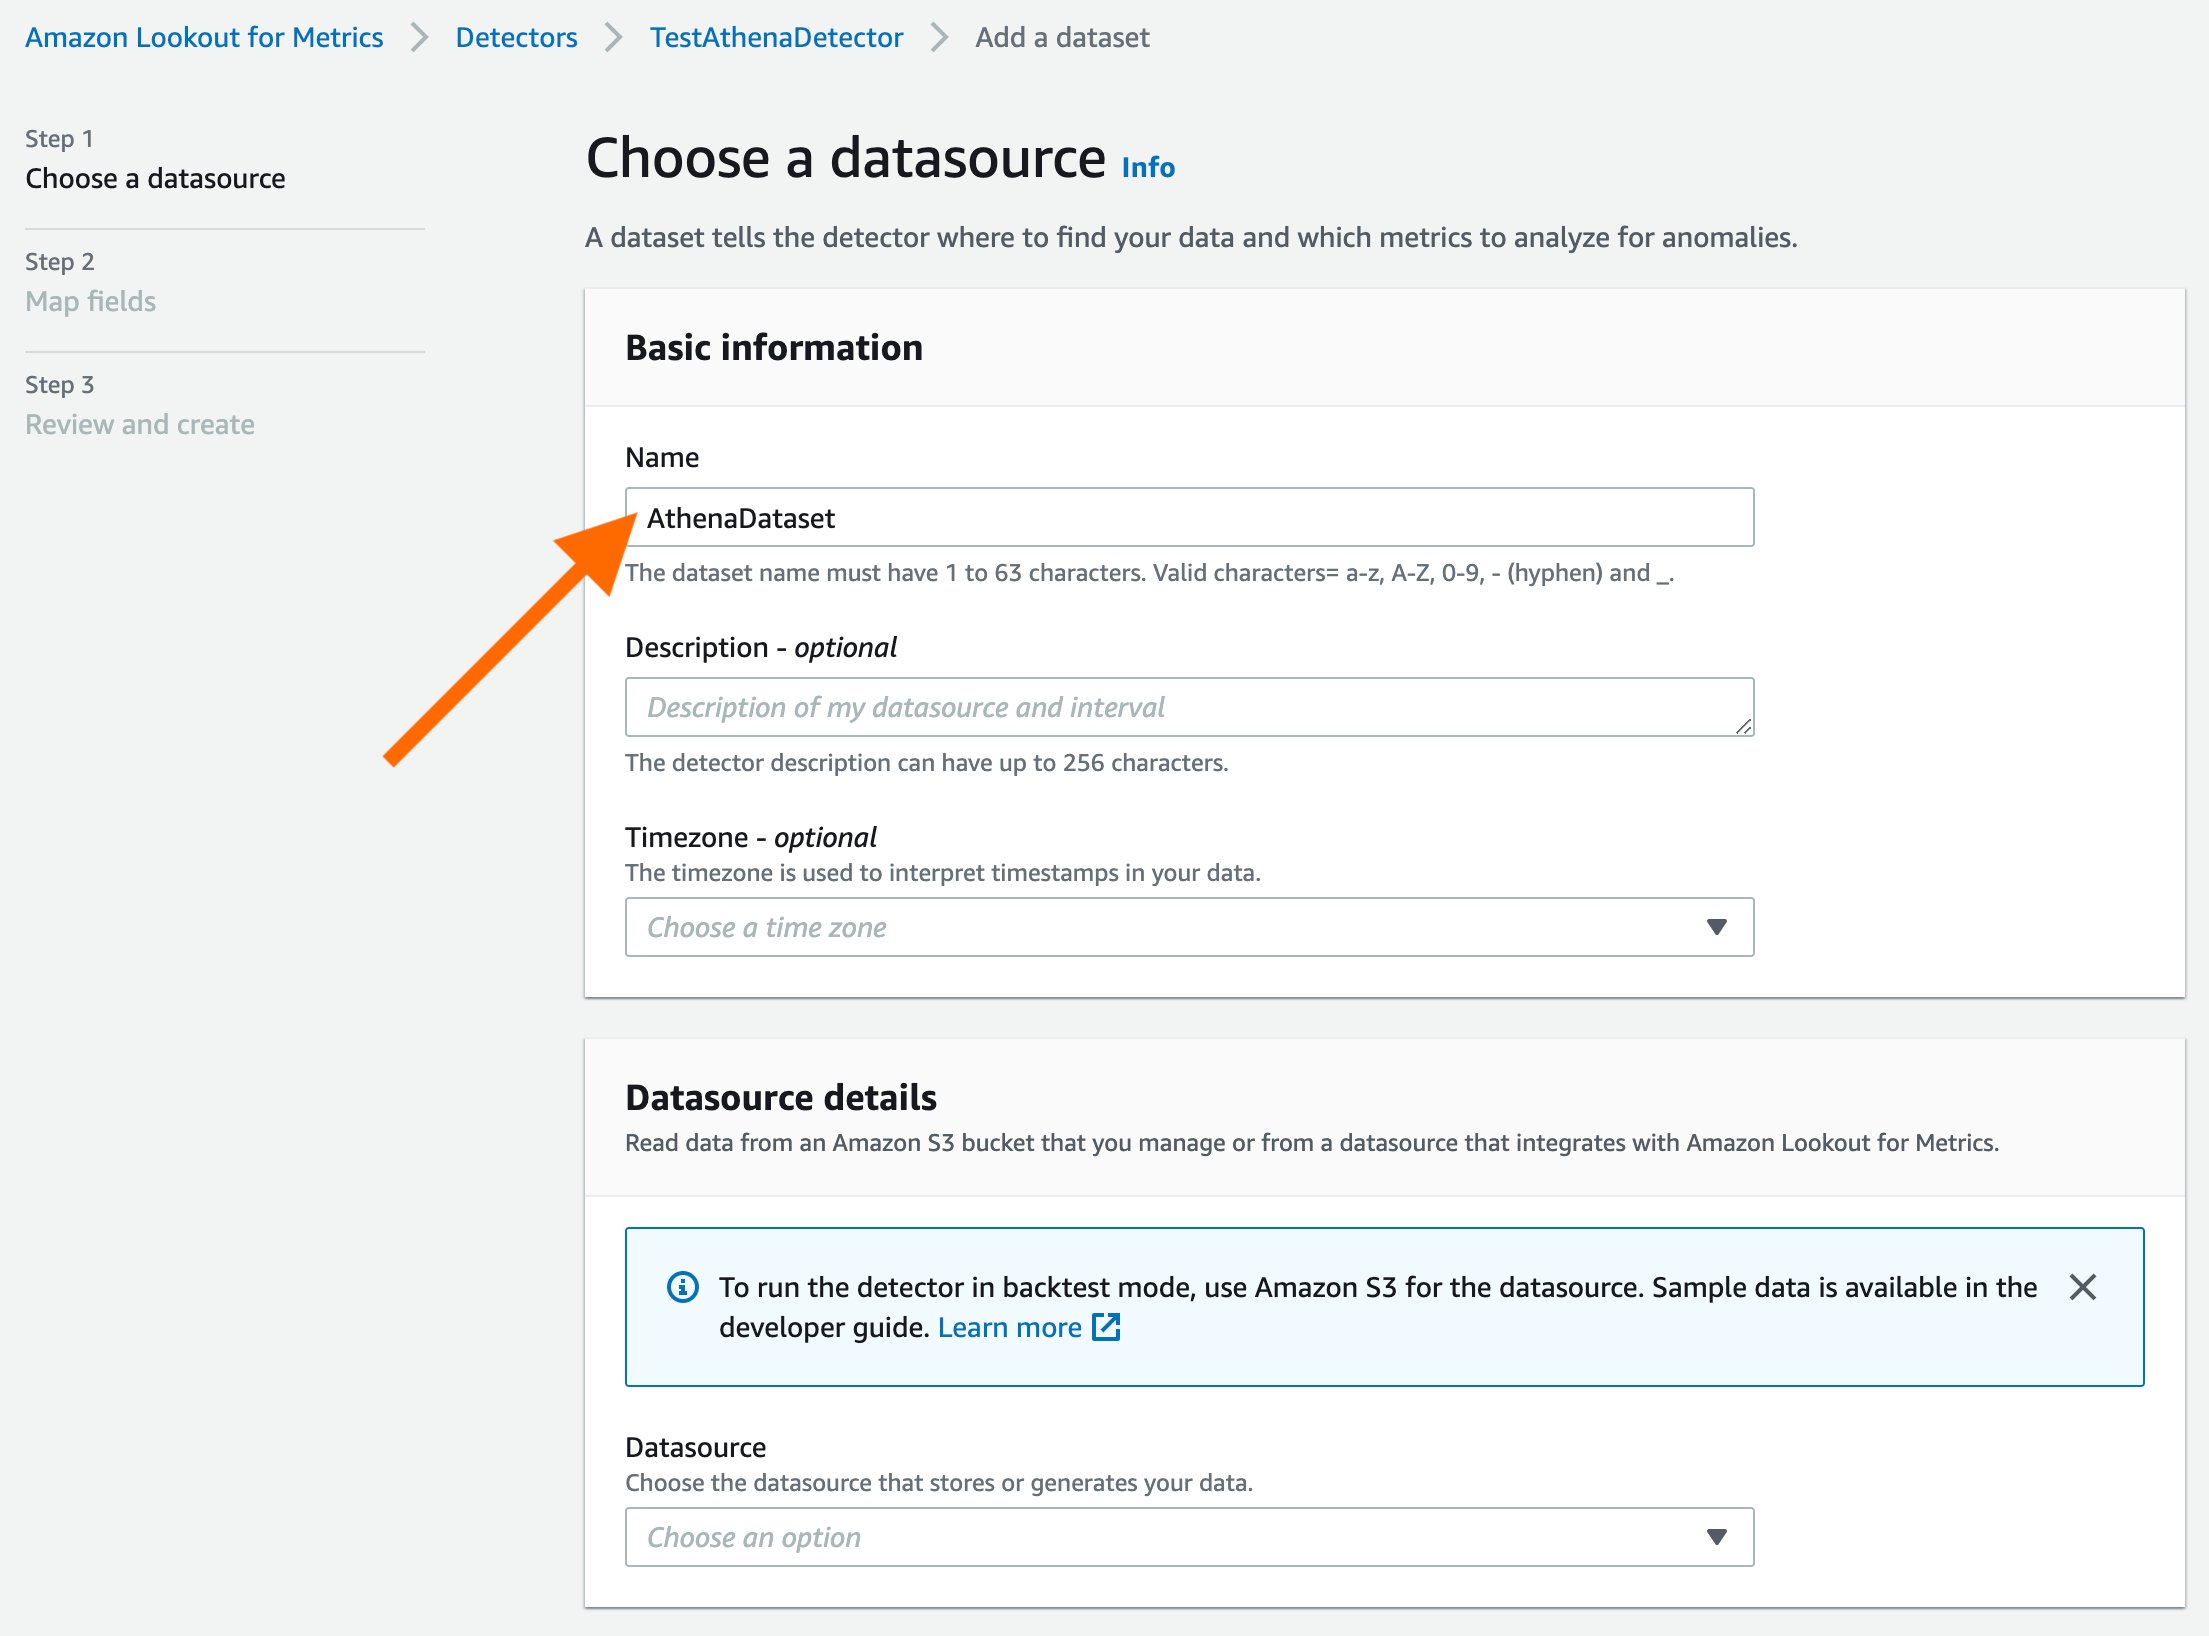
Fill out the basic information for the data source. Timezone is an optional field. Select the dropdown to select a data source.
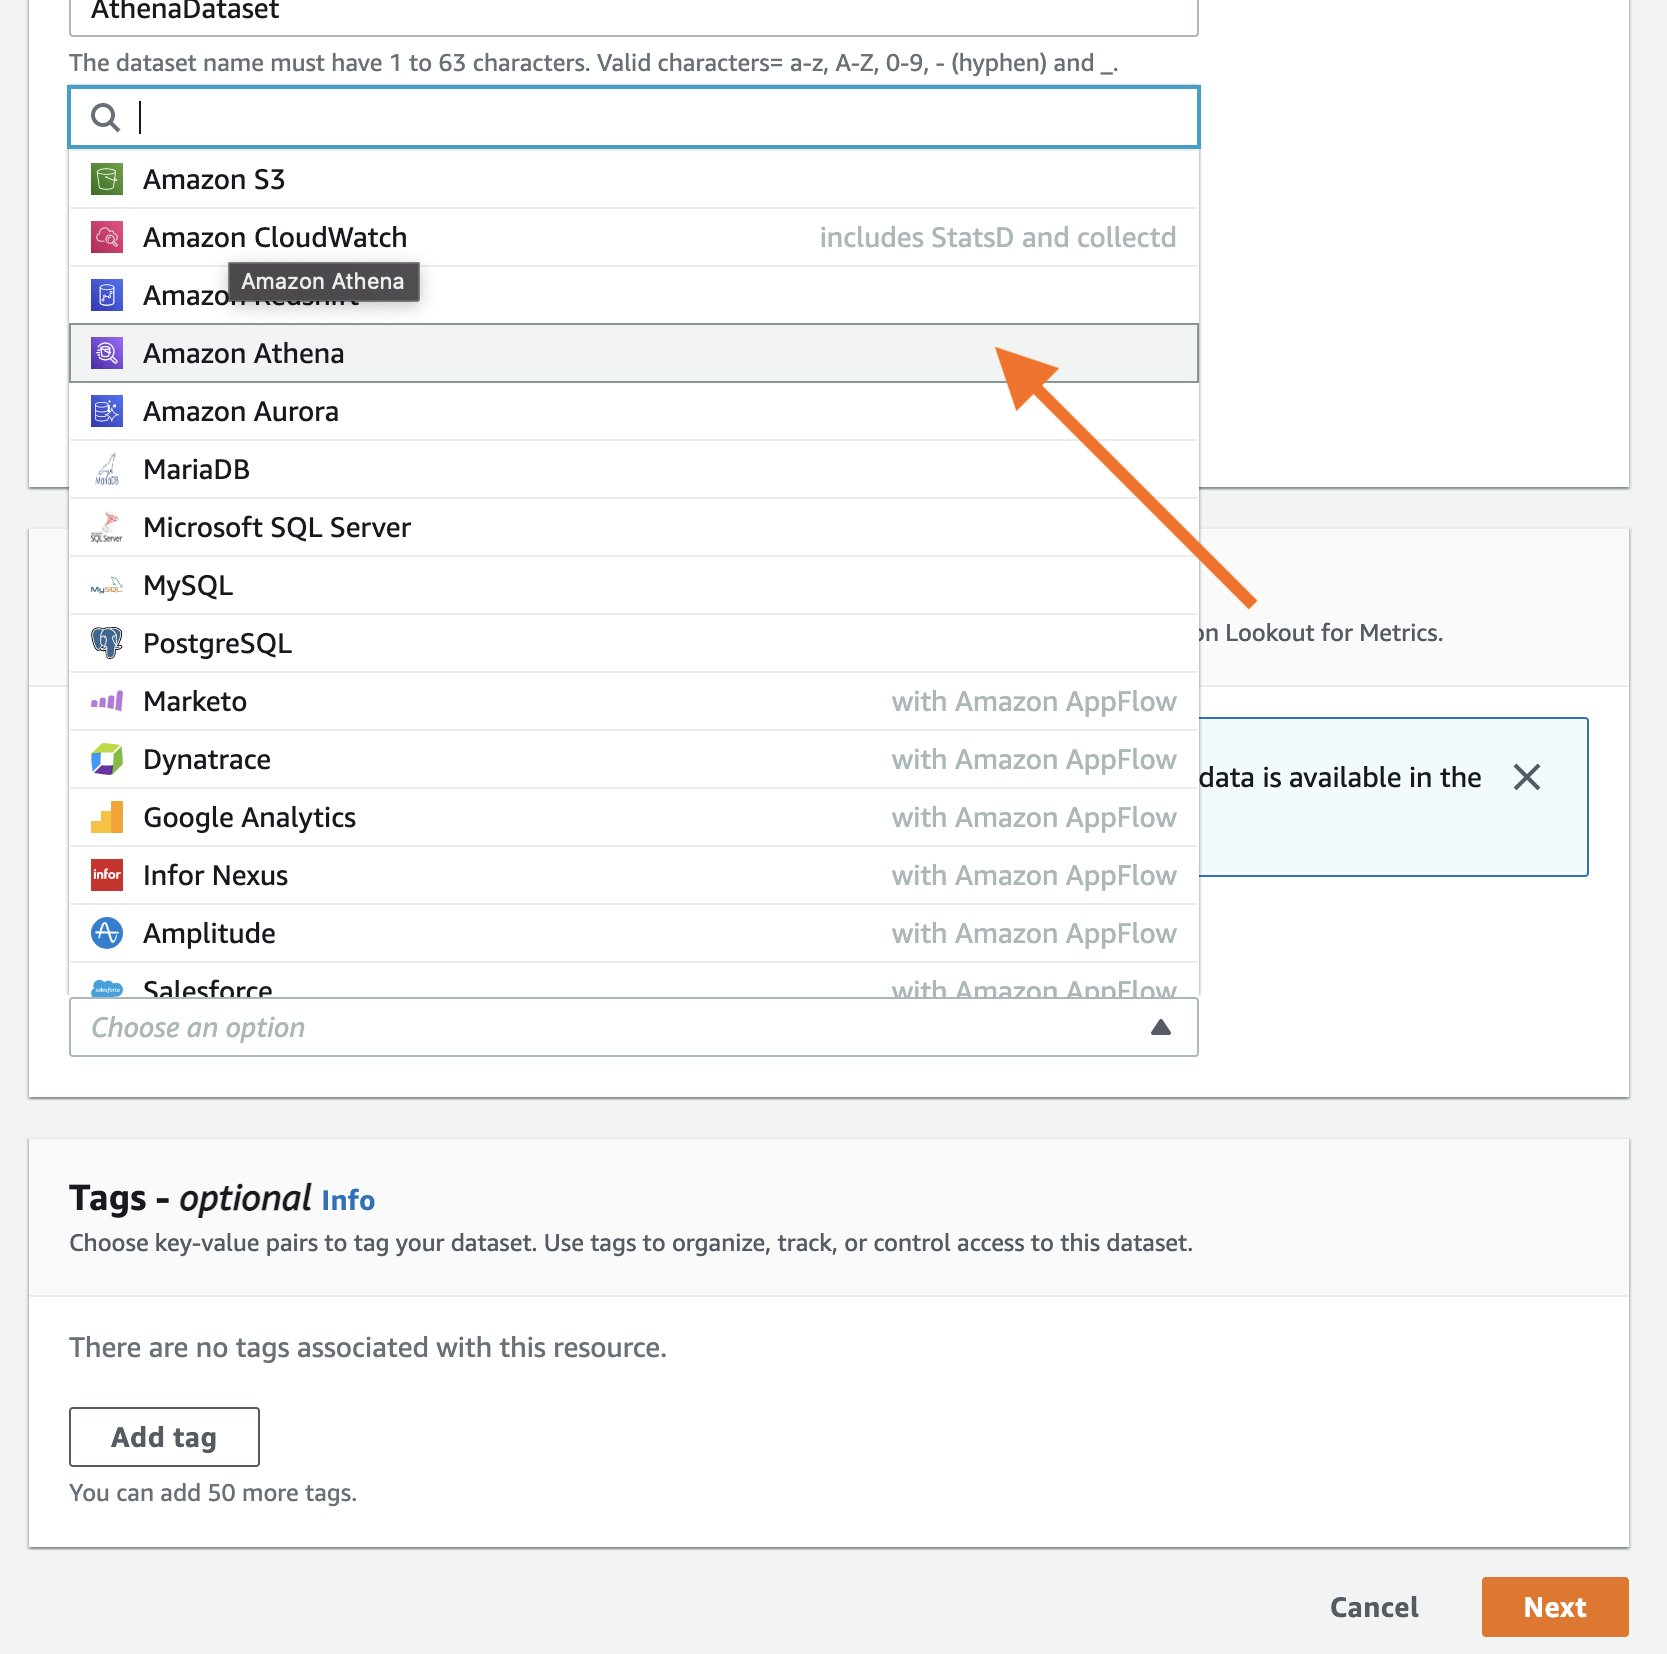
Lookout for Metrics supports multiple data sources as a convenience for customers. For this example, we’ll select Athena.
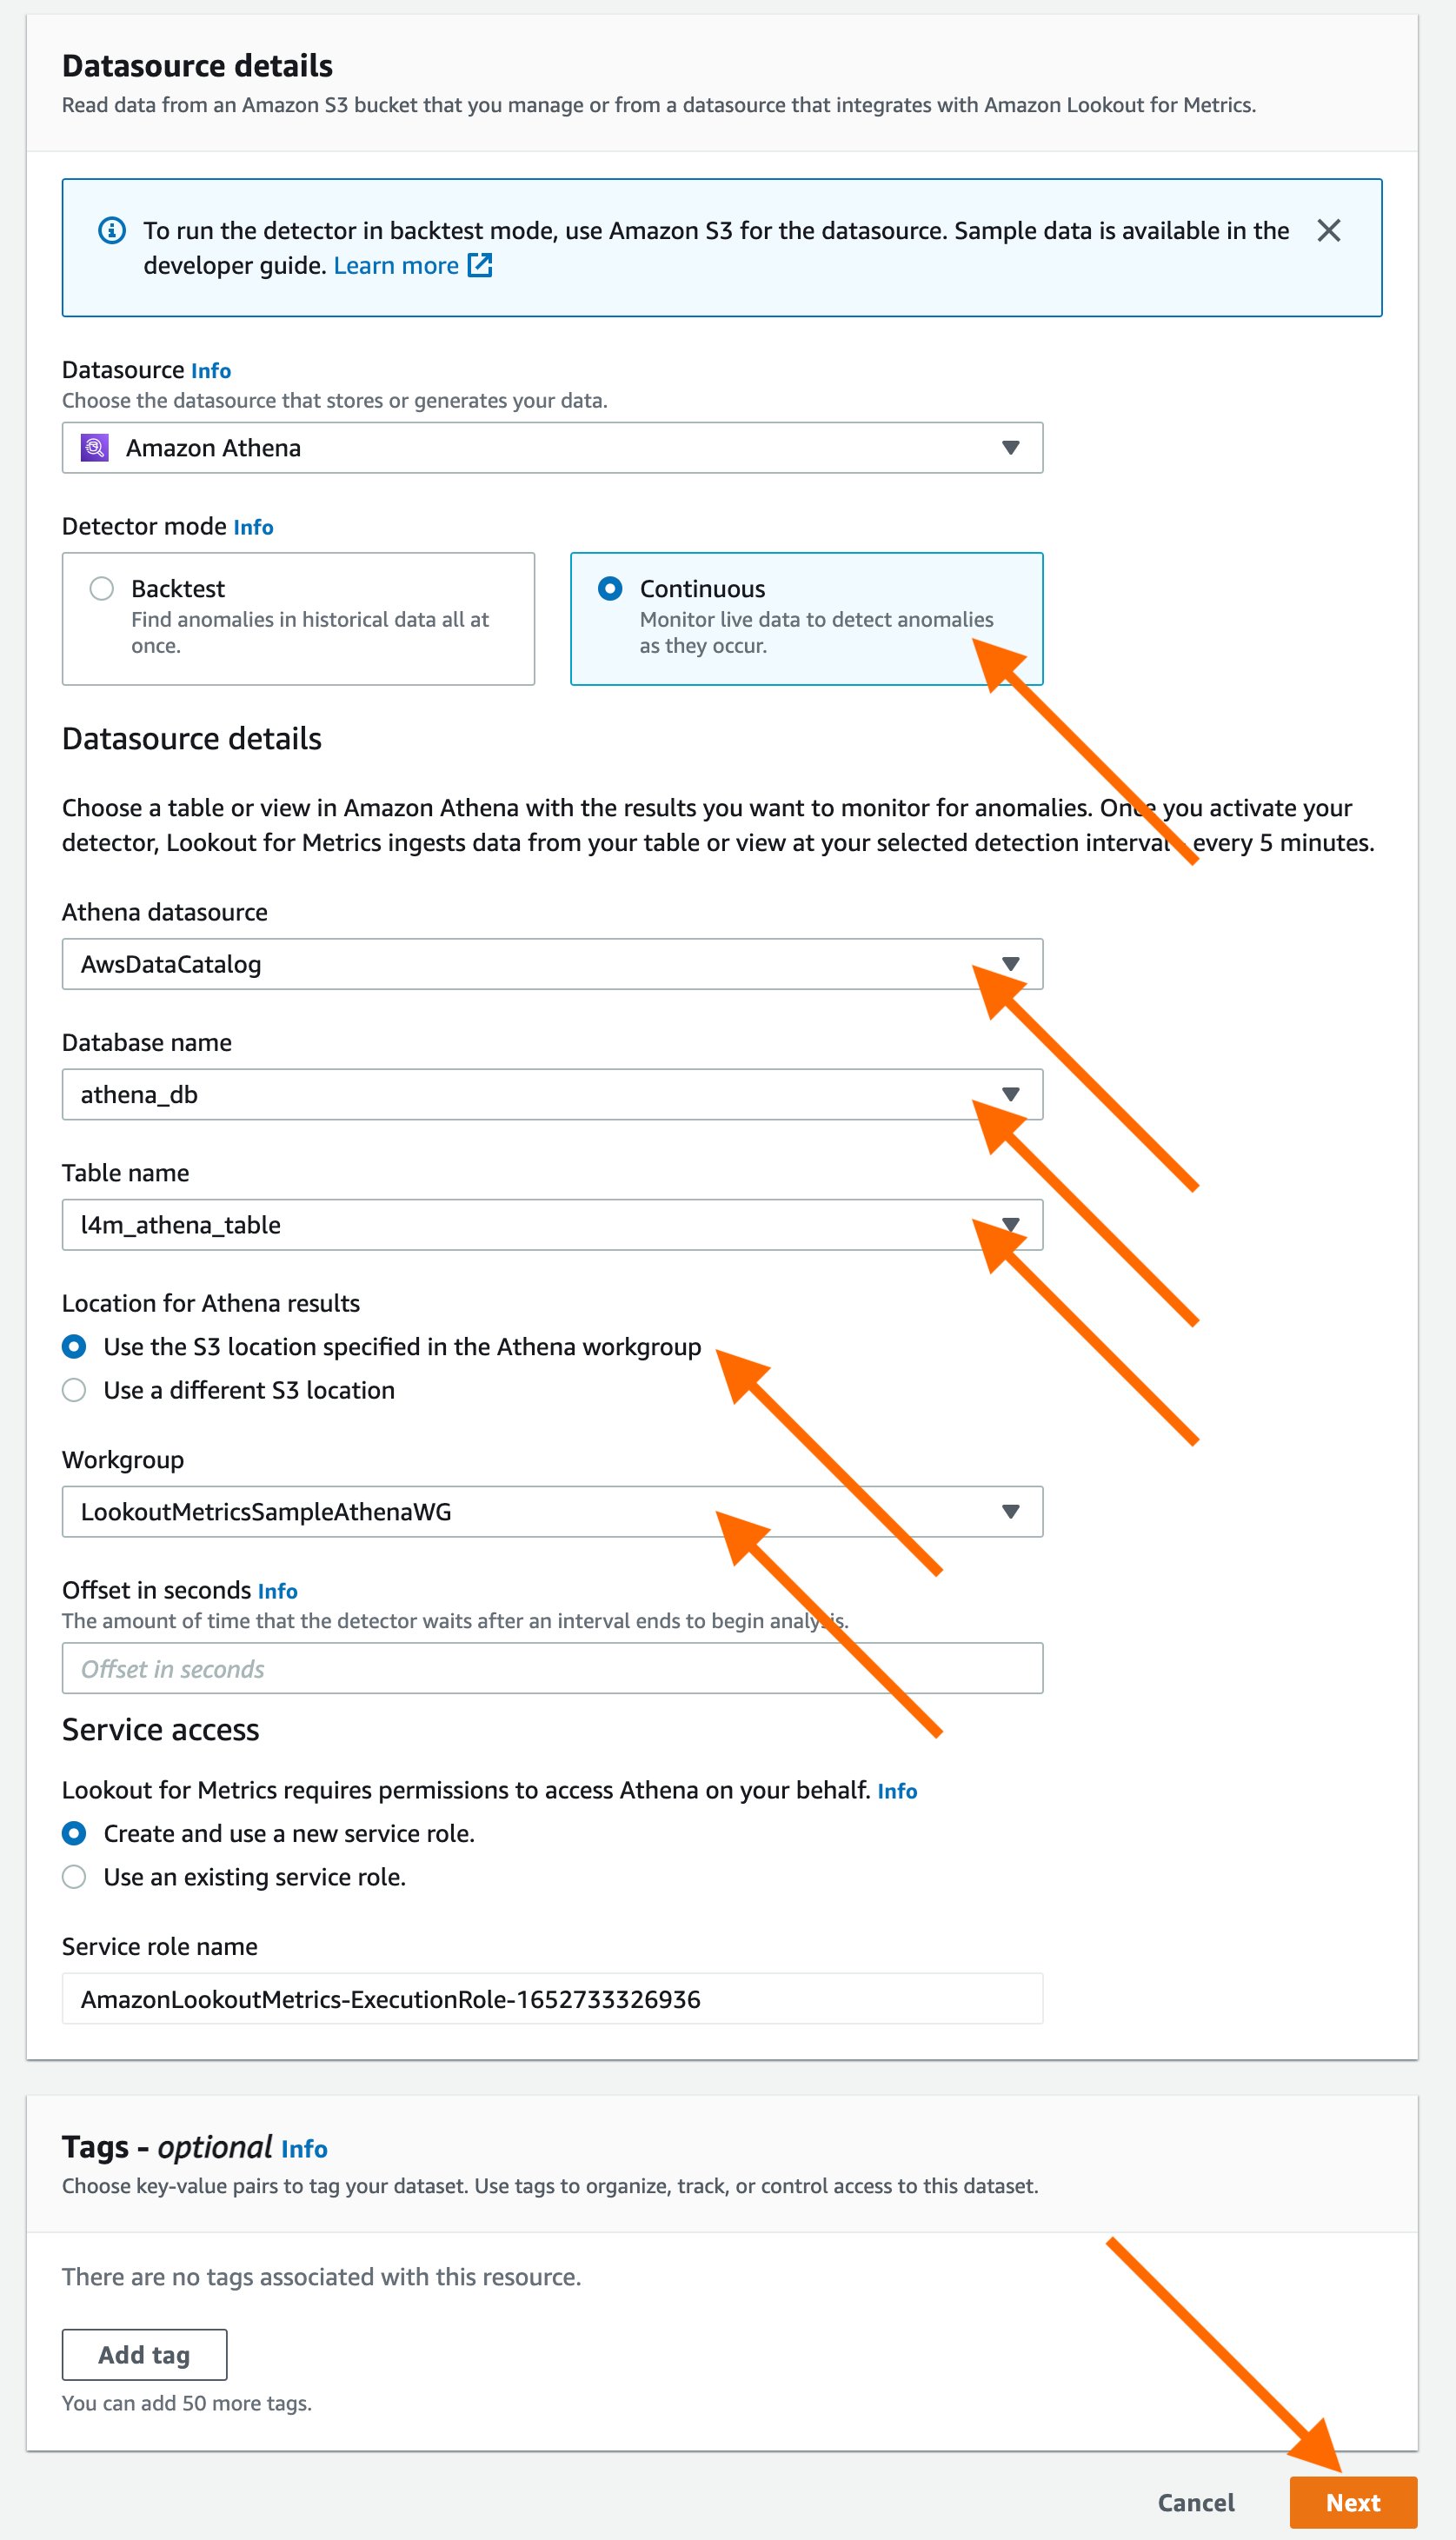
Once Athena is selected as the data source, you’ll have the option of selecting Backtest or Continuous mode for the detector. For this example, we’ll proceed by using the Continuous mode. Proceed by adding details for the Athena table that you want to monitor for anomalies.
You can allow the service to create a Service role or you could use an existing AWS Identity and Access Management (IAM) role in your account for federated queries. Note that Lookout for Metrics doesn’t support automated creation of IAM roles for federated queries. Therefore, you would have to create a new IAM role to allow Athena to perform the following actions on your data,
CreatePreparedStatementGetPreparedStatementGetQueryResultsStreamDeletePreparedStatementGetDatabaseGetQueryResultsGetWorkGroupGetTableMetadataStartQueryExecutionGetQueryExecution
The IAM role created by the service looks like the following:
Step 4
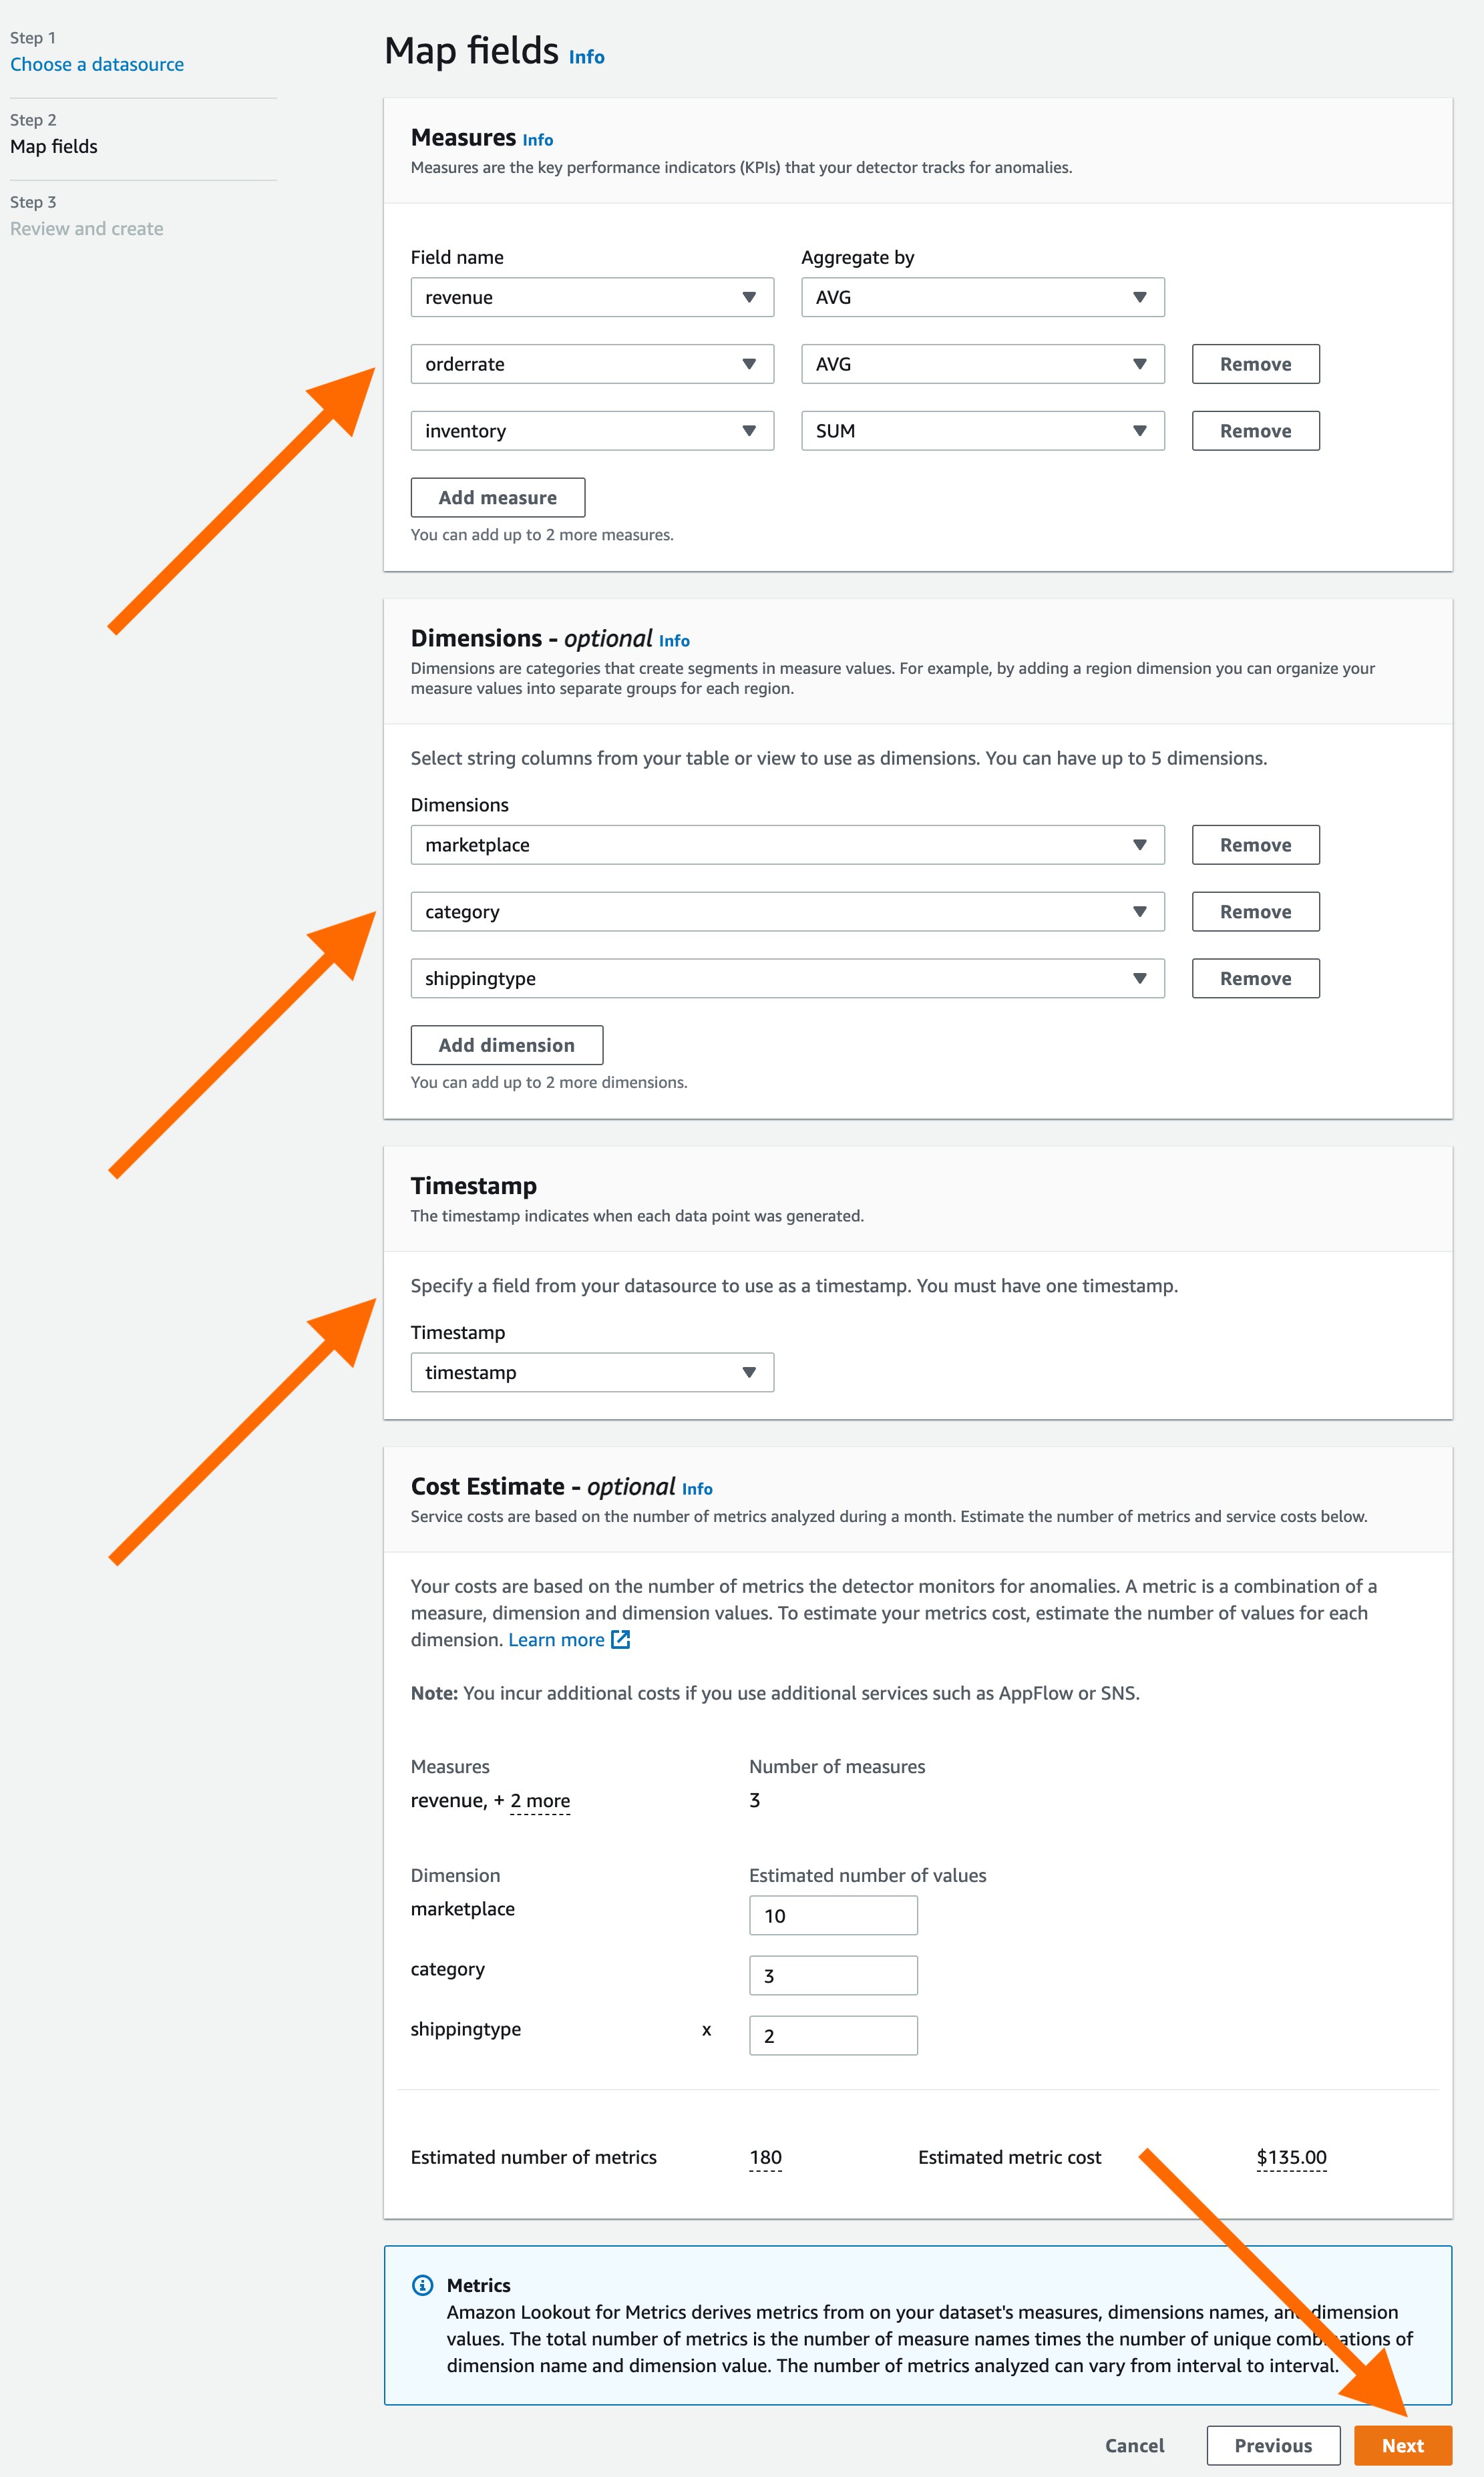
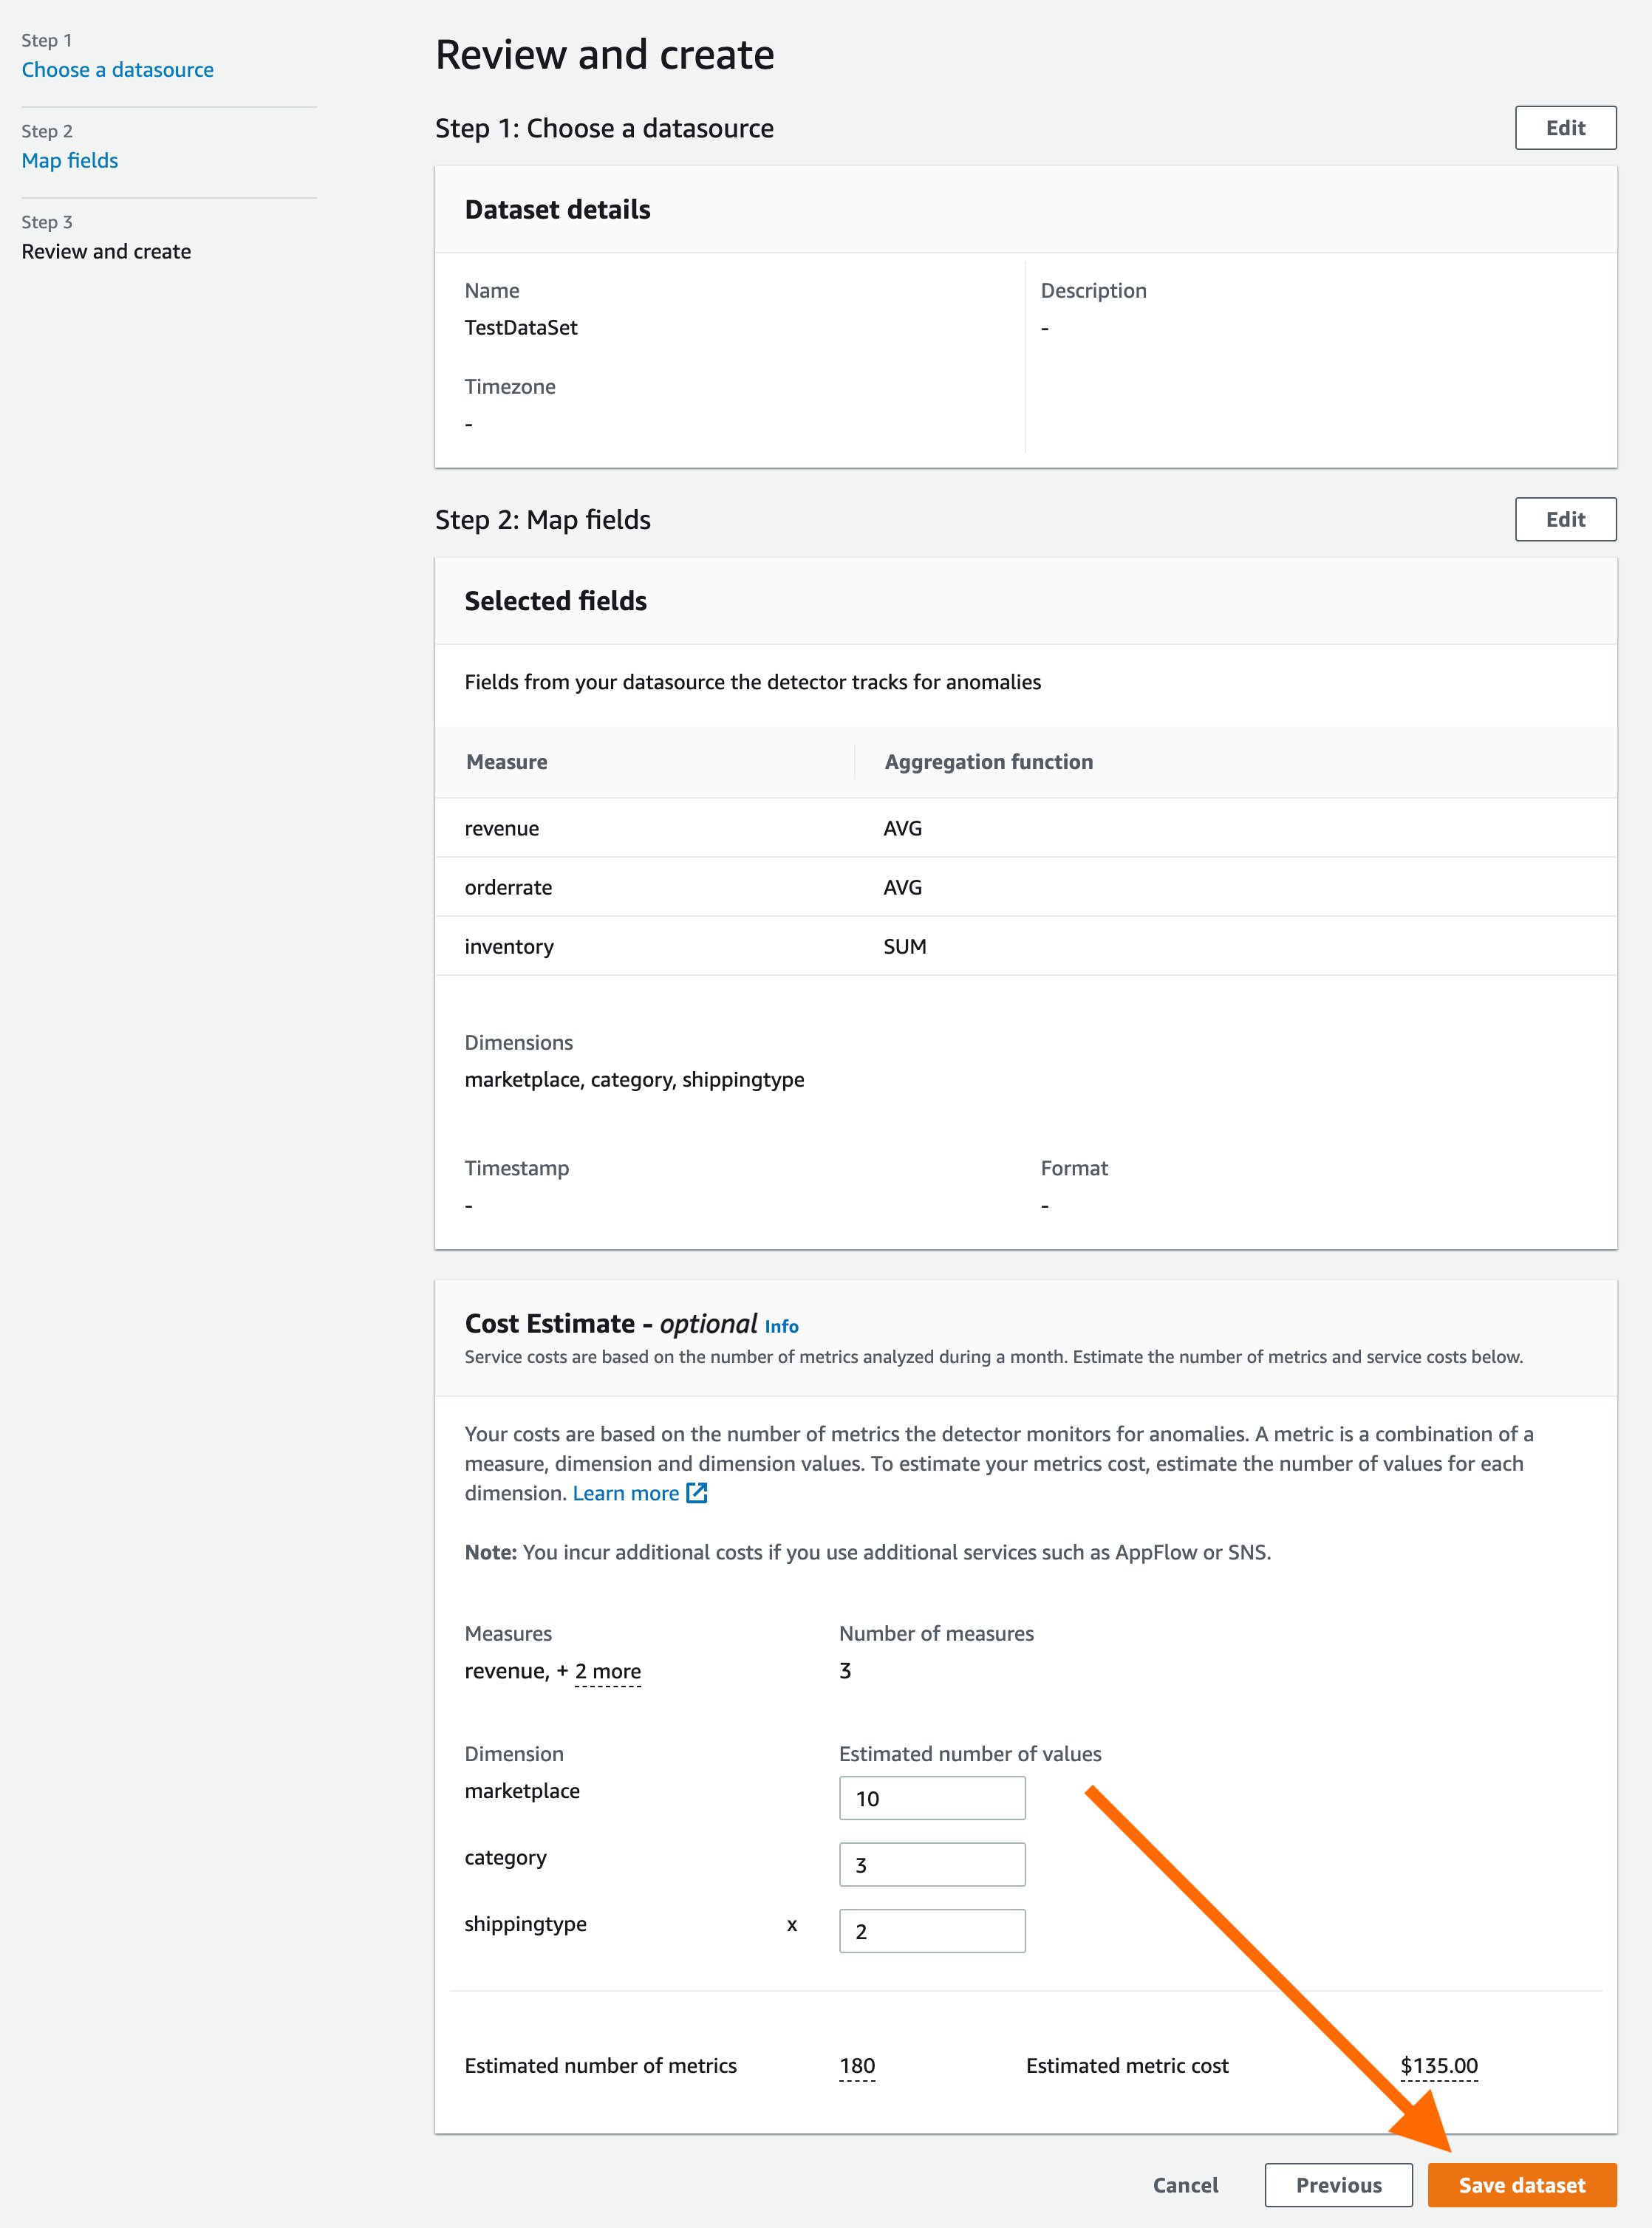
Now we’ll define relevant metrics for the detector. Lookout for Metrics will populate the drop-downs with the columns present in the supplied Athena table. You can select up to five metrics and five dimensions. Lookout for Metrics requires the data in your table to be partitioned as timestamps for the timestamp column. You will also have an option to estimate the cost for this detector by adding the number of values across your dimensions.
Once you have selected all of the metrics, proceed by selecting the “Next” button. Review the details and select the “Save dataset” button to save the dataset.
Step 5
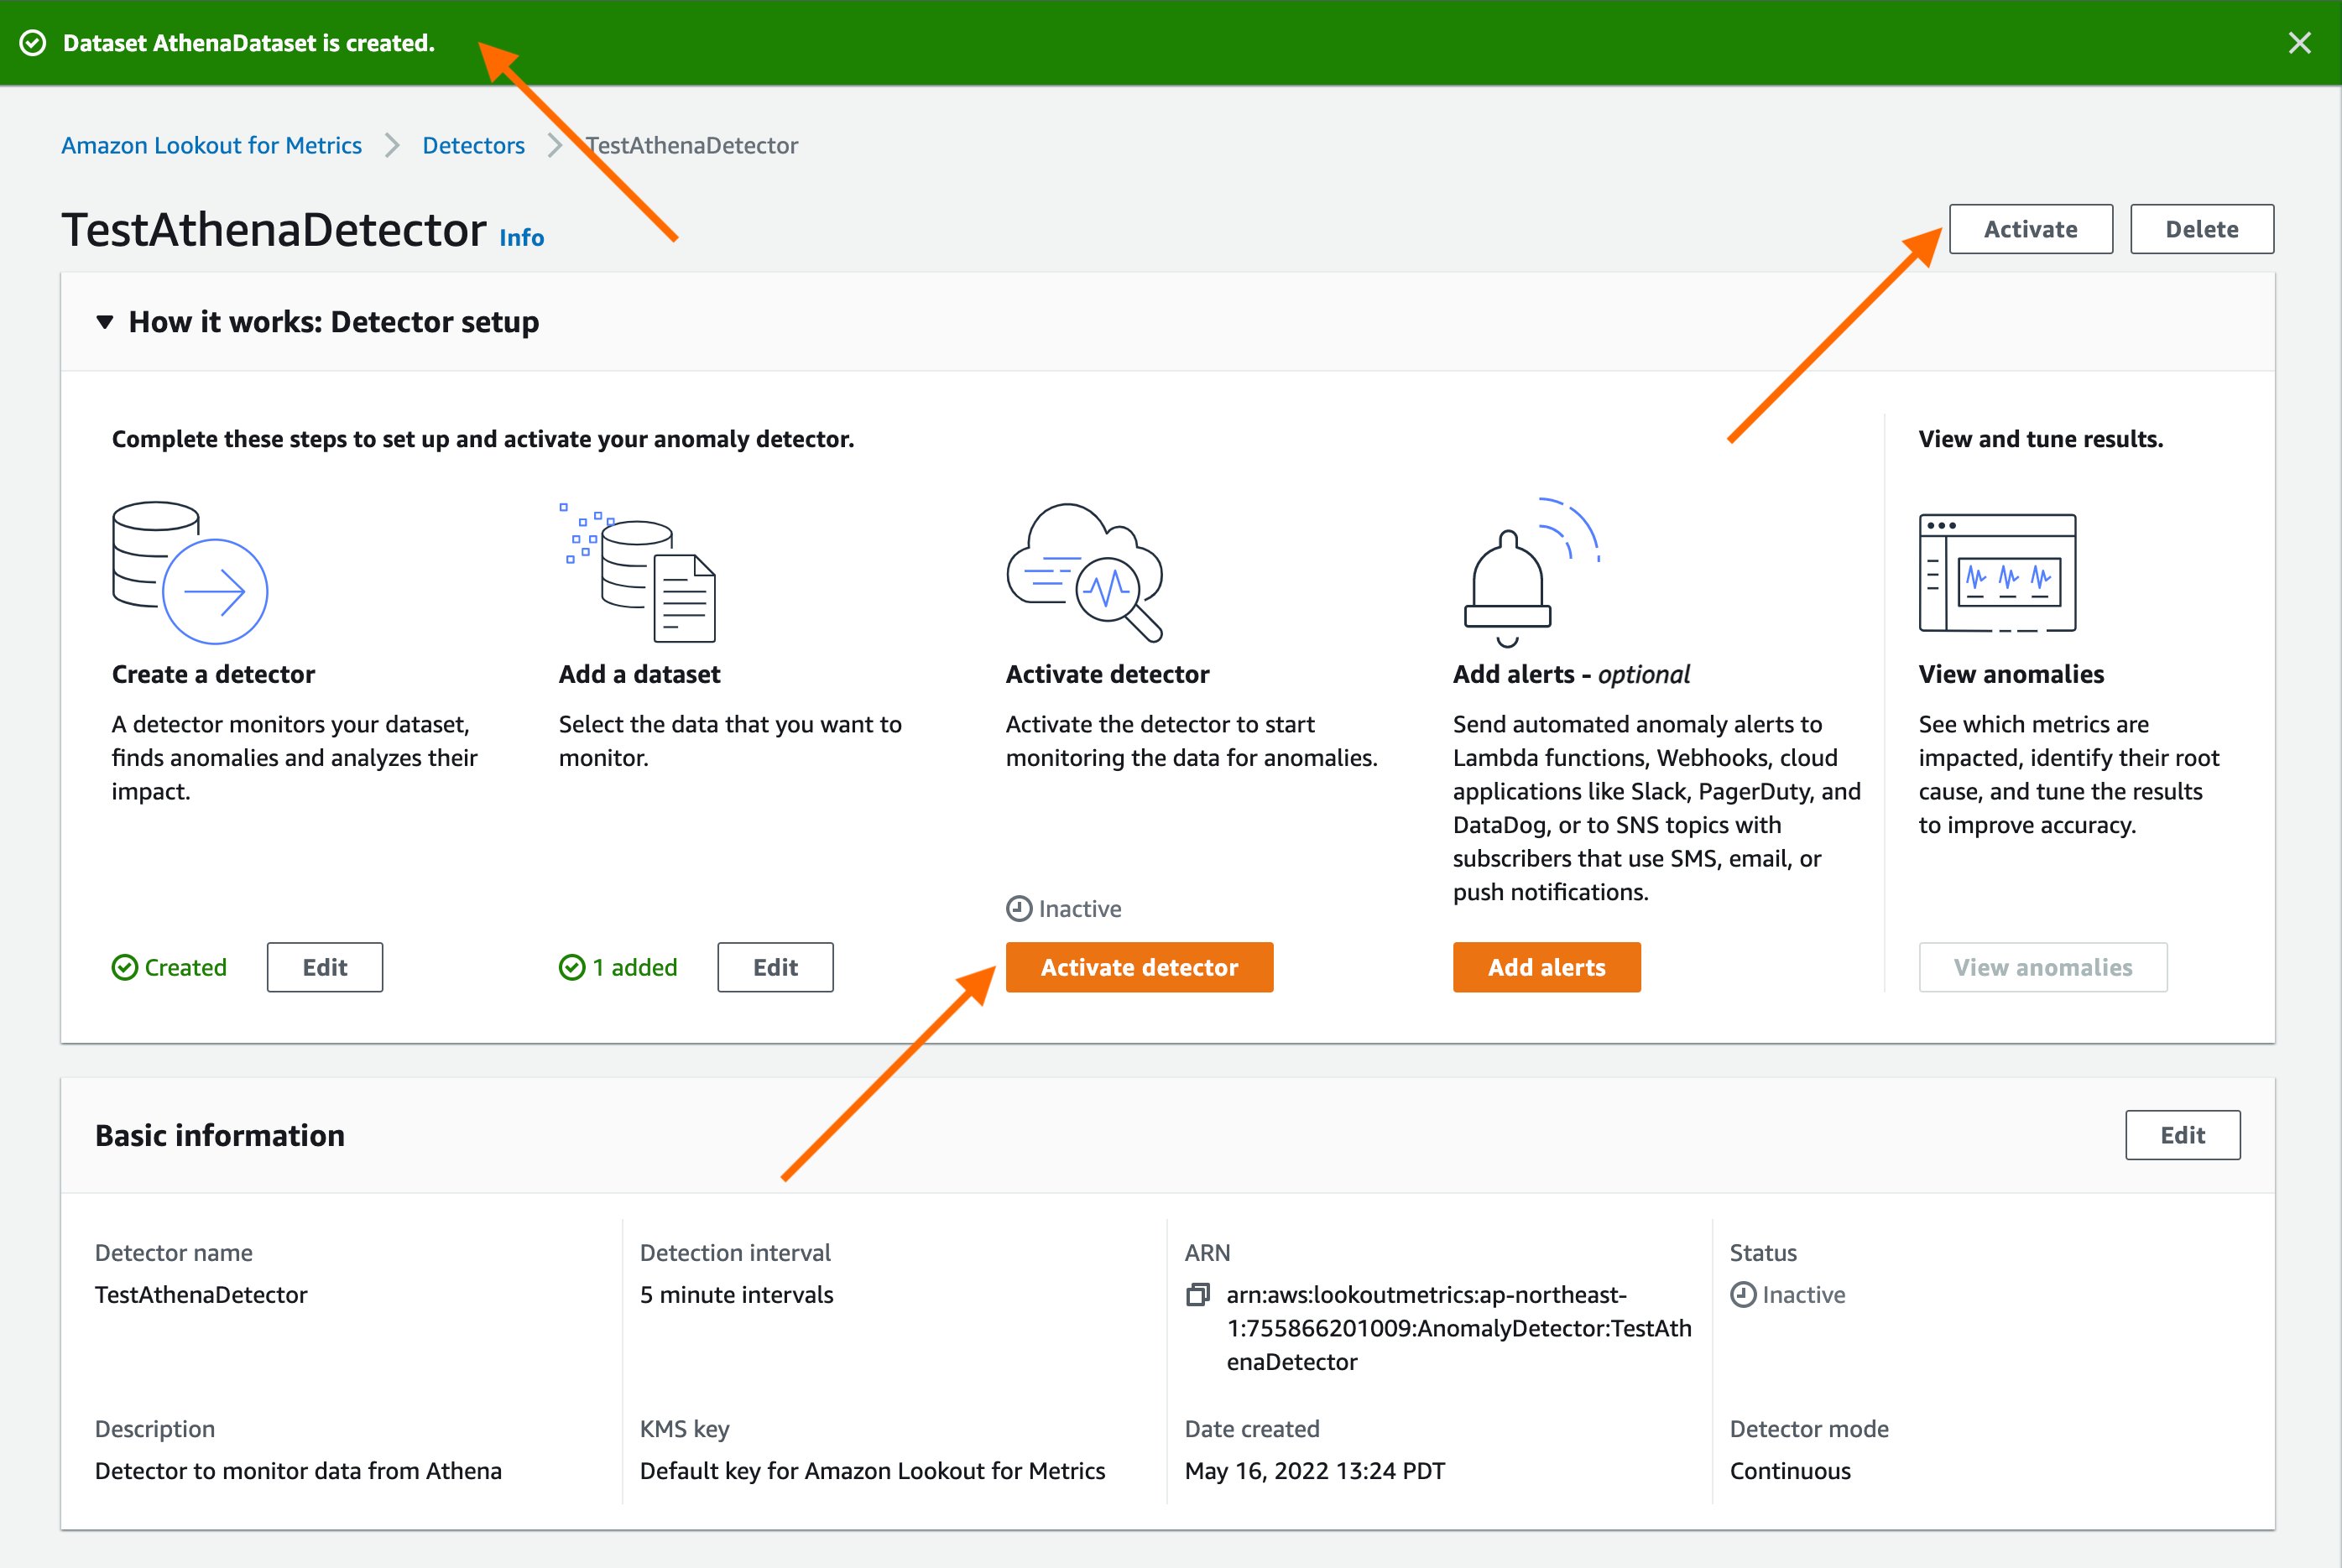
Once the dataset is created, we’ll activate the detector by either selecting the “Activate” button at the top or the “Activate Detector” button under the “How it works” section.
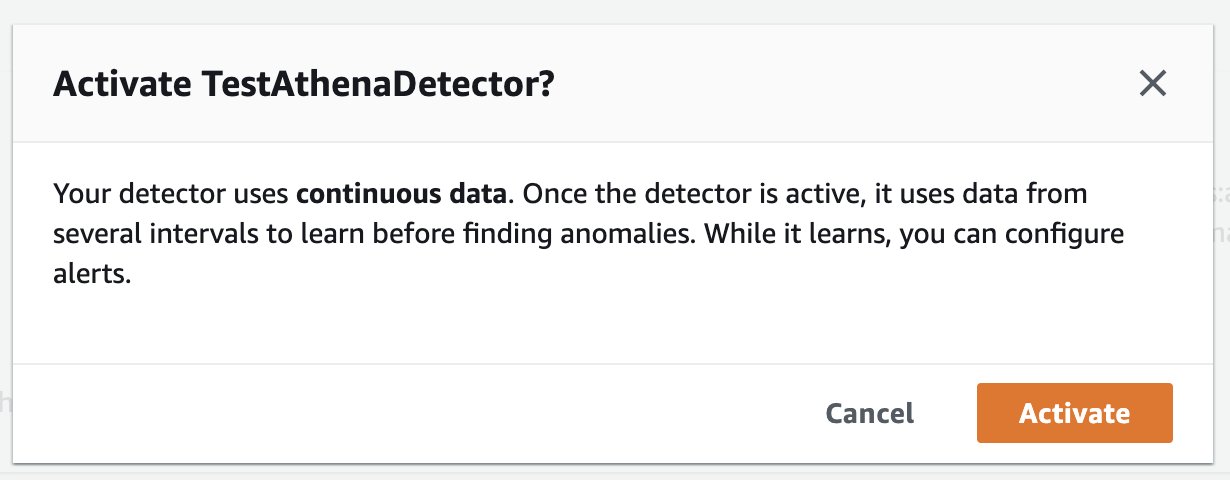
You’ll be prompted to confirm if you want to activate the detector for continuous detection. Select “Activate” to confirm.
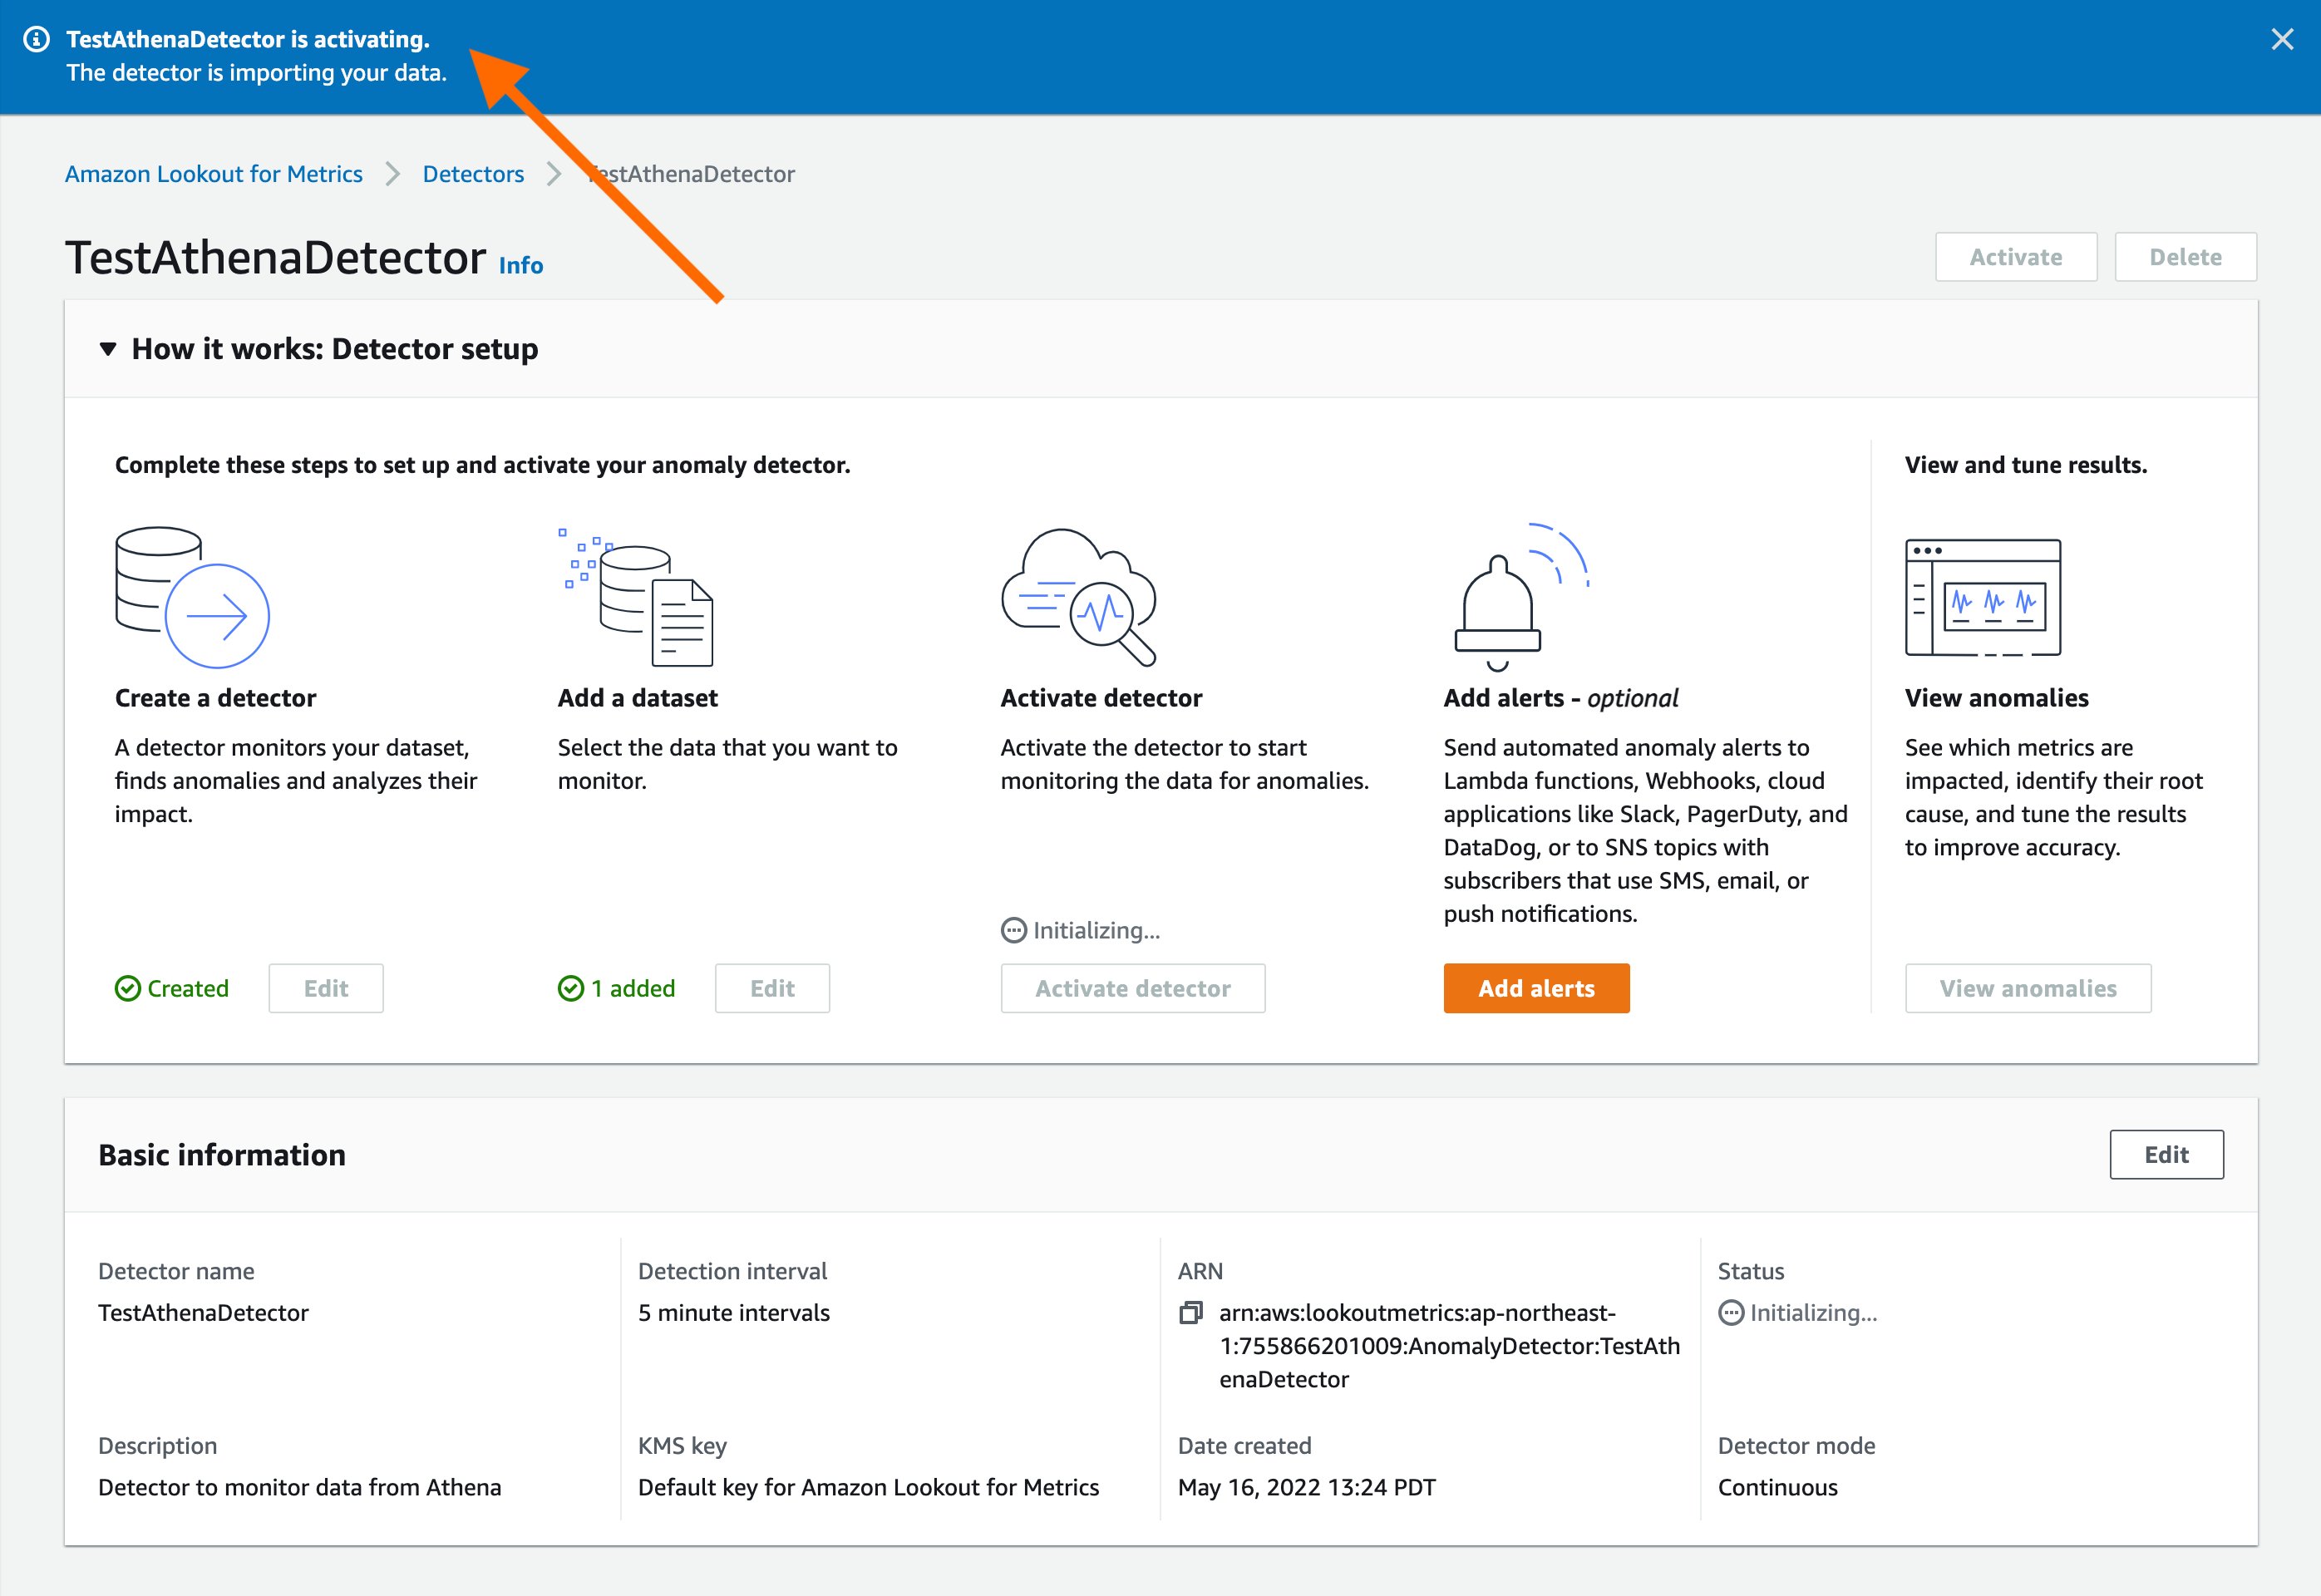
You’ll see a confirmation informing that the detector is activating.
Step 6
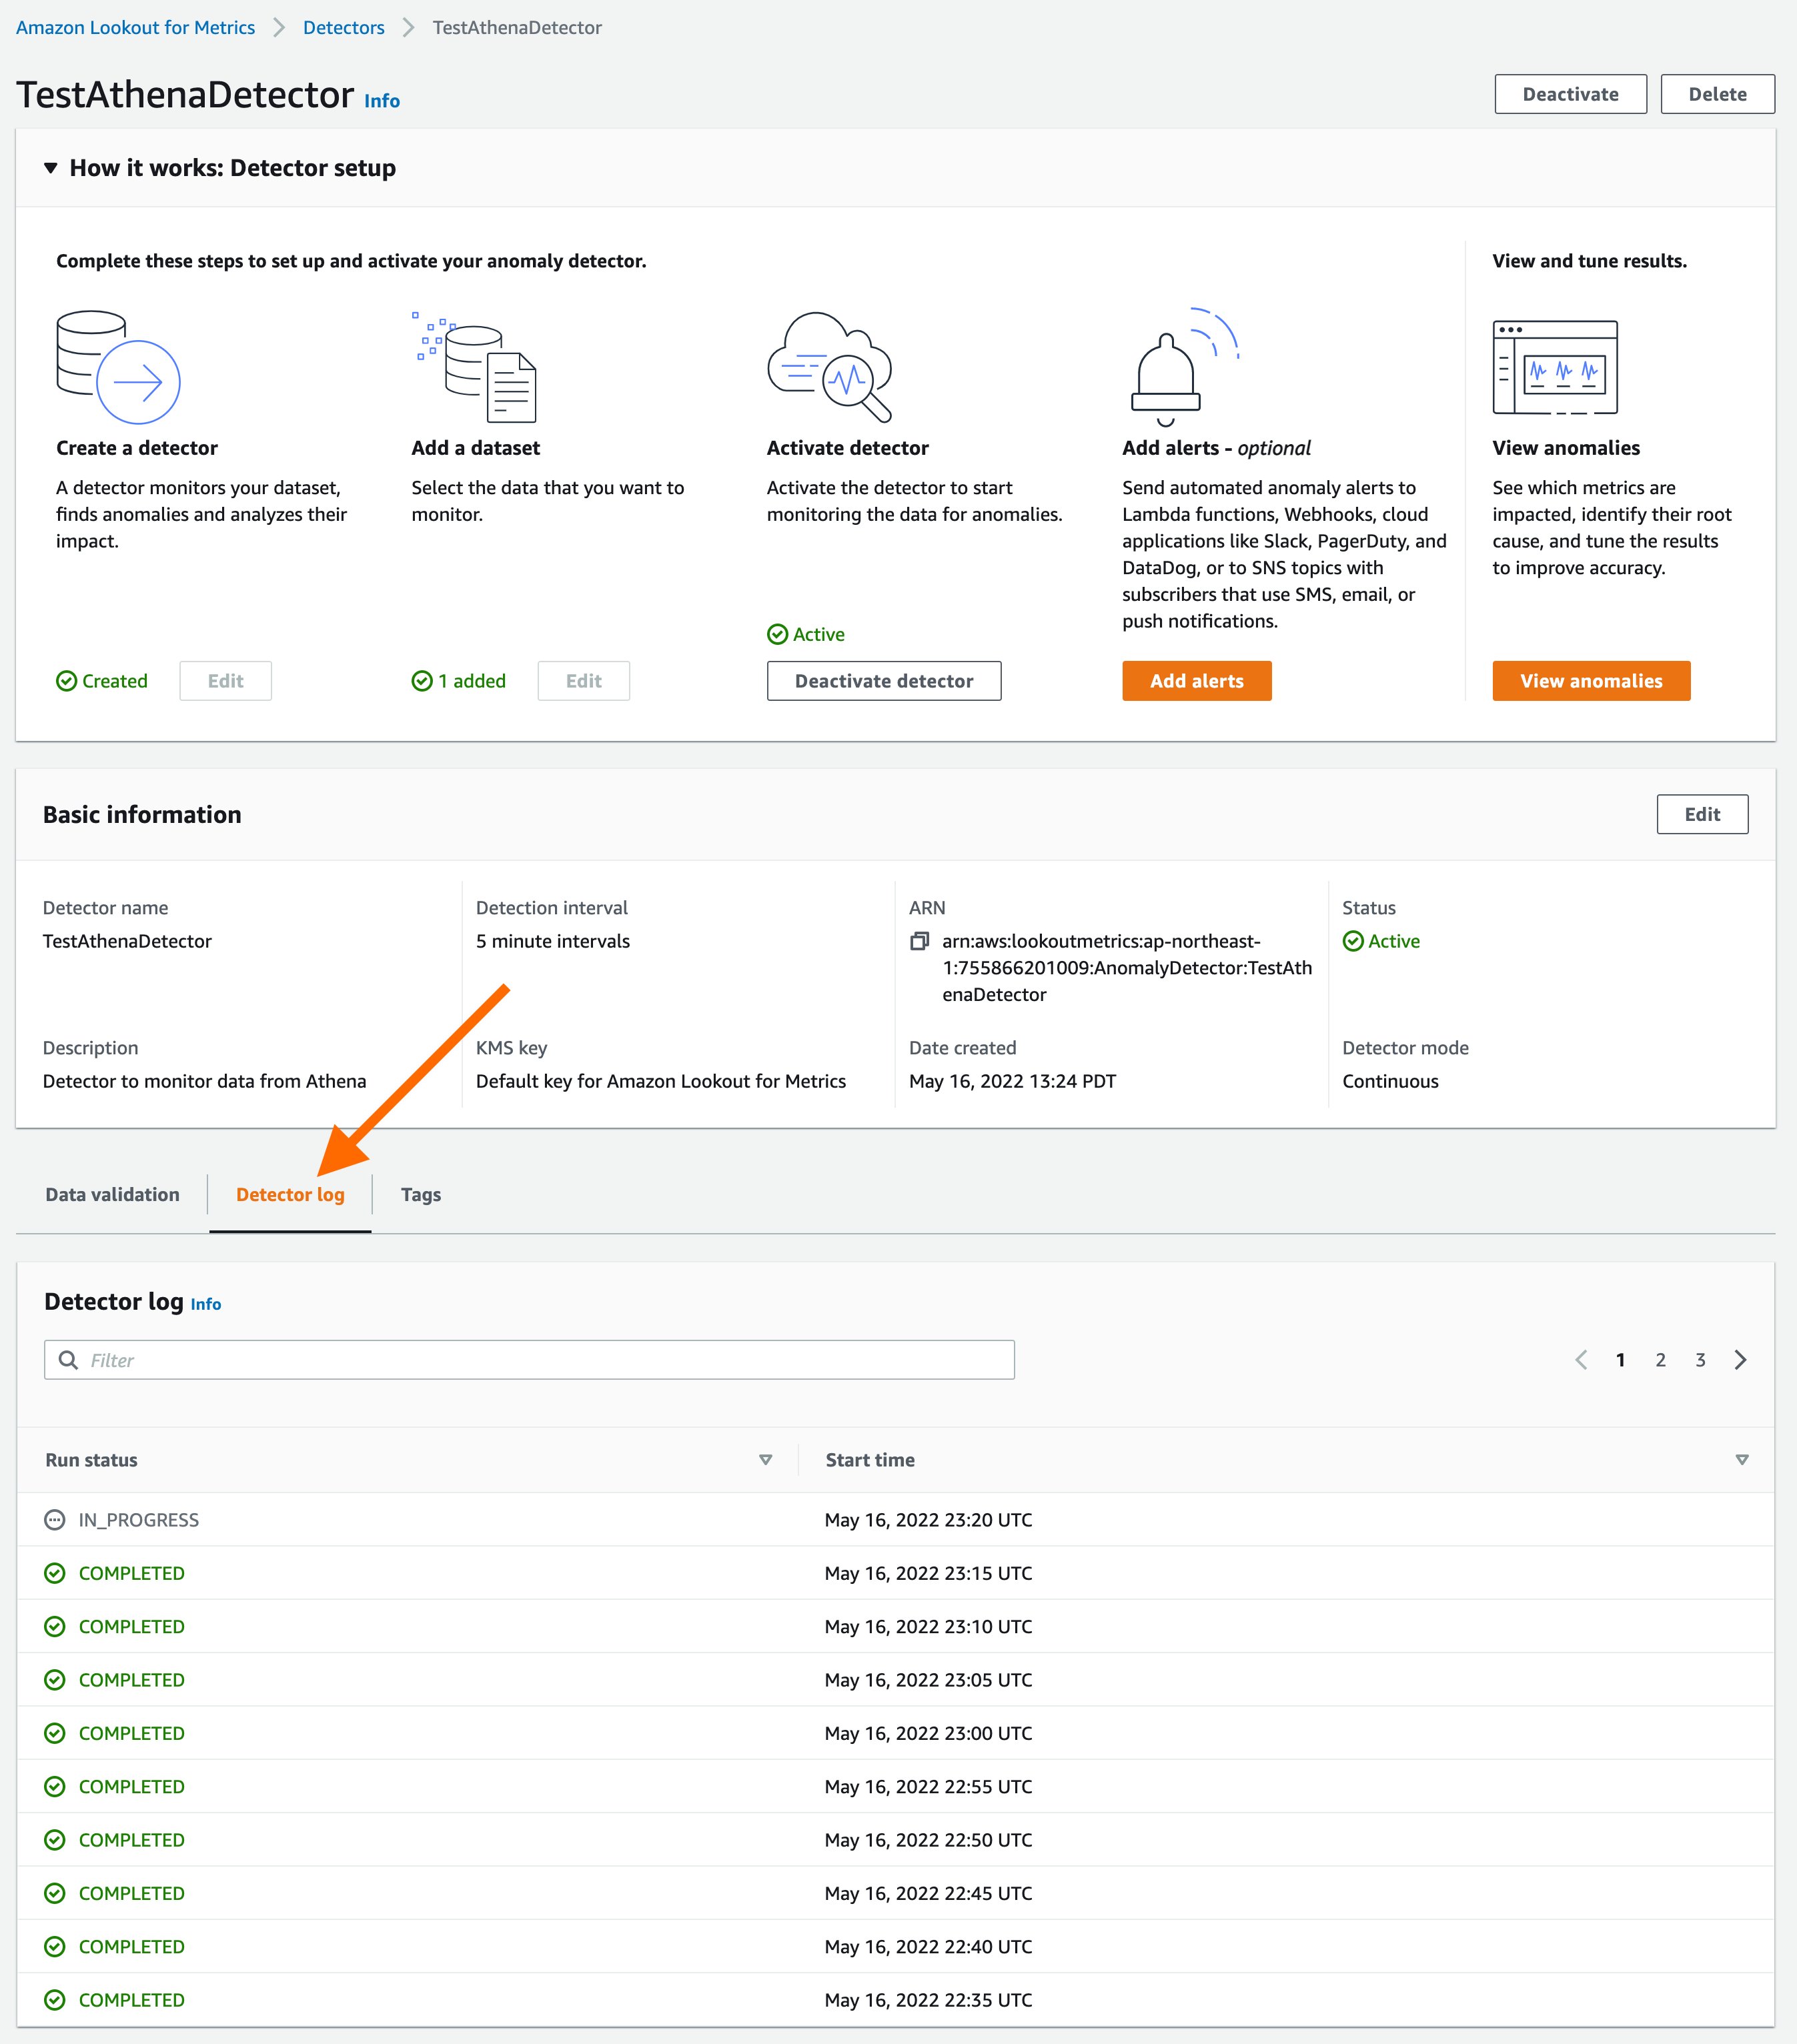
Once the Anomaly Detector is Active, you can use the “Detector log” tab on the Detector details page to review detection executions that have been performed by the service.
Step 7
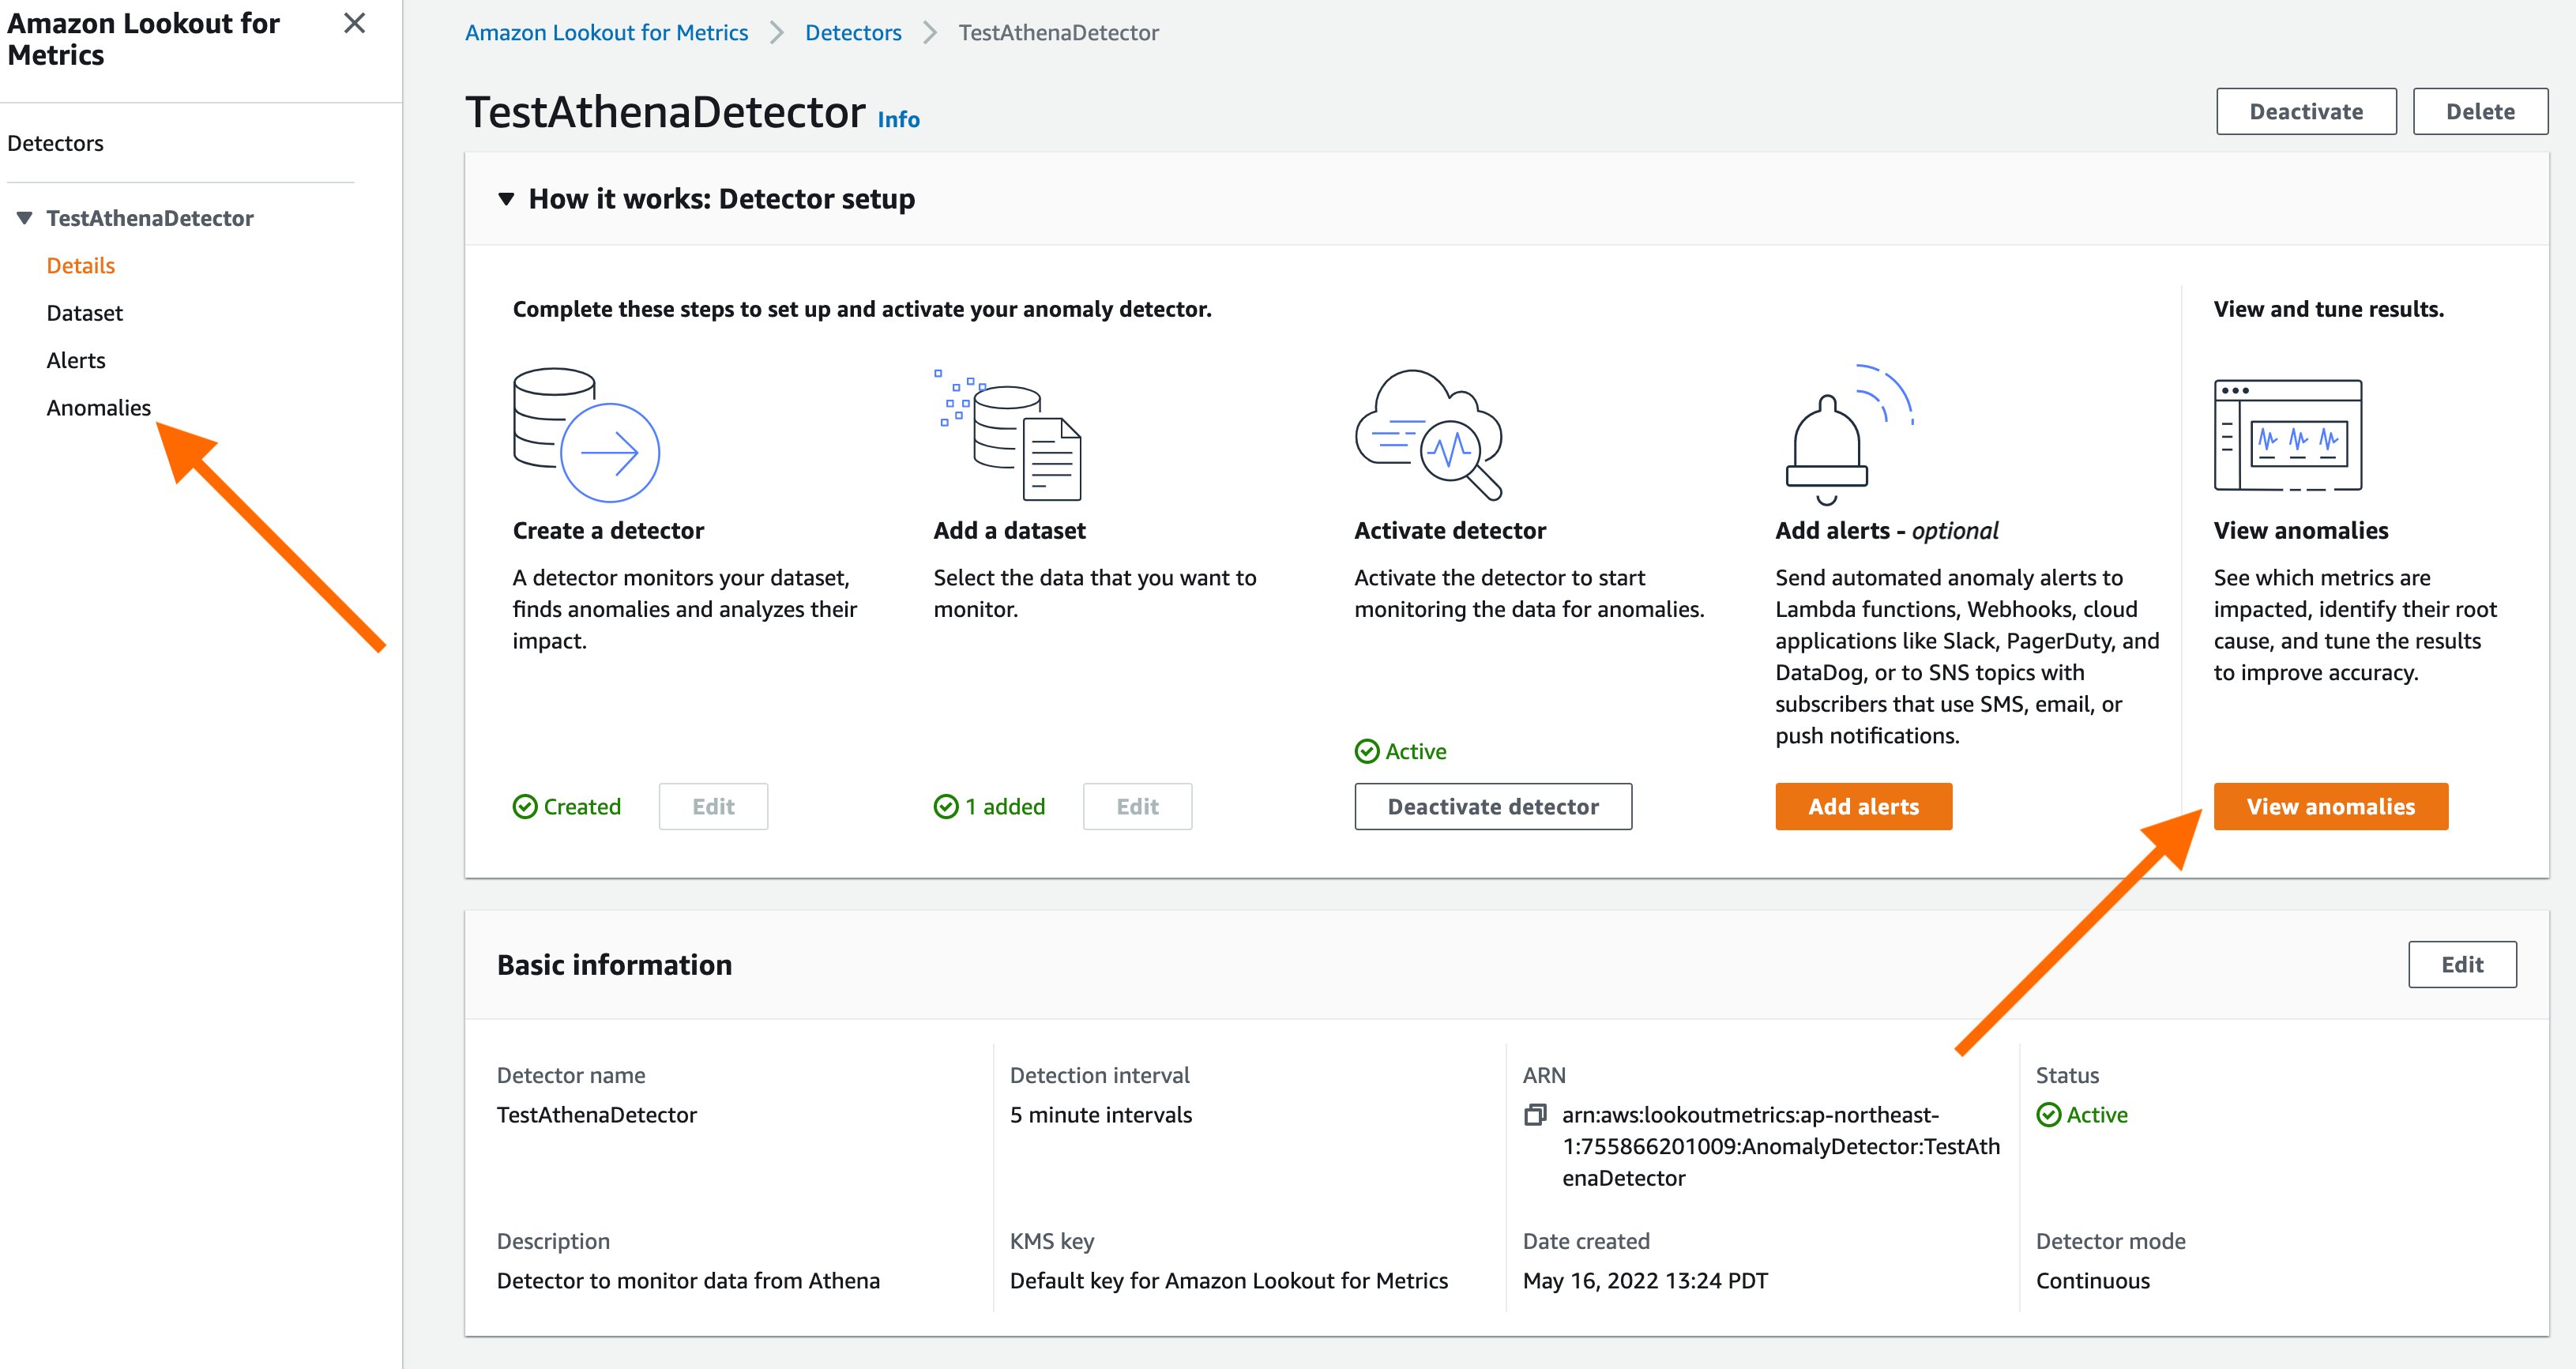
You can select the “View anomalies” button from the detector details page to manually inspect anomalies that may have been detected by the service.
Step 8
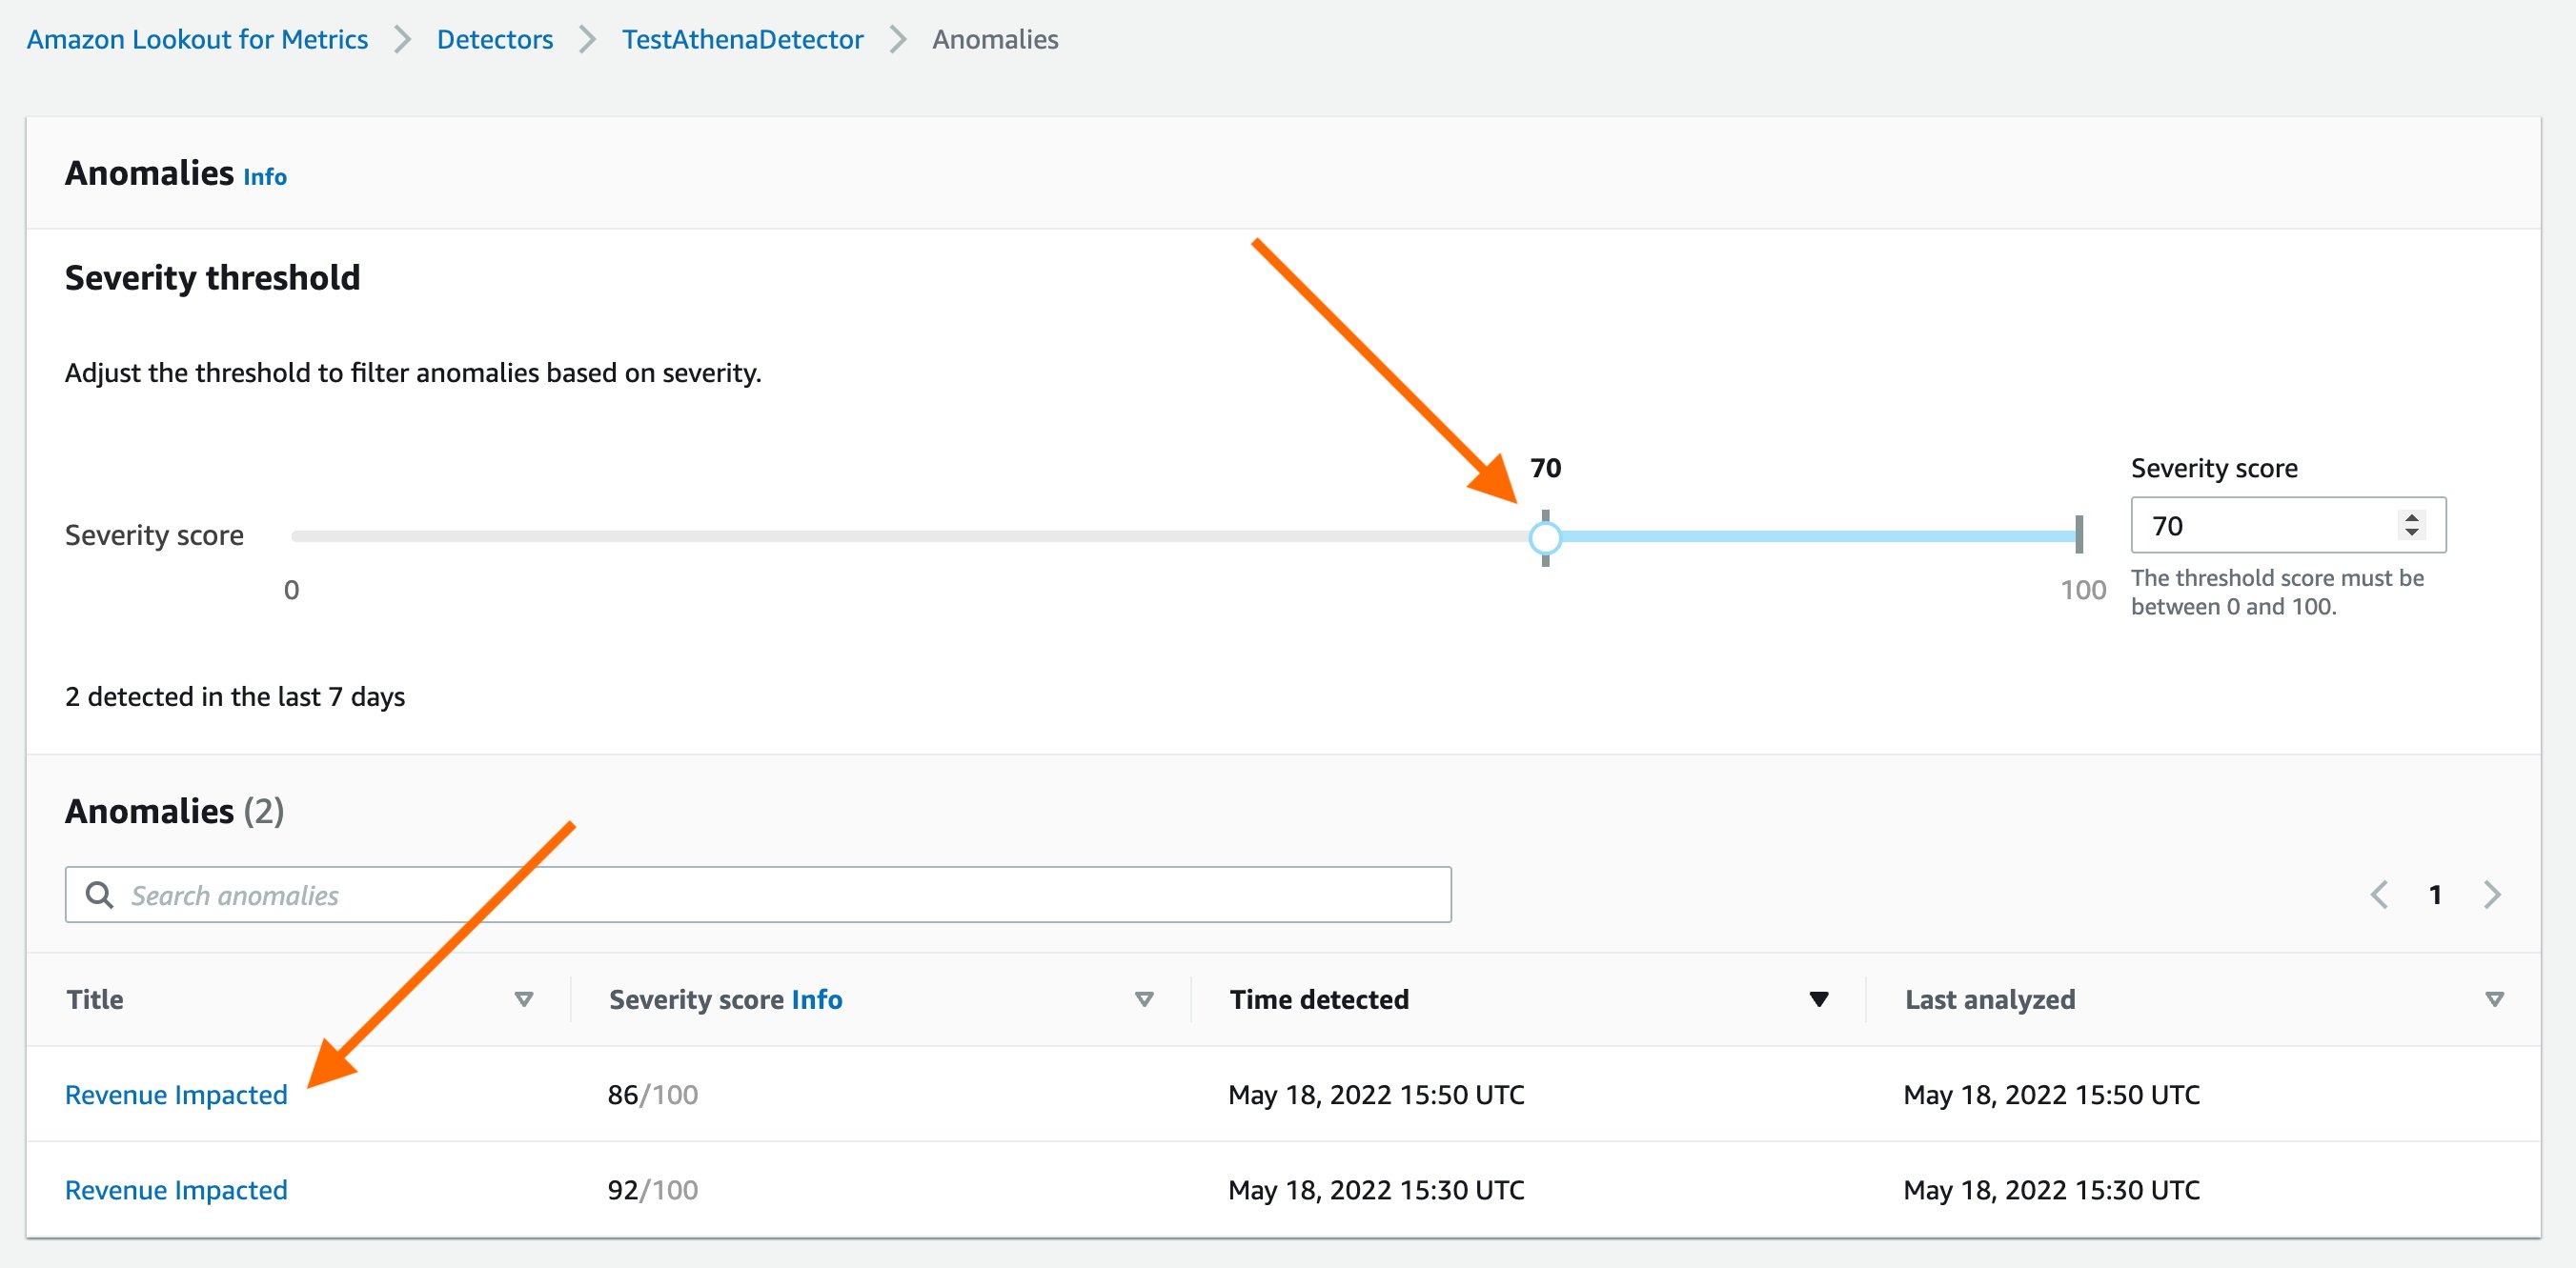
On the Anomalies review page, you can adjust the severity score threshold on the threshold dial to filter anomalies above a selected score.
Review and analyze the results
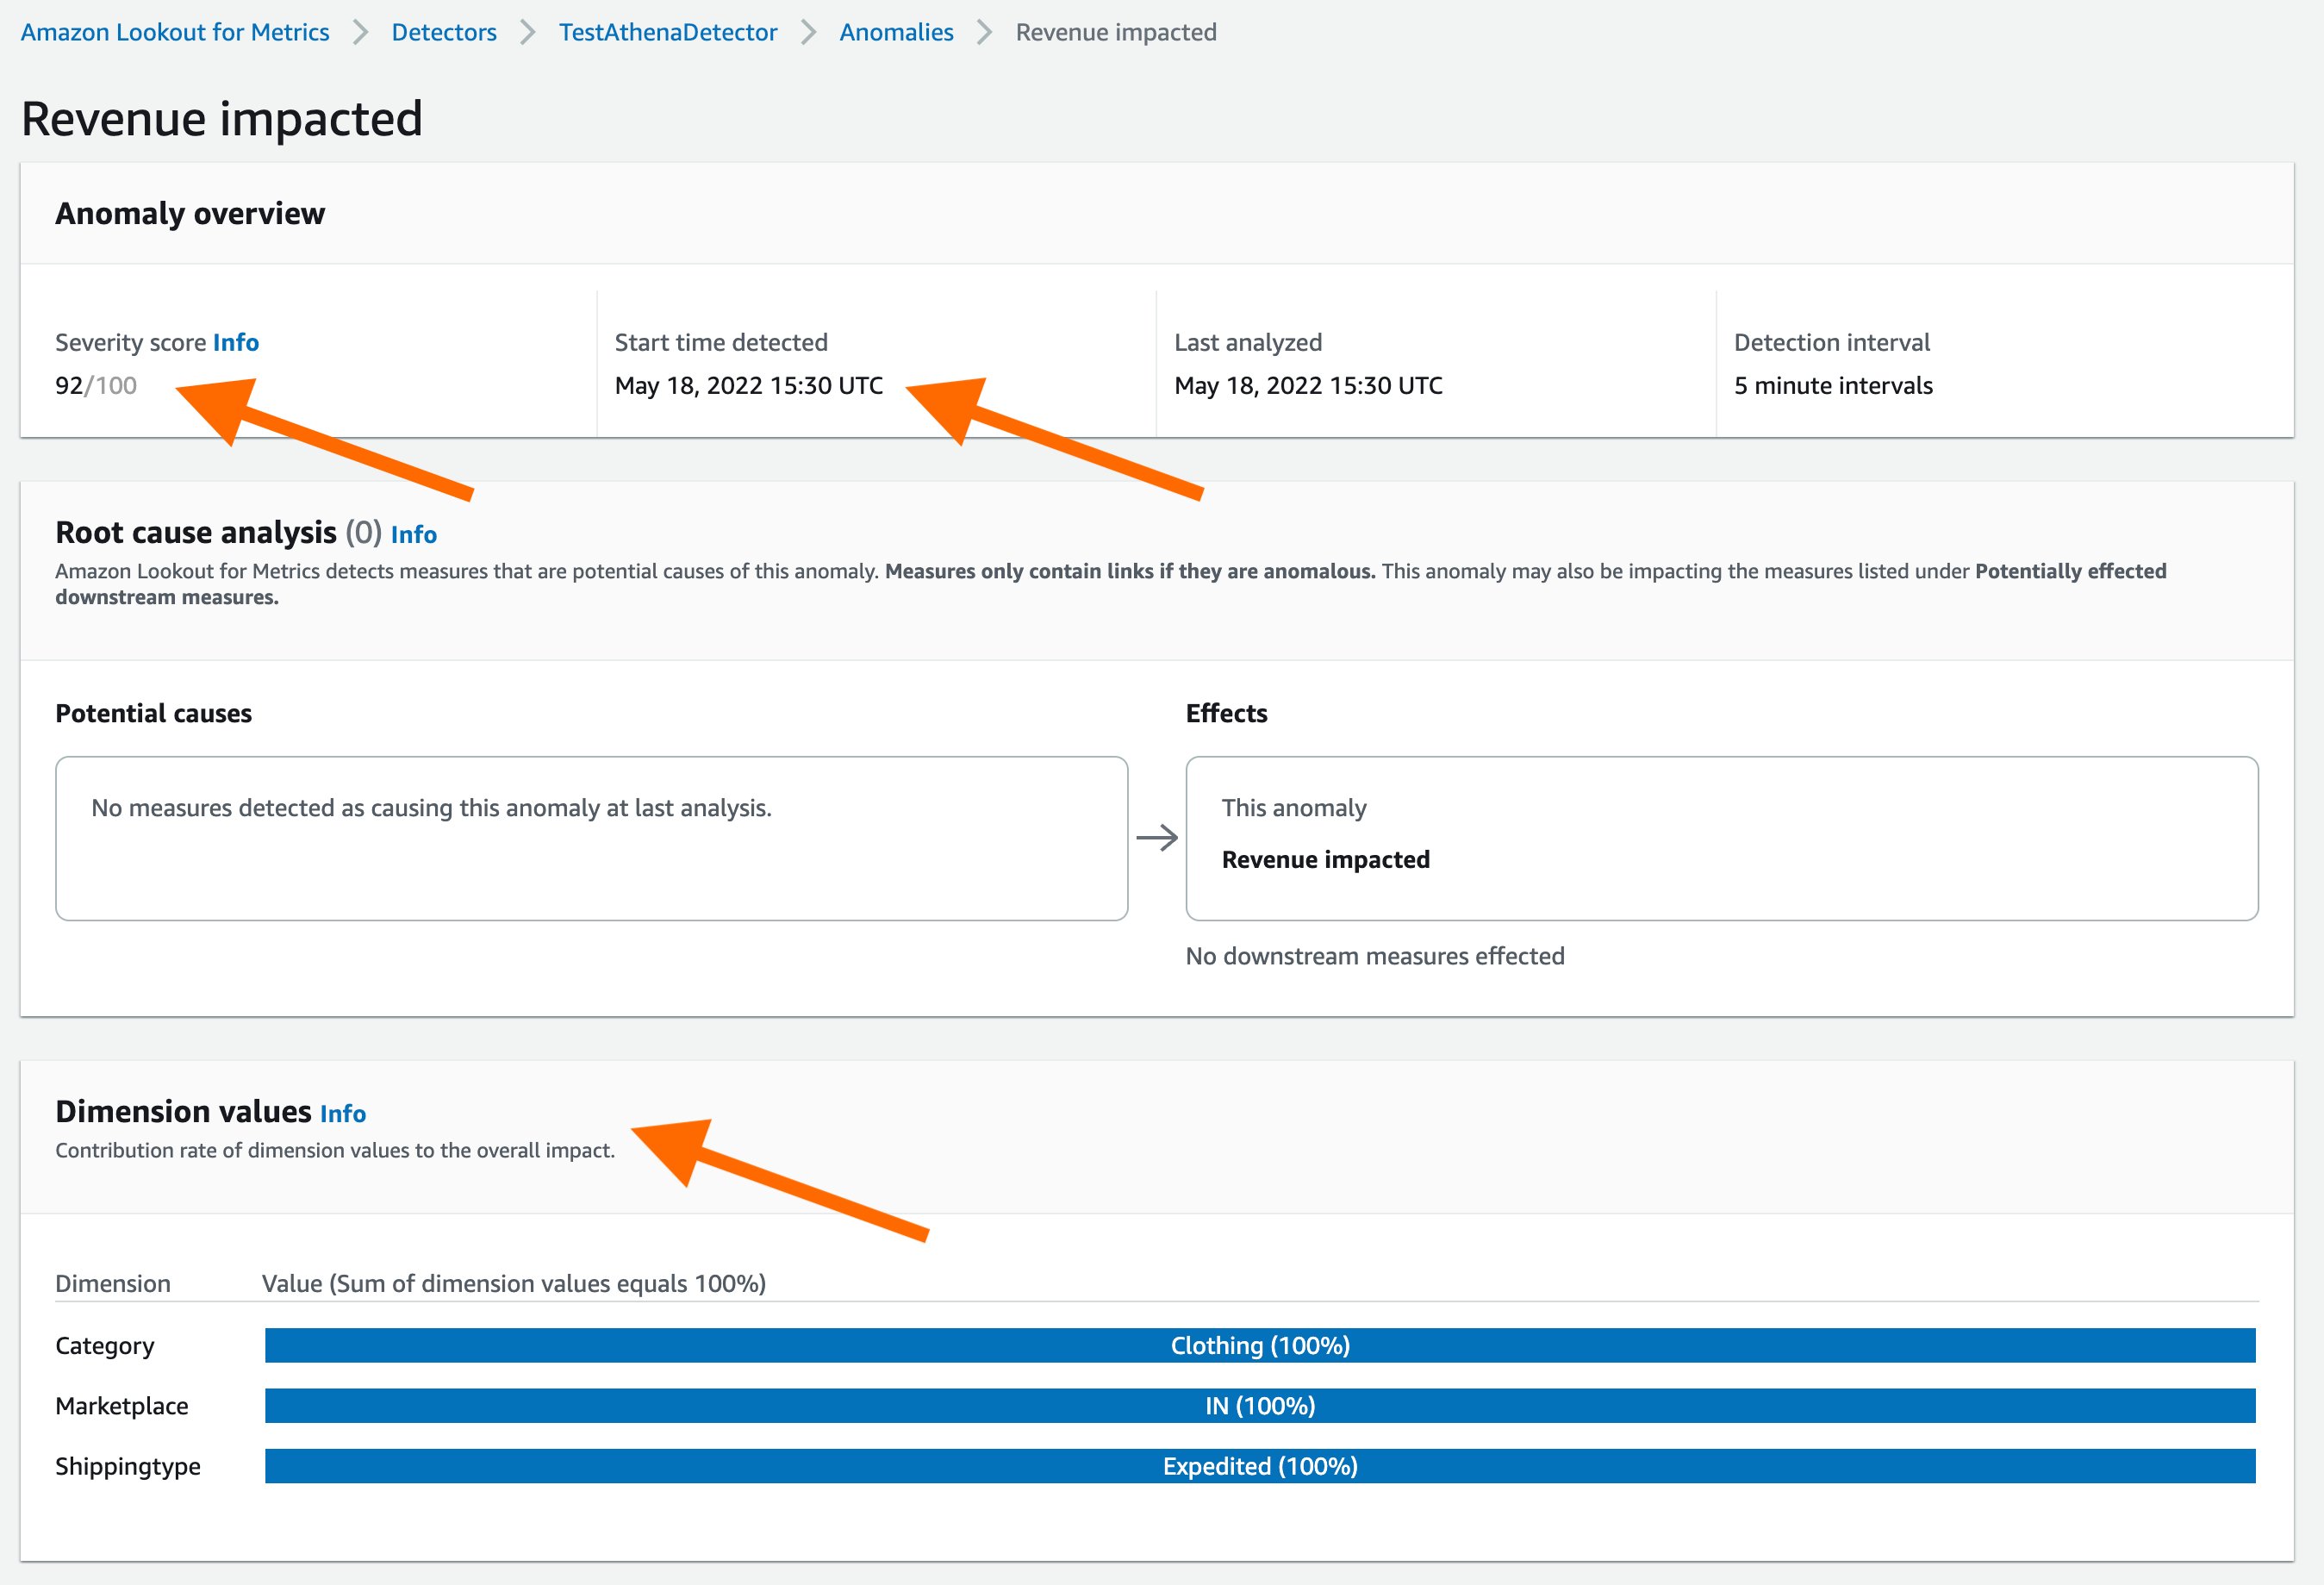
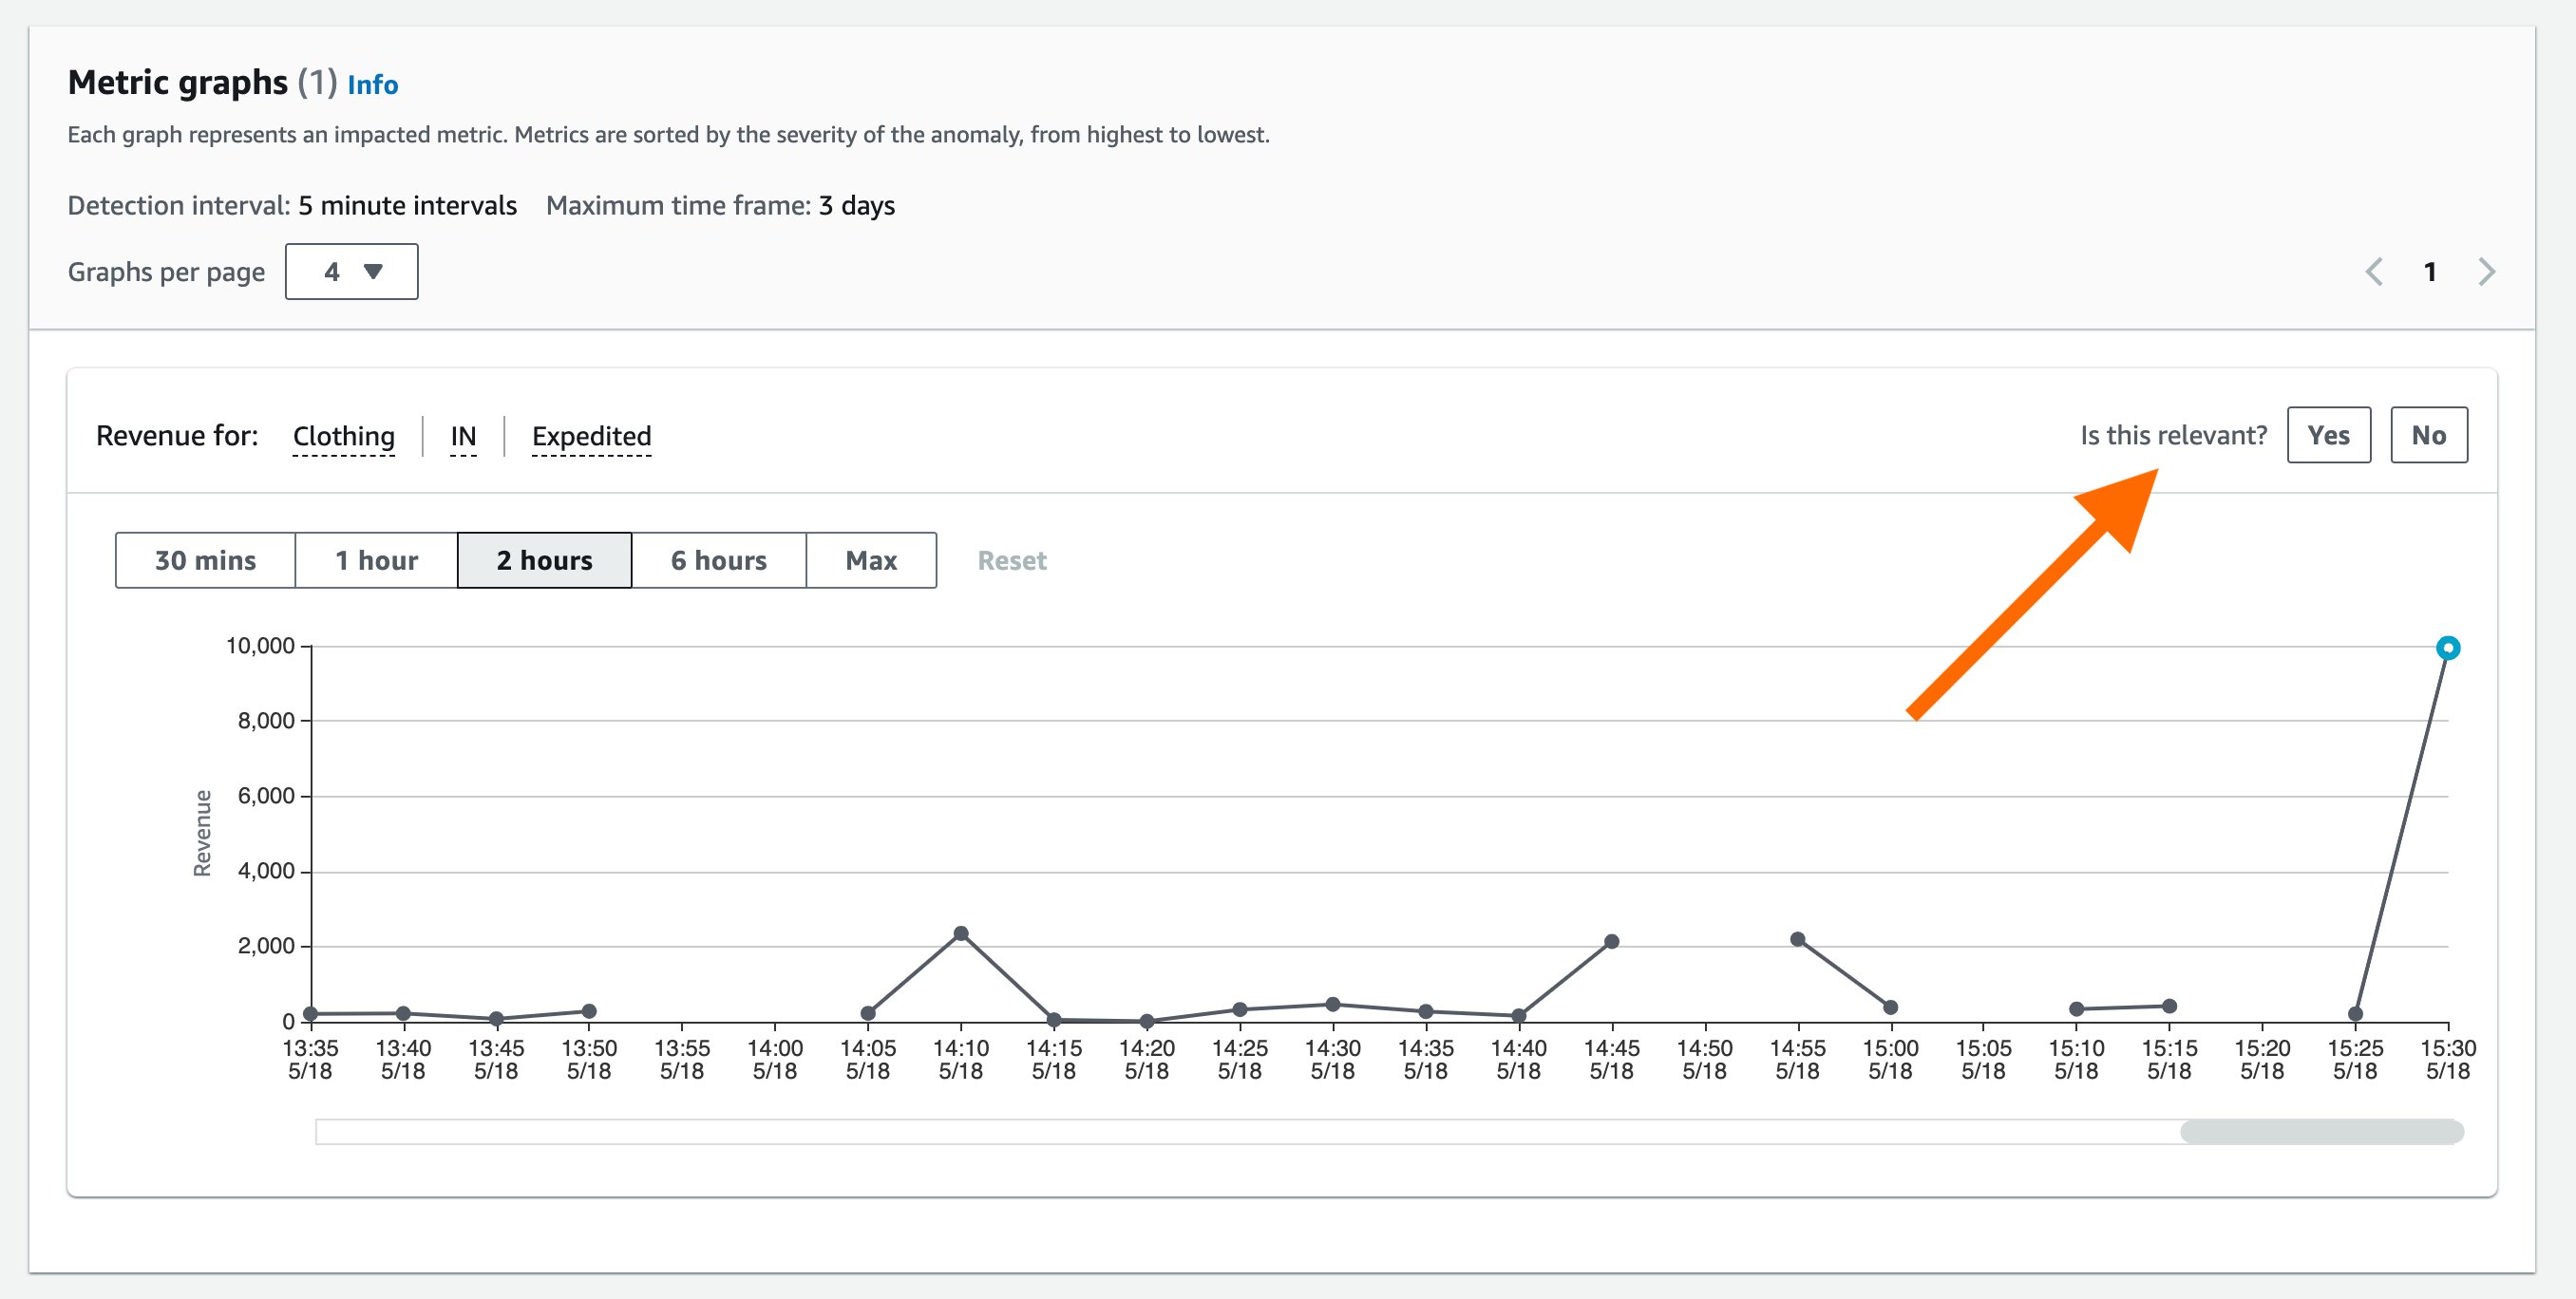
When detecting an anomaly, Lookout for Metrics helps you focus on what matters most by assigning a severity score to aid prioritization. To help you find the root cause, it intelligently groups anomalies that may be related to the same incident, and then summarizes the different sources of impact.
Lookout for Metrics also lets you provide real-time feedback on the relevance of detected anomalies, thereby enabling a powerful human-in-the-loop mechanism. This information is fed back to the anomaly detection model to improve its accuracy in near-real time.
Clean up
To avoid incurring additional charges for the resource set up for the demo, you can delete the created detector under Lookout for Metrics and the stack created via CloudFormation.
Conclusion
You can seamlessly connect to your data in Athena to Lookout for Metrics to set up highly accurate anomaly detector across metrics and dimensions within your Athena tables. To get started with this capability, see Using Amazon Athena with Lookout for Metrics. You can use this capability in all Regions where Lookout for Metrics is publicly available. For more information about Region availability, see AWS Regional Services.
About the Authors
 Devesh Ratho is a Software Development Engineer in the Lookout for Metrics team. His interests lie in building scalable distributed systems. In his spare time, he enjoys sim racing.
 Chris King is a Senior Solutions Architect in Applied AI with AWS. He has a special interest in launching AI services and helped grow and build Amazon Personalize and Amazon Forecast before focusing on Amazon Lookout for Metrics. In his spare time he enjoys cooking, reading, boxing, and building models to predict the outcome of combat sports.
