AWS Partner Network (APN) Blog
How Cognizant Interactive Data Visualization Platform Helps with Data Integration, Interaction, and Insights
By Raghavendra Samant, Director Projects – Cognizant
By Arunava Das, Technical Architect – Cognizant
By Raja GT, Sr. Partner Solutions Architect – AWS
By Shaf Begen, Principal Partner Development Manager – AWS
 |
| Cognizant |
 |
As retail, manufacturing, consumer goods, and other enterprises expand and transform while seeking to modernize, there is a need to include new technologies with legacy applications in their landscape.
A typical retail enterprise system interacts with various business-critical systems to accomplish objectives. These systems transform and add value to the data as it moves. For example, a typical order management system (OMS) in a standard enterprise landscape will interact with 15+ applications to complete the order fulfillment journey.
These systems may include item/catalog management, inventory management, order capture, warehouse management, logistics management, and returns management. Each of these applications or services assists the central OMS in orchestrating the “customer order” journey and transferring order data through its lifecycle.
When business and technology teams want to manage and understand in real time how a customer’s order journey is handled, processed, and optimized, they require a sophisticated enterprise-grade platform that provides a “bird’s eye” view of supply chain metrics, and helps the organization deliver a perfect order by connecting to multiple data sources.
Interactive Data Visualization Platform is a low-code platform built on Amazon Web Services (AWS) which provides an environment for developing business applications and automated workflows with minimal code. It can integrate, transform, visualize, and analyze data from a variety of sources. It can also generate insights, resolve anomalies, and proactively identify issues and bottlenecks.
In this post, we will discuss key differentiators of the Interactive Data Visualization Platform—it’s used for data visualization from several data sources; it constructs interactive and intuitive user interfaces (UIs) and workflows; it loads data from multiple data sources in diverse formats.
Cognizant is an AWS Premier Tier Services Partner with 12 AWS Competencies. Cognizant is also a member of the AWS Managed Service Provider (MSP) and AWS Well-Architected Partner Programs.
Interactive Data Visualization Platform Overview
The Interactive Data Visualization Platform on AWS includes the following components:
- Data visualization engine.
- DataFlow connectors.
- Out-of-the-box UI widgets for rapidly developing business-centric solutions with low code approach.
Interactive Data Visualization Platform is built with API and security-first design principles across layers. Each component runs independently and has the flexibility to be customized.

Figure 1 – Overview of Interactive Data Visualization Platform.
Key features of the Interactive Data Visualization Platform include:
- Easy-to-build data-workflows, data-interaction, and insights.
- Drag-and-drop low-code platform for user interaction, insights, data integration, and CRUD (create, read, update, and delete) use cases.
- Configure business controls, metrics, alerts, and notifications.
- Easy-to-integrate low total cost of ownership (TCO) platform.
- Collect, process, and correlate data from numerous sources to provide a unified view.
- Provides a comparison of data patterns over time, enabling broader business choices in real time.
- Identify anomalies, bottlenecks, and issues.
- Find patterns and correlations between events.
Architecture Overview
The core components of the Interactive Data Visualization Platform are Spring Boot, Grafana, and Apache NiFi Docker containers that run on serverless AWS Fargate compute clusters. The platform utilizes Amazon RDS for PostgreSQL database which synchronously replicates data to another AWS Availability Zone (AZ).
Interactive Data Visualization Platform is automated and the Spring Boot application, Grafana, and Apache NiFi dockers container images are continuously delivered using AWS CodePipeline. It’s designed with multiple layers of protection and follows the principles of least privilege. The platform is deployed in a secure Amazon Virtual Private Cloud (VPC) to prevent unauthorized connectivity.
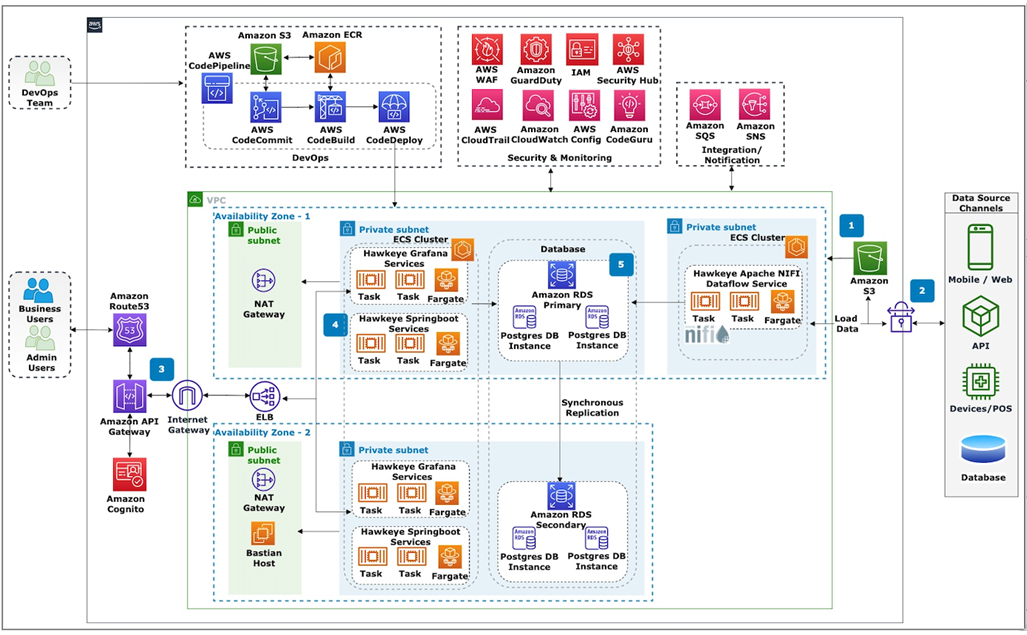
Figure 2 – Interactive Data Visualization Platform architecture.
The architecture components are explained below:
- Using DataFlow engine-specific workflows, load master data from external data sources and Amazon Simple Storage Service (Amazon S3) files. DataFlow is built on top of Apache NiFi, with workflows built on top of it. This aids in loading of master data and other scheduled data streams into Amazon RDS for PostgreSQL database.
- Data source channels such as point of sale (POS) machines, APIs, or external databases will interface with the application via the DataFlow engine. End users use the frontend UI to perform CRUD operations specific to business needs. The UI based on Grafana is pre-built for end users by designers and developers utilizing the low-code platform.
- Amazon API Gateway sends user requests to the Elastic Load Balancer, which in turn distributes the load across containers.
- Using a plugin mechanism, end users can interact with backend services through the UI layer. The plugins can be database-specific or REST APIs, which is used to invoke business APIs from the UI layer, whereas the database-specific plugin is used for direct database access. For example, you can use the built-in PostgreSQL data source plugin to connect to Amazon RDS for PostgreSQL.
- Spring Boot-based business services running on AWS Fargate update/insert data into Amazon RDS for PostgreSQL databases or communicate with other services, such as Amazon Simple Notification Service (SNS), to deliver notifications.
Building Work Order Management Solutions
Consider a quick serve restaurant (QSR) chain with 10,000+ stores serving thousands of customers each morning during rush hour; a single bad order fulfillment experience could mean losing the customer forever.
As QSR is an essential services industry, and customers typically enter the store continuously throughout the day. Stores rely heavily on the POS system for order capture, payment processing, and kitchen display systems to operate their business and provide an exceptional customer experience.
It’s vital from a customer experience standpoint to shorten the store’s order line and deliver efficient customer service. Moreover, many customers expect to “grab and go” their orders, pay without system difficulties, and have their orders processed and fulfilled promptly without any issues.
Typically, the franchisor operating these stores is responsible for asset management and maintenance. This requires day-to-day, monthly, and yearly planning of systems and processes. It also means the store’s systems and assets are updated with the latest software and security patches.
To achieve this goal, global QSR brands need a specialized work order scheduling system for their thousands of stores distributed across multiple time zones and countries. Technicians must be able to plan, execute, and possess specialized expertise for each upgrade within a predetermined timeframe due to store operating hours and peak considerations.
Using the Interactive Data Visualization Platform on AWS, businesses can quickly address the need for a work order management solution that enables the creation and management of deployment schedules across POS and kitchen display systems. In addition, Interactive Data Visualization Platform can generate real-time operational insights to monitor and track deployment activities, assign technicians, monitor delays, and schedule work orders.
Key functional capabilities of the Interactive Data Visualization Platform work order management solution are:
- Create and manage terminal software deployment schedules.
- Automatically track and trace software versions on store assets against planned deployments.
- Allow work order scheduling based on technician abilities, store operation hours, and availability.
- Provide centralized view of scheduling based on role-based access control (RBAC).
- Provide personalized dashboard view of schedules to technicians to work on their scheduled schedules.
- Scheduling alerts and exceptions.

Figure 3 – Work order management solution.
Key business benefits of the Interactive Data Visualization Platform work order management solution include:
- Streamlined process across stores and brands: Elimination of manual, spreadsheet, and email-based ad-hoc processes.
- Reduced operational risks and delays: During patching, security issues, downtimes, failures (payment, store promotions) which impacts franchises, their customer experience and check-out queue lengths at POS.
- Better franchisee experience and improved financial metrics: This includes asset depreciation and amortization costs.
- Centralized monitoring and control of schedules: This includes asset monitoring and upgrades from corporate teams.
- Long-term planning: This includes asset upgrades, improved return on asset lifecycle investment, and time management.
Conclusion
Businesses today require more comprehensive understanding and outcomes from their data. Cognizant’s ability to drive enterprise change and provide quick assistance to customers with a low-code solution is feasible thanks to the company’s unique blend of deep industry understanding, data, and technology expertise.
Interactive Data Visualization Platform on AWS can help when you are looking for a low-code platform solution which can integrate data from various sources, build intuitive user interfaces to capture data changes, and generate business-critical insights.
.

.
Cognizant – AWS Partner Spotlight
Cognizant is an AWS Premier Tier Services Partner and MSP that transforms customers’ business, operating, and technology models for the digital era by helping organizations envision, build, and run more innovative and efficient businesses.