AWS Partner Network (APN) Blog
Rapid Data Lake Development with Data Lake as Code Using AWS CloudFormation
By Kireet Kokala, VP Big Data & Analytics at nClouds
By Fernando Gonzalez, Sr. DevOps Engineer at nClouds
By Deepu Mathew, Sr. DevOps Engineer at nClouds
By Carlos Rodriguez, Sr. DevOps Engineer at nClouds
 |
This post presents a brief overview of data lakes, followed by an outline of nClouds’ proof of concept (PoC) strategy, use case, data set, and the integration of services we used to analyze fintech data.
We’ll explain how to accelerate data lake development with a data lake as code approach using a Cloud Development Kit (CDK) powered by AWS CloudFormation.
We will refer to a previous AWS PoC in the life sciences domain, and have extended the framework to be easier to use while integrating technologies like Amazon Redshift and Amazon QuickSight.
nClouds is an AWS Premier Consulting Partner with AWS Competencies in DevOps, Data & Analytics, and Migration, as well as a service validation in AWS CloudFormation.
nClouds, which is also a member of the AWS Managed Service Provider (MSP) and AWS Well-Architected Partner Programs, helps Amazon Web Services (AWS) customers transform data into actionable insights for their business.
Data Lakes Overview
A data lake is a set of technologies that enables the storage and analysis of vast volumes of data in its raw, natural format.
Data lakes have evolved into the single store-platform for all enterprise data managed. They are used for business intelligence (BI) tasks, like reporting and visualization, or advanced analytics and machine learning (ML).
On AWS, an integrated set of services are available to engineer and automate data lakes, such as AWS Glue, Amazon Simple Storage Service (Amazon S3), AWS Lake Formation, Amazon Athena, and Amazon Redshift that provide the backbone for companies to build unique solutions.
A data lake on AWS is able to group all of the previously mentioned services of relational and non-relational data and allow you to query results faster and at a lower cost.
Some of the advantages provided by data lakes are:
- Scalability: Meets the overall capabilities of the system to handle increasing amounts of data, including storage, network, and/or processes.
.
A primary advantage is the system’s potential to scale quickly and accommodate the explosion of data created by successful organizations. Since storage is separate than compute you have nothing to worry about the scaling the compute.
. - Cost effective: Because storage is affordable in Amazon S3 and you can bring your choice of compute(s) between Amazon EMR, Amazon Redshift, Amazon Athena, Amazon QuickSight, and Amazon SageMaker, there are various ways to bring in the appropriate service.
. - Formats: Dark data is an excellent example of data in various formats being recorded on an organization’s networks, but not necessarily used. This data has found special meaning on data lakes due to the ease of ingestion.
.
It’s especially true as a schema-on-read is used that improves flexibility because schemas are required only at the time of data consumption. Therefore, an as-is format of the ingested data is used thereby allowing data owners, stewards, and applications ease of access for processing.
. - Advanced analytics: Data lakes excel at ingesting increasingly large volumes of data while utilizing ML techniques to empower real-time decisioning systems. Amazon SageMaker is integrated natively with Amazon Athena and Amazon Redshift to design and build machine learning based analytics.
Data Lake Use Cases
Our primary PoC use case is to understand how global events have impacted the United States stock market and enable financial decisions based on the most recent stock market data.
We’ll enable the following analysis using data lakes:
- Determine which life-threatening diseases can be treated with antibiotics and medicines.
- Examine organizational application logs and network data to determine which cybersecurity threats are likely to occur or recur.
- Measure marketing campaign effectiveness via segmentation analytics on cloud-based decisioning platforms.
- Provision and experiment with large-volume and streaming data on a cost-effective basis.
- Use data lakes’ active archival strategy for recurring analysis of infrequently used data.
nClouds PoC — Data Lake on AWS
We based our PoC using the following AWS life sciences PoC architecture as a reference for our data lake efforts.
The reference blog post had featured a ChemBL dataset and OpenTargets as a means to find potential cures for dangerous diseases. This was accomplished via the advanced analytics enabled through data science experiments in an Amazon SageMaker notebook.
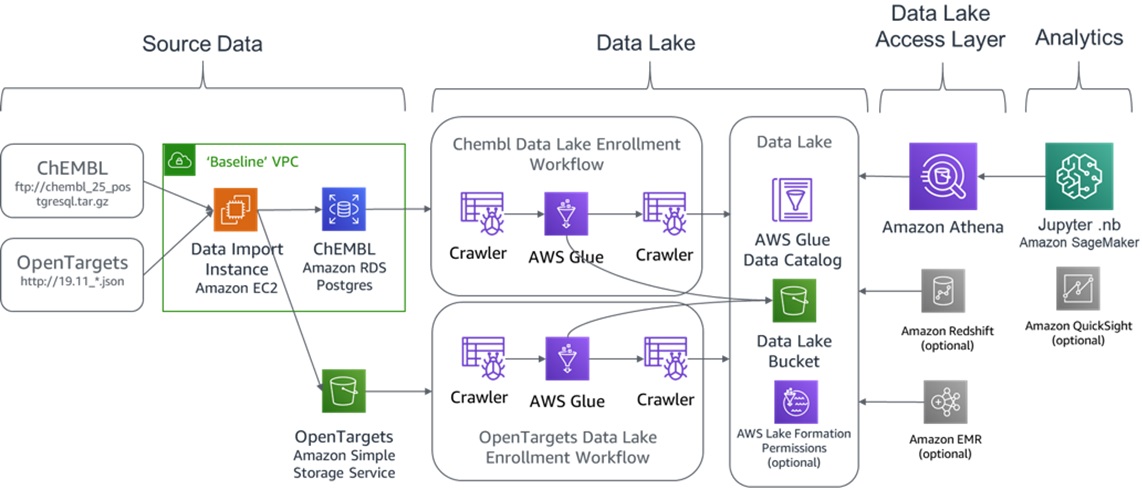
Figure 1 – A data lake as code featuring ChEMBL and OpenTargets.
We used an AWS data lake’s processing power to quickly solve the challenges in the financial markets caused by global events. The U.S. stock market data allowed us to examine prior and current financial trends, and then predict the plateaus in major stocks, as well as any economic recovery signals.
As the PoC architecture is not exclusively from a client-facing solution, it should be considered a demo configuration.
Elements of the data lake architecture featured herein have been proven and improved for our enterprise customers. The scalable patterns used in this PoC can also be readily implemented for prospective clients.
The high-level view of the end-to-end architecture we put in place is as follows:
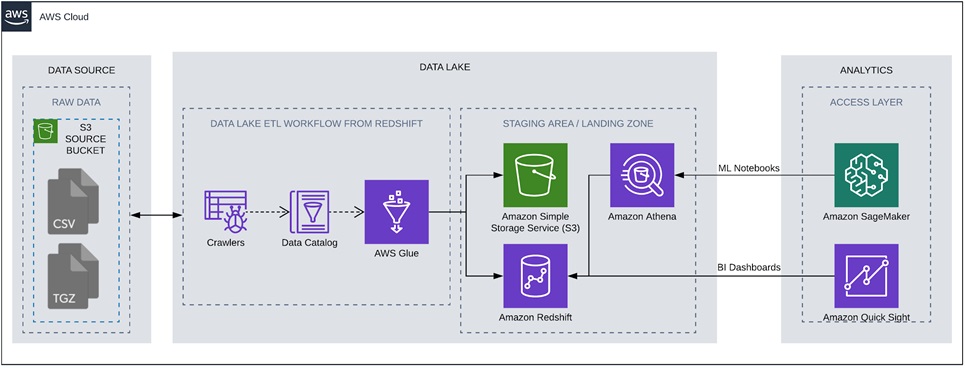
Figure 2 – Data lake PoC featuring AWS CloudFormation to automate data lake builds.
We ingested a publicly available dataset from Kaggle and nasdaqtrader.com. We then automated an Amazon SageMaker Studio notebook to download the data and store it in the appropriate S3 location. As a result, we had a more useful directory structure, which enabled us to use AWS Glue services and make it available in the analytics section of our PoC.
All AWS resources are created by CloudFormation templates, including Amazon Virtual Private Cloud (Amazon VPC), security groups, roles, S3 bucket, Amazon SageMaker notebook instances, and the associated AWS Glue resources.
The .csv formatted dataset wasn’t large at approximately 1-2 GB, but it also didn’t have the structure we needed. So, we used a custom Jupyter notebook to rename the original dataset’s files, and changed the ticker symbols to be in the folder name in S3 instead of being each file’s name. This allowed us to grab that information from the directories and preview the data using Amazon Athena.
The primary characteristics of the dataset was that there were several .csv files with stocks and exchange-traded funds (ETFs) data, and the only indication of the ticker symbol for individual stocks and ETFs was in the filename. None of the files contained a column with the ticker name or type indicator for a stock or ETF.
These types of scenarios typically necessitate the use of complex regular expressions (regex) to parse data and add necessary columns. Instead, we opted to use AWS Glue pipelines to correlate the data into one denormalized Amazon Redshift table, including a few computed columns to aid in data movement and analysis.
AWS Data Lake Setup
The following section contains instructions on how to create a cumulative PoC, which is powered by AWS CloudFormation templates. This CDK approach allows sharing components for infrastructure buildout around your organization.
The steps require access to Amazon S3 and CloudFormation in the AWS Management Console. The CloudFormation templates bring up the architecture described below.
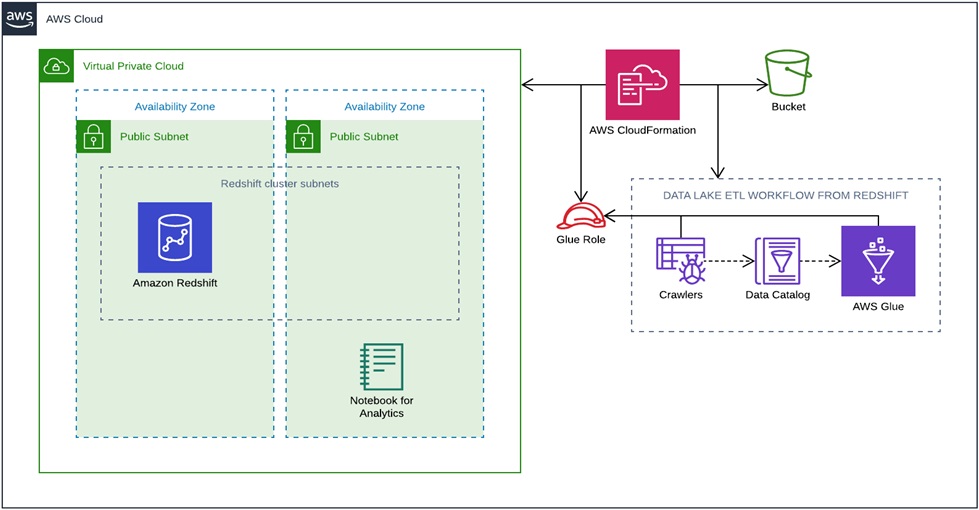
Figure 3 – AWS CloudFormation workflow view.
The repository contains the following templates:
- Master template: This CloudFormation template creates Nested Stacks for these resources:
- Amazon S3 bucket
- Amazon VPC
- AWS Identity and Access Management (IAM) role
- Amazon Redshift cluster
- AWS Glue crawlers and workflows
- Amazon SageMaker notebook instance
- Amazon S3 bucket: Creates an S3 bucket with a random number at the end with the regex as follows: stockmarket-#########
- Amazon VPC: Creates a VPC with two subnets of offset of eight, which in turn creates two public subnets with the required internet gateway and route.
- AWS IAM role: Creates one IAM role for AWS Glue resources that have full access to the S3 bucket among other policies:
- AWS Glue service role
- AWS Glue console full access
- Full access to the S3 bucket created in this PoC
- Amazon Redshift: Deploys an Amazon Redshift cluster inside the public subnet of a VPC. We decided to go with a public database to simplify the PoC, but it’s also possible to connect directly from Amazon QuickSight when the cluster is in private subnet.
- AWS Glue: Deploys AWS Glue resources with Glue catalog integration and serves as the extract, transform, load (ETL) layer for data movement between S3 and Amazon Redshift.
- Amazon SageMaker notebook: As the first step, we’ll use the notebook to load our data to S3. The template creates the notebook and pulls the code from a Git repository.
Clone the repository https://github.com/nclouds-code/data-lake-as-code/tree/feature/cfn into your local machine and upload the CloudFormation templates into an S3 bucket.
Once your templates are uploaded to the S3 bucket, select the master template and copy its URL location, which is used to bring up the CloudFormation stack.
Now, select the CloudFormation dashboard. Create a new stack using the URL copied from the previous step, and fill out the parameters as needed.
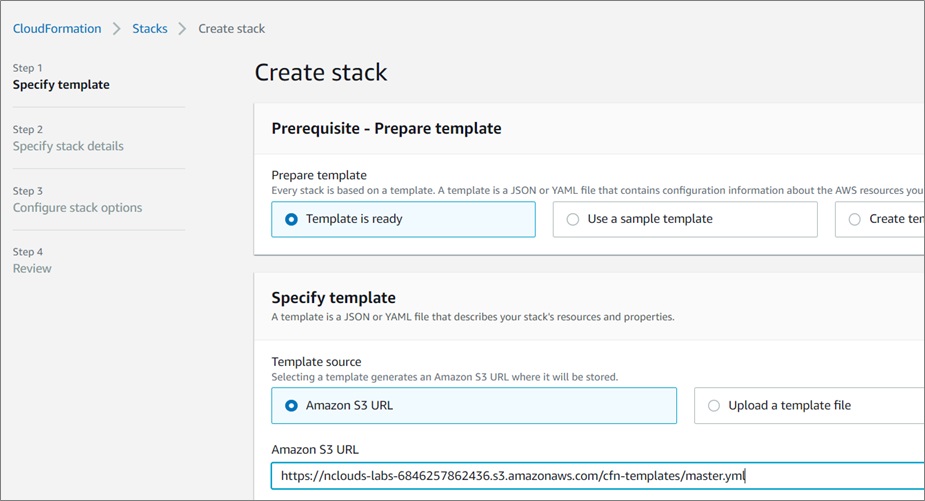
Figure 4 – AWS CloudFormation stack creation.
Once the setup is completed, click on Create Stack and wait until it’s propagated.
After all of the templates are deployed, go to the Amazon SageMaker notebook dashboard and open the Jupyter notebook, created as poc-stockmarket-notebook.
Once you’re in the notebook, open the file notebook.ipynb, and click on restart the kernel. Then, re-run the entire notebook.
After completing all of the steps, you’ll end up with the notebook shown below.
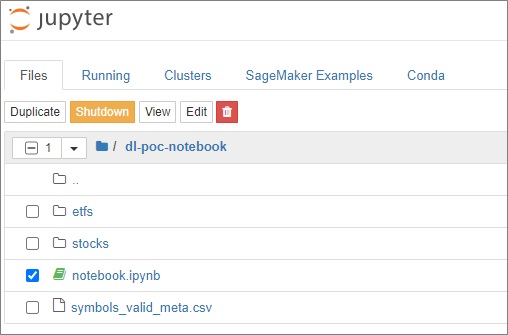
Figure 5 – Jupyter notebook for Amazon SageMaker.
The Amazon S3 directory will become populated. After this step is completed, the AWS Glue ETL process can be started.
Go to AWS Glue Workflow and select the stockmarketworkflow “workflow” and start it with Action > Run.
Progress is tracked in the History tab, in View run details.
This step enables ML-driven analysis. Although we only used it in this PoC for its machine learning capabilities, the Amazon SageMaker notebook can be used for advanced data analysis, ready correlation plots, and ML models to predict financial trends.
Visualization via Amazon QuickSight
The Amazon QuickSight data source was configured to read from the Amazon Redshift stockmarketpoc table. After experimenting with various plot types like scatter, histograms, and line charts, line charts were utilized to create four main visuals, which can be embedded into a dashboard or accessed via an endpoint.
The large dataset in the Amazon Redshift table enabled drilling down to a rolling year. That data showed the jump in the highest prices by stock, which peaked in February 2020 before they crashed in March and April of the same year.
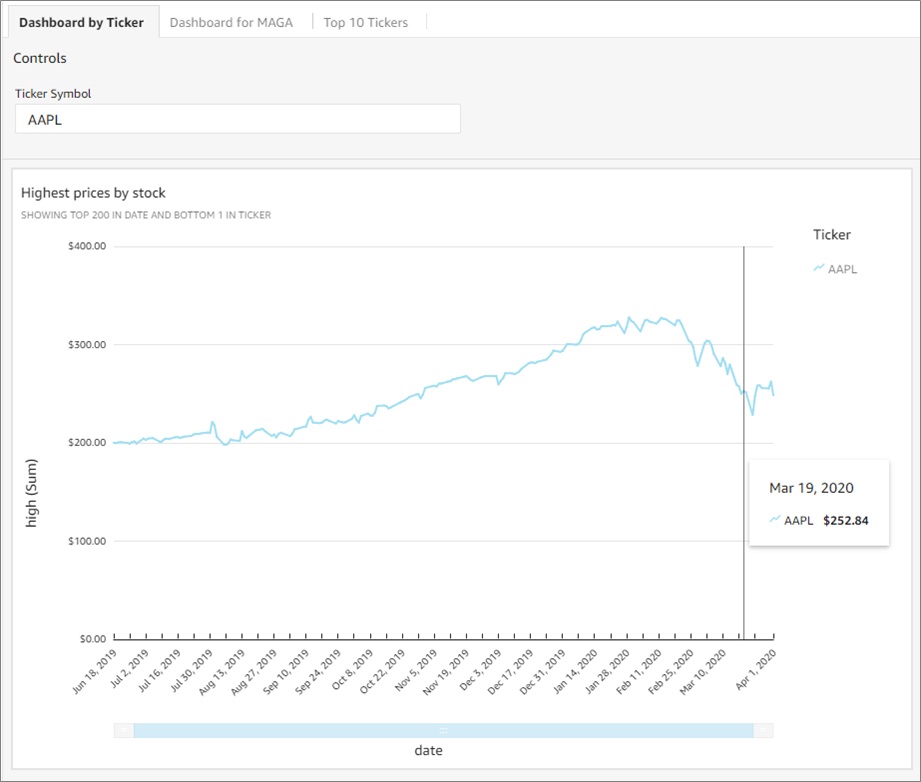
Figure 6 – Highest prices by stock visualization.
Conversely, we looked at the lowest prices by stocks. We saw a negligible movement with the MAGA (Microsoft, Amazon, Google, and Apple) stocks. This negligible movement somewhat guarded investors against the sharp fall between February and April of 2020.
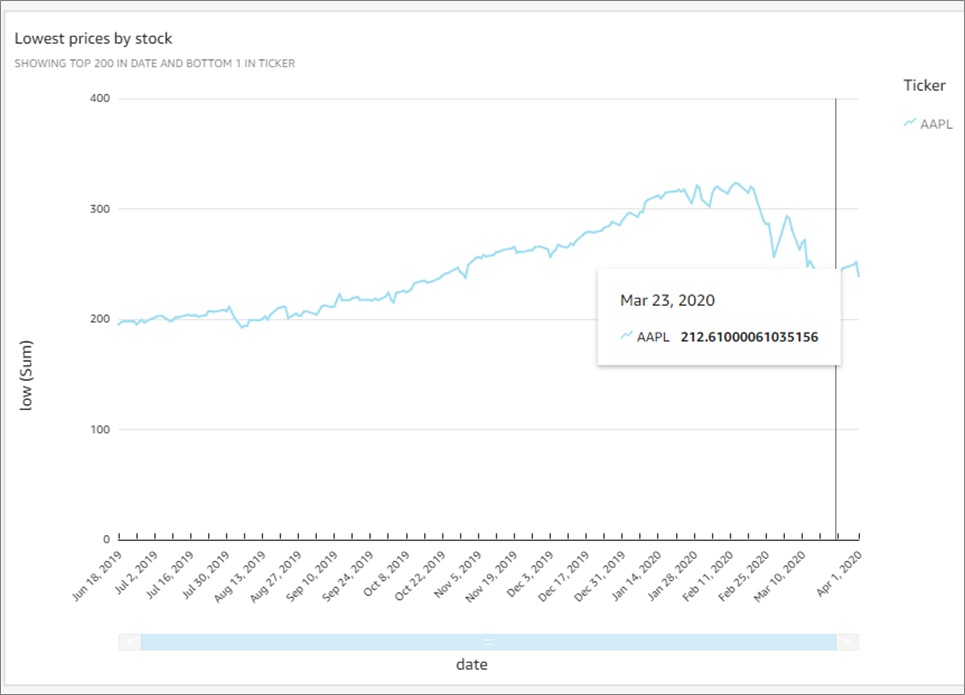
Figure 7 – Lowest prices by stock visualization.
The dashboard MAGA Stock comparison proved very useful in our analysis. It filtered those stocks from the year 2020 and displayed their individual and group performances from February to April 2020.
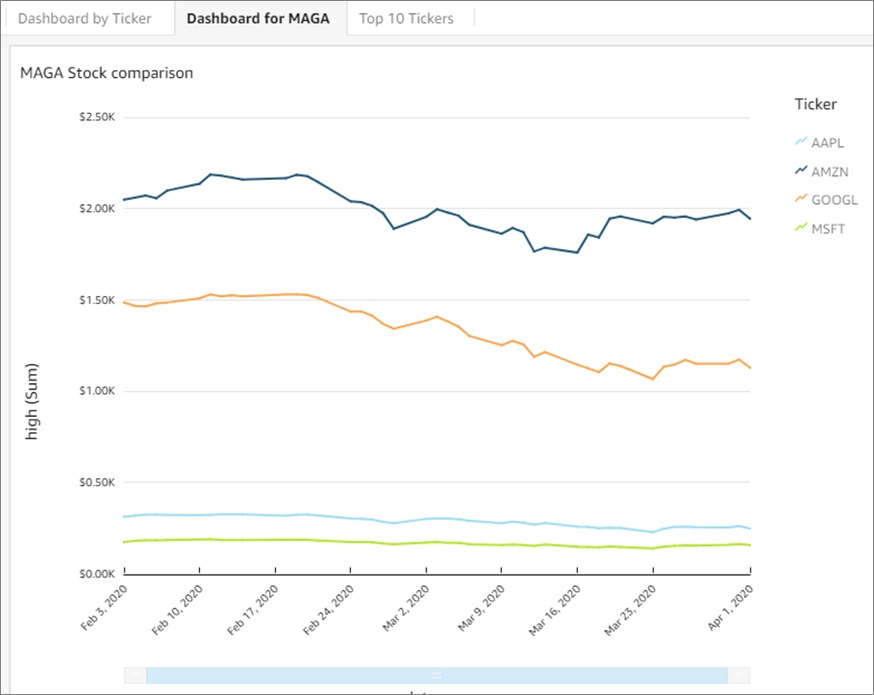
Figure 8 – MAGA stocks visualization.
These types of trend lines can be created for many types of patterned comparisons and studies. For example, the following dashboard, Sum of High by Ticker and Date, filters stocks by the Top 10 tickers and months in 2020.
Quick filters are a robust feature set of Amazon QuickSight, and underlying views enhance the execution speed of the queries powering dashboards.
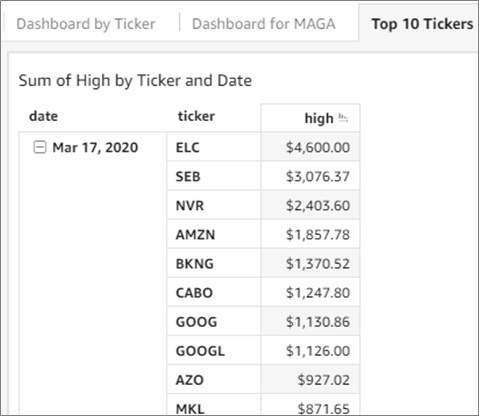
Figure 9 – Higher stock tickers sorted by date.
Conclusion
This post explained our engineering solution for a data lake at nClouds. We used code automation via AWS CloudFormation to create a dynamic data lake stack to visualize and analyze the financial market data.
The application of an automated, code-led data lake build allows a range of possibilities, from potentially accelerating project timelines to implementing robust, scalable systems.
For tight integration, reduced costs, and large-scale data applications, we encourage you to leverage CloudFormation and AWS Lake Formation services to improve your cloud infrastructure.
AWS Lake Formation—with the integration of Amazon Redshift, Amazon SageMaker, and Amazon QuickSight—efficiently handles data ingestion, enables immediate storage and querying of new data, and displays quick visualizations combined with advanced analytics.
Do you need the how-to for implementing data lakes on AWS? Check out our on-demand webinar with experts from AWS and nClouds and learn how to assess your readiness and implementation options.
The content and opinions in this blog are those of the third party author and AWS is not responsible for the content or accuracy of this post.
.

.
nClouds – AWS Partner Spotlight
nClouds is an AWS Premier Consulting Partner and Managed Service Provider that helps customers build and manage modern infrastructure solutions that deliver innovation faster.
Contact nClouds | Practice Overview
*Already worked with nClouds? Rate the Partner
*To review an AWS Partner, you must be a customer that has worked with them directly on a project.