Category: AWS CloudTrail
AWS CloudTrail Update – Turn on in All Regions & Use Multiple Trails
My colleague Sivakanth Mundru wrote the guest post below in order to share news of some important new features for AWS CloudTrail.
— Jeff;As many of you know AWS CloudTrail provides visibility into API activity in your AWS account and enables you to answer important questions such as which user made an API call or which resources were acted upon in an API call. Today, we are happy to deliver two features that are many of you asked for:
- The ability to turn on CloudTrail across all AWS regions.
- Support for multiple trails.
Turn on CloudTrail in All Regions
Until now, you had to turn on CloudTrail for each desired region. Many of you provided feedback to us that this is time consuming, and asked for the ability to turn on CloudTrail in all regions with few clicks.
Starting immediately, you can simply specify that a trail will apply to all regions and CloudTrail will automatically create the same trail in each region, record and process log files in each region, and deliver log files from all regions to the S3 bucket or (optionally) the CloudWatch Logs log group you specified.
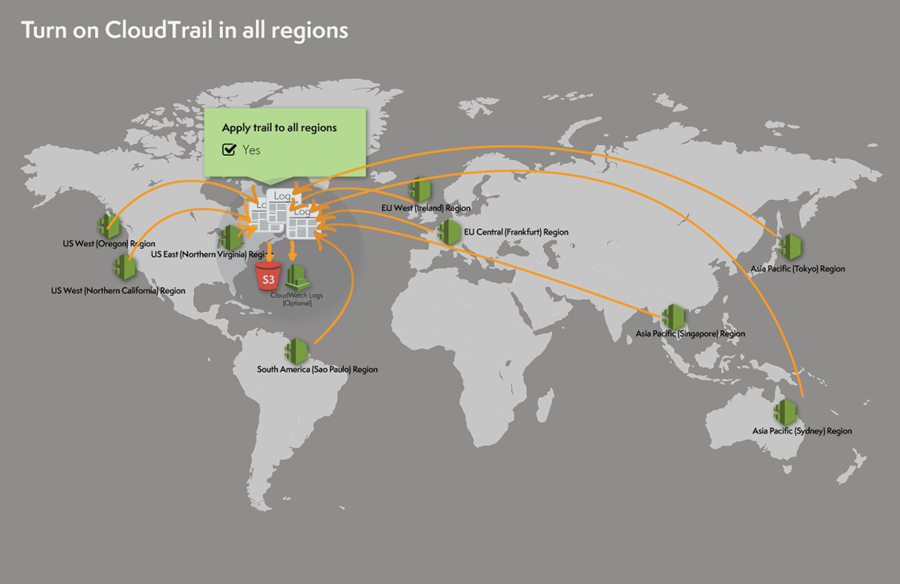
To be a bit more specific, “all” refers to the regions within a single AWS partition. The US East (Northern Virginia), US West (Northern California), US West (Oregon), Europe (Ireland), Europe (Frankfurt), Asia Pacific (Sydney), Asia Pacific (Sydney), Asia Pacific (Tokyo), and South America (Brazil) regions are all in the aws partition; the China (Beijing) region is in the aws-cn partition (read Amazon Resource Names (ARNs) and AWS Service Namespaces to learn more). The features described in this post apply to the aws partition.
Future Proof for New Regions
In addition to turning on CloudTrail for all existing regions, when AWS launches a new region CloudTrail will create the trail in the new region and turn it on. As a result, you will receive log files containing API activity for your AWS account in the new region without taking any action.
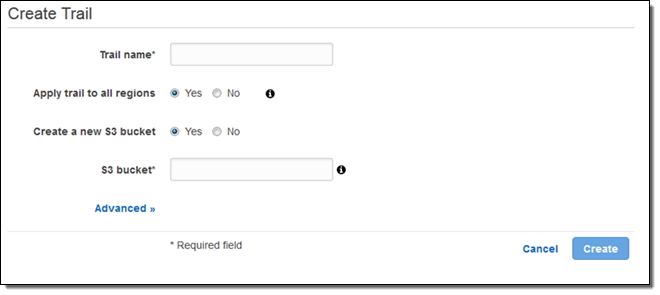
Here’s how you turn on CloudTrail in all regions via the AWS Management Console:
Support for Multiple Trails
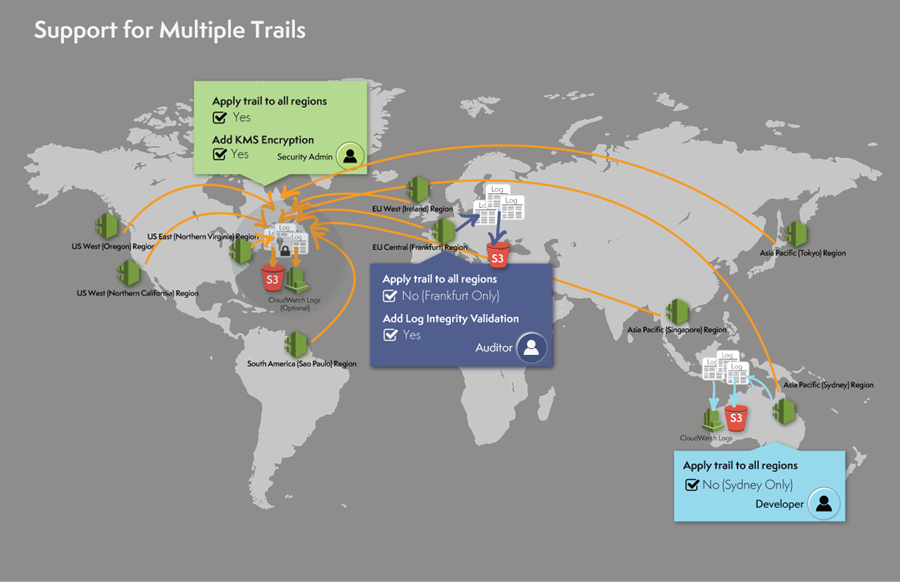
CloudTrail log files enable you to troubleshoot operational or security issues in your AWS account and help you demonstrate compliance with your internal policies or external standards. Different stakeholders have different needs. With support for multiple trails, different stakeholders in the company can create and manage their own trails for their own needs. For example:
- A security administrator can create a trail that applies to all regions and encrypt the log files with one KMS key.
- A developer can create a trail that applies to one region, for example Asia Pacific (Sydney), and configure CloudWatch alarms to receive notifications of specific API activity.
- An IT auditor can create a trail that applies to one region, say Europe (Frankfurt), and configure log file integrity validation to positively assert that log files are not changed since CloudTrail delivered the log files to an S3 bucket.
Here’s what this would look like:
You can create up to 5 trails per region (a trail that applies to all regions exists in each region and counted as 1 trail per region).
As part of today’s launch we are announcing support for resource level permissions so that you can prescribe granular access control policies on which users can or cannot take particular actions on a given trail. For more details and sample policies, see the CloudTrail documentation.
Viewing and Managing Trails Across Regions
We are also announcing an important enhancement to the CloudTrail Console!
You can now view and manage trails across all regions in a partition, no matter which region you are in. You will see all the trails for your account in every region. You can click on the trail name and CloudTrail will navigate to the trail configuration page automatically:
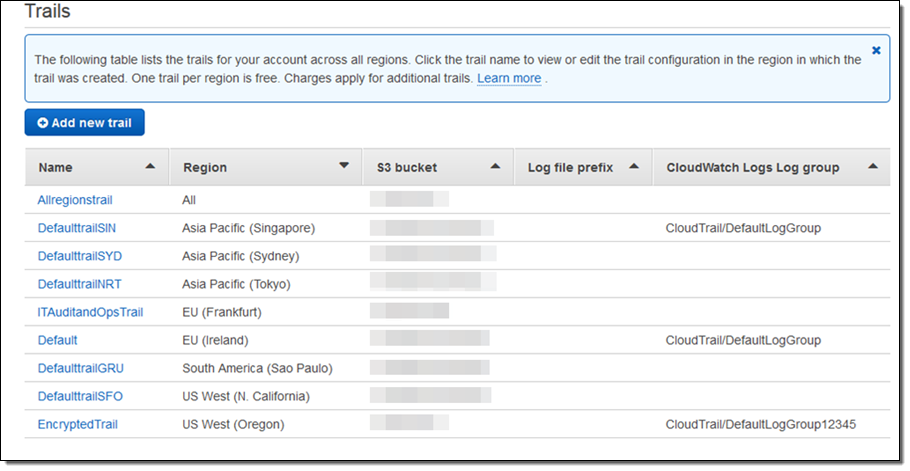
As you can see, the trail named Allregionstrail applies to all regions. This means that the Allregionstrail exists in every region and log files for all regions are recorded and delivered to one S3 bucket and an optional CloudWatch Logs log group. Other trails are specific to a region and log files for those specific regions are recorded and delivered as per the trail configuration. You can click on a trail name to view, edit or delete a trail.
Pricing
All new and existing AWS customers can create one trail per region and record API activity for services supported by CloudTrail as a part of the free tier. The free tier does not have an expiration.
A trail that applies to all regions exists in each region and counted as 1 trail per region.
You pay $2.00 per 100,000 events recorded in each additional trail. There is no charge for creating additional trails.
— Sivakanth Mundru, Senior Product Manager
AWS CloudTrail Update – SSE-KMS Encryption & Log File Integrity Verification
My colleague Sivakanth Mundru sent the guest post below to introduce a pair of features for AWS CloudTrail.
— Jeff;
As you know, AWS CloudTrail records API calls made on your account and delivers log files containing API activity to an S3 bucket you specify. Today, we are announcing two new features for CloudTrail:
- Support for Encryption using SSE-KMS – You can add an additional layer of security for the CloudTrail log files stored in your S3 bucket by encrypting them with your AWS Key Management Service (KMS) key. CloudTrail will encrypt the log files using the KMS key you specify.
- Log File Integrity Validation – You can validate the integrity of the CloudTrail log files stored in your S3 bucket and detect whether they were deleted or modified after CloudTrail delivered them to your S3 bucket. You can use the log file integrity (LFI) validation as a part of your security and auditing discipline.
These features are available today in the US East (Northern Virginia), US West (Oregon), US West (Northern California), Europe (Ireland), Europe (Frankfurt), Asia Pacific (Tokyo), Asia Pacific (Sydney), Asia Pacific (Singapore), and South America (Brazil) regions.
Support for Encryption Using KMS
CloudTrail generates log files and sends them to a S3 bucket. By default, the files are encrypted using S3’s Server Side Encryption (SSE), and then transparently decrypted when you read them. With today’s launch you can now provide a KMS key to CloudTrail and it will be used to encrypt your log files. As is the case with SSE, decryption is transparent and automatic if you have permission to read the object. Therefore, applications that read and process log files do not require any changes. You simply need to give S3 permission to decrypt the files. Here’s how it all fits together:
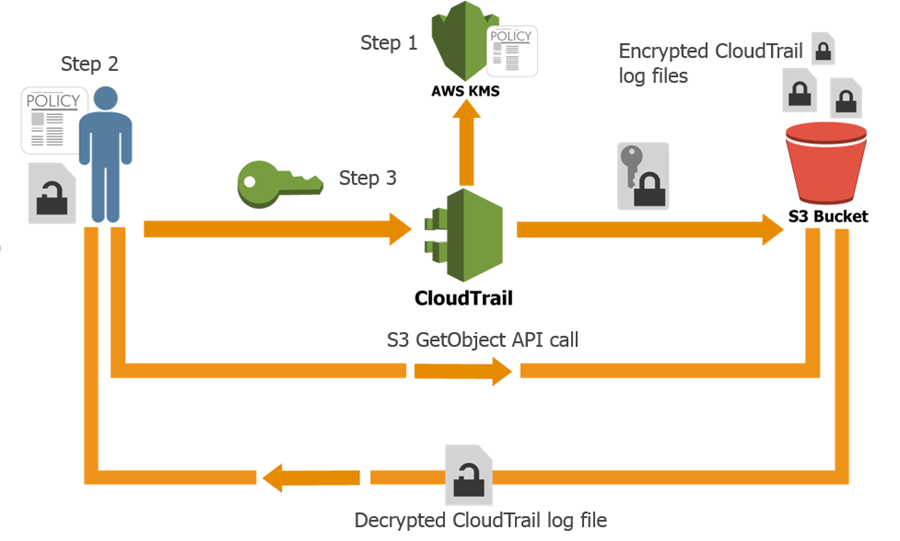
Here’s how you can set this up yourself:
- Create a KMS key or use an existing KMS key in the same region as the S3 bucket where you receive your CloudTrail log files and apply the KMS-CloudTrail policy.
- Apply decrypt permissions to the principal (IAM users, roles, groups, and so forth) that will be accessing the CloudTrail log files.
- Update an existing trail with the KMS key from step 1 (you can enable encryption at the time you create a trail if you use the CLI).
Log File Integrity Validation
If you are doing a security audit or investigation, you may want to validate the integrity of the CloudTrail log files stored in your S3 bucket and detect whether they been deleted or modified since CloudTrail delivered the log file to your S3 bucket (the expectation is that they will be unchanged). The new CloudTrail log file integrity validation feature enables you do that.
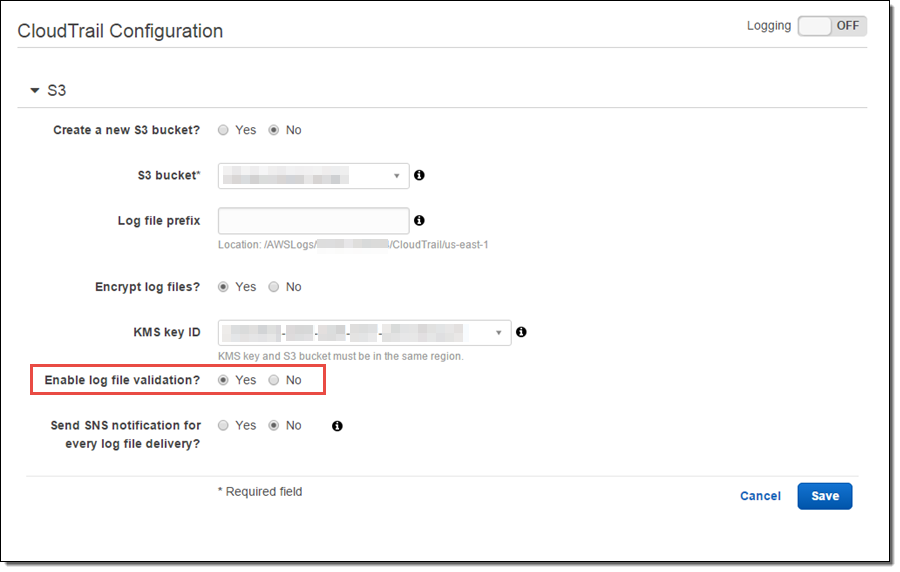
In order to validate the integrity of log files, you need to enable log file validation for your trail. You can do this by setting Enable log file validation to Yes in the advanced section of your trail configuration:
Once you enable log file integrity validation, CloudTrail will start delivering digest files, on an hourly basis, to the same S3 bucket where you receive your CloudTrail log files, but with a different prefix:
- CloudTrail log files are delivered to /optional_prefix/AWSLogs/AccountID/CloudTrail/*.
- CloudTrail digest files are delivered to /optional_prefix/AWSLogs/AccountID/CloudTrail-Digest/*.
This layout allows applications that integrate with CloudTrail to process the log files without making any changes. You can also apply different and granular access control permission to the log files and digest files.
The digest files contain information about the log files that were delivered to your S3 bucket, hash values for those log files, digital signatures for the previous digest file and the digital signature for the current digest file in the S3 metadata section. For more information about digest files, digital signatures and hash values, read about the CloudTrail Digest File Structure.
To validate the CloudTrail log files, use the AWS Command Line Interface (CLI) and simply run the following command to validate the log files:
$ aws cloudtrail validate-logs \
  --trail-arn arn:aws:cloudtrail:us-west-2:111111111111:trail/Trailname \
  --start-time 2015-09-24T00:00:00Z --region=us-west-2
If the log files have not been modified or deleted you will see output that looks like this:
Validating log files for trail arn:aws:cloudtrail:us-west-2:111111111111:trail/Trailname between \
  2015-09-24T00:00:00Z and 2015-09-25T18:56:41Z
Results requested for 2015-09-24T00:00:00Z to 2015-09-25T18:56:41Z
Results found for 2015-09-24T00:30:26Z to 2015-09-25T18:56:41Z:
43/43 digest files valid
31/31 log files valid
If one or more log files have been deleted you will see output that looks like this:
Log file s3://mybucket-CTlogs/AWSLogs/111111111111/CloudTrail/us-west-2/2015/09/22/111111111111_CloudTrail_us-west-2_20150922T1720Z_Jy4SwZotr3eTI2FM.json.gz \
       INVALID: not found
Results requested for 2015-09-22T00:00:00Z to 2015-09-25T18:42:03Z
Results found for 2015-09-22T00:30:26Z to 2015-09-25T18:42:03Z:
43/43 digest files valid
30/31 log files valid, 1/31 log files INVALID
If one or more log files have been modified you will see output that looks like this:
Log file s3://mybucket-CTlogs/AWSLogs/111111111111/CloudTrail/us-west-2/2015/09/25/111111111111_CloudTrail_us-west-2_20150925T1845Z_lU58MiCsXyI1U3R1.json.gz \
       INVALID: hash value doesn't match
Results requested for 2015-09-24T00:00:00Z to 2015-09-25T21:44:50Z
Results found for 2015-09-24T00:30:26Z to 2015-09-25T21:44:50Z:
45/45 digest files valid
35/36 log files valid, 1/36 log files INVALID
You can run the validate-logs command in verbose mode to perform a deeper analysis.
To learn more about this feature, read about Validating CloudTrail Log File Integrity.
If you have any questions or feedback on these new features, you can post them in the CloudTrail forums.
— Sivakanth Mundru, Senior Product Manager, AWS CloudTrail
Look Before You Leap – The Coming Leap Second and AWS (Updated)
My colleague Mingxue Zhao sent me a guest post designed to make sure that you are aware of an important time / clock issue.
Note: This post was first published on May 18, 2015. We made some important additions and corrections on May 25, 2015.
— Jeff;
The International Earth Rotation and Reference Systems (IERS) recently announced that an extra second will be injected into civil time at the end of June 30th, 2015. This means that the last minute of June 30th, 2015 will have 61 seconds. If a clock is synchronized to the standard civil time, it should show an extra second 23:59:60 on that day between 23:59:59 and 00:00:00. This extra second is called a leap second. There have been 25 such leap seconds since 1972. The last one took place on June 30th, 2012.
Clocks in IT systems do not always follow the standard above and can behave in many different ways. For example:
- Some Linux kernels implement a one-seconds backwards jump instead of the extra “:60” second, repeating the 59th second (see the article, Resolve Leap Second Issues in Red Hat Enterprise Linux for more information).
- Windows time servers ignore the leap second signal and will sync to the correct time after the leap second (see How the Windows Time Service Treats a Leap Second for more information).
- Some organizations, including Amazon Web Services, plan to spread the extra second over many hours surrounding the leap second by making every second slightly longer.
- If a clock doesn’t connect to a time synchronization system, it drifts on its own and will not implement any leap second or an adjustment for it.
If you want to know whether your applications and systems can properly handle the leap second, contact your providers. If you run time-sensitive workloads and need to know how AWS clocks will behave, read this document carefully. In general, there are three affected parts:
- The AWS Management Console and backend systems
- Amazon EC2 instances
- Other AWS managed resources
For more information about comparing AWS clocks to UTC, see the AWS Adjusted Time section of this post.
AWS Management Console and Backend Systems
The AWS Management Console and backend systems will NOT implement the leap second. Instead, we will spread the one extra second over a 24-hour period surrounding the leap second by making each second slightly longer. During these 24 hours, AWS clocks may be up to 0.5 second behind or ahead of the standard civil time (see the AWS Adjusted Time section for more information).
You can see adjusted times in consoles (including resource creation timestamps), metering records, billing records, Amazon CloudFront logs, and AWS CloudTrail logs. You will not see a “:60” second in these places and your usage will be billed according to the adjusted time.
Amazon EC2 Instances
Each EC2 instance has its own clock and is fully under your control; AWS does not manage instance clocks. An instance clock can have any of the behaviors listed at the beginning of this post. Contact your OS provider to understand the expected behavior of your operating system.
If you use the Amazon Linux AMI, your instance will implement the one-second backwards jump and will see “23:59:59” twice. You may find the following information useful:
- Forum post: Amazon Linux AMI and the 2015-06-30 leap second.
- Configuring NTP for instances using Amazon Linux AMIs: Setting the Time for Your Linux Instance.
- Configuring NTP for instances using Amazon-provided Microsoft Windows AMIs: Setting the Time for a Windows Instance.
If you use SUSE Linux Enterprise Server, take a look at Fixes and Workaround to Avoid Issues Caused by Leap Second 2015.
Other AWS Managed Resources
Other AWS resources may also have their own clocks. Unlike EC2 instances, these resources are fully or partially managed by AWS.
The following resources will implement the one-second backwards jump and will see :23:59:59″ twice:
- Amazon CloudSearch clusters
- Amazon EC2 Container Service instances
- Amazon EMR Clusters
- Amazon RDS instances
- Amazon Redshift instances
To enable time synchronization on EMR clusters, your VPC has to allow access to NTP. Make sure that your EMR clusters have access to the Internet, and that your security groups and network ACLs allow outbound UDP traffic on port 123.
AWS Adjusted Time
This section provides specific details on how clocks will behave in the AWS Management Console and backend systems.
Starting at 12:00:00 PM on June 30th, 2015, we will slow down AWS clocks by 1/86400. Every second on AWS clocks will take 1+1/86400 seconds of “real” time, until 12:00:00 PM on July 1st, 2015, when AWS clocks will be behind by a full second. Meanwhile, the standard civil time (UTC) will implement the leap second at the end of June 30th, 2015 and fall behind by a full second, too. Therefore, at 12:00:00 PM July 1st, 2015, AWS clocks will be synchronized to UTC again. The table below illustrates these changes.
| UTC | AWS Adjusted Clock | AWS vs. UTC | Notes |
| 11:59:59 AM June 30th, 2015 | 11:59:59 AM June 30th, 2015 | +0 | AWS clocks are synchronized to UTC. |
| 12:00:00 PM | 12:00:00 PM | +0 | |
| 12:00:01 | Each second is 1/86400 longer and AWS clocks fall behind UTC. The gap gradually increases to up to 1/2 second. | ||
| 12:00:01 | +1/86400 | ||
| 12:00:02 | |||
| 12:00:02 | +2/86400 | ||
| … | … | … | |
| 23:59:59 | |||
| 23:59:59 | +43199/86400 | ||
| 23:59:60 | Leap second injected to UTC. | ||
| 00:00:00 AM July 1st, 2015 | -1/2 | AWS clocks gain 1/2 second ahead of UTC. | |
| 00:00:00 AM July 1st, 2015 | AWS clocks keep falling behind and the gap with UTC shrinks gradually. | ||
| 00:00:01 | -43199/86400 | ||
| 00:00:01 | |||
| 00:00:02 | -43198/86400 | ||
| … | … | … | |
| 11:59:59 AM | -1/86400 | ||
| 11:59:59 AM | |||
| 12:00:00 PM July 1st ,2015 | 12:00:00 PM July 1st ,2015 | +0 | The gap shrinks to zero. AWS clocks synchronize to UTC again. |
| 12:00:01 | 12:00:01 | +0 | |
| … | … | … |
If you have any questions about this upcoming event, please contact AWS Support or post in the EC2 Forum.
— Mingxue Zhao, Senior Product Manager
New – AWS API Activity Lookup in CloudTrail
My colleague Sivakanth Mundru sent another guest post my way! This one shows you how to look up AWS API activity using CloudTrail.
— Jeff;

“The ability to look up API activity in AWS CloudTrail helps us easily troubleshoot security incidents and operational issues. We can now take immediate actions such as following up with the user who made the API call or creating a trouble ticket to do a deeper analysis.”
Gil Bahat, DevOps Engineer
Magisto
As you know, AWS CloudTrail captures API activity that is made on your AWS account and delivers log files containing API activity to an Amazon Simple Storage Service (S3) bucket and a CloudWatch Logs log group that you specify. Today, we are announcing support for looking up API activity using the CloudTrail Console, AWS SDKs, and AWS Command Line Interface (CLI). You can now more easily troubleshoot operational issues or analyze potential security incidents. You will continue to receive the log files in your S3 bucket so that you can use them as a part of demonstrating compliance with internal or external policies.
This feature is available immediately in the US East (Northern Virginia), US West (Oregon), US West (Northern California), Europe (Ireland), Asia Pacific (Sydney), Asia Pacific (Singapore), Europe (Frankfurt), Asia Pacific (Tokyo), and South America (Brazil) regions. You can look up API activity that was made to create, delete, or update AWS resources in your AWS account. You can look up API activity that was captured for your account in last 7 days for 28 AWS services including Amazon Elastic Compute Cloud (EC2), Amazon Relational Database Service (RDS), Amazon Elastic Block Store (EBS), Amazon Virtual Private Cloud, and AWS Identity and Access Management (IAM) (check out the CloudTrail Supported Services for more information).
If you have already turned on CloudTrail for your account, you do not need to take any other action. Simply go to the CloudTrail Console and the API activity related to creating, deleting, and updating AWS resources will be automatically available to you. If you haven’t turned on CloudTrail for your AWS account, turn it on now from the CloudTrail Console to take advantage of this new cool feature. Once you login to the CloudTrail Console, you will see the API activity history page where you can see the history of API activity for last 7 days. The API activity history is arranged in the reverse chronological order with the most recent events listed at the top. CloudTrail will retrieve older events for you as you scroll down.
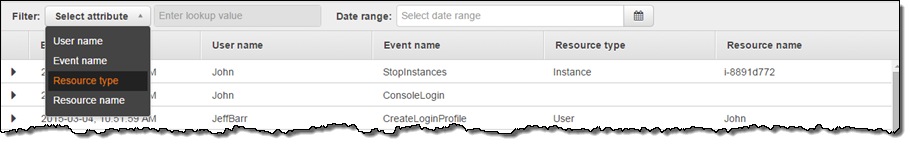
You can view the API activity and you can also filter it. This can help you to troubleshoot operational issues or security incidents. The 5 filters supported are: Range, Event name, User name, Resource type and Resource name:
Troubleshooting Operational Issues
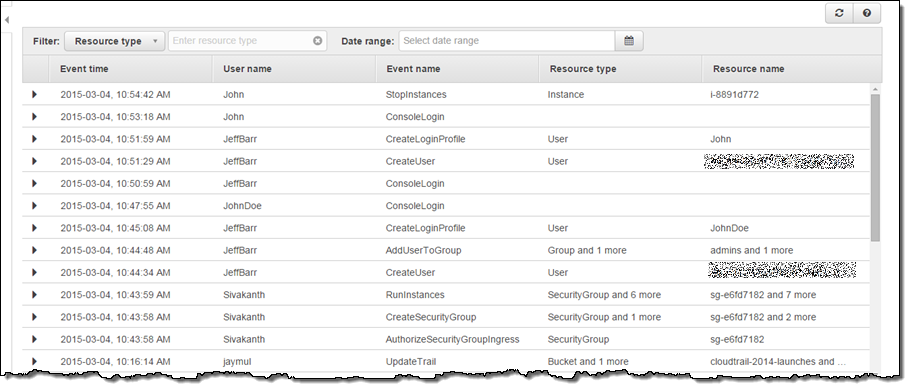
As I mentioned, you can use this feature to troubleshoot operational issues in your AWS account. For example, I saw that one of my EC2 instances in my web server fleet was not responding, so I navigated to the CloudTrail console and filtered the API activity by resource type EC2 Instance. I found that one of my team members (John) stopped the instance and was able to establish the root cause:
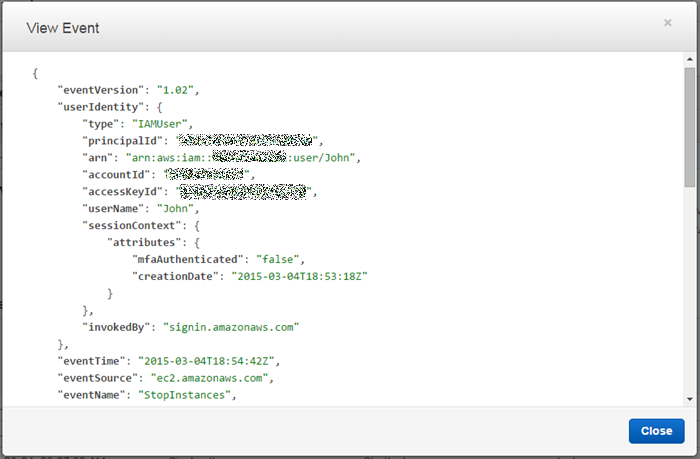
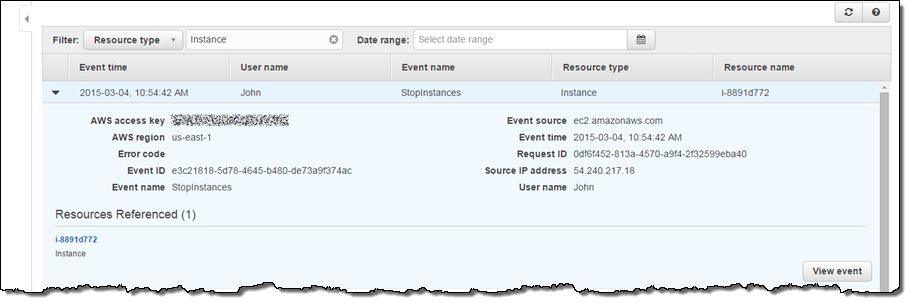 I checked with John, and he told me that he had stopped the instance in order to test the fault tolerance of our web server fleet. He was satisfied with the outcome of the test and agreed that we could start the instance. During my investigation I used the View Event button to take a closer look at the actual API call:
Reviewing Potential Security Incidents
Another type of event that many of you care about is the ConsoleLogin failures to the AWS console.
In my previous blog post, I showed you how to create CloudWatch alarms using this CloudFormation template and receive email notifications for certain network and security related API calls, including ConsoleLogin failures. You can follow the steps here to create an alarm that sends you a notification when three or more ConsoleLogin failures have occurred in the last 5 minutes.
Here is as an example of the email notification that I will receive when this happens:
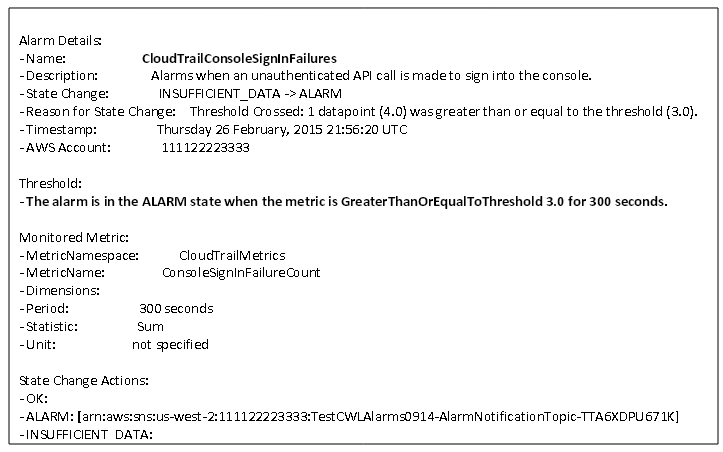
I can then navigate to the CloudTrail console and see what those events are and which IP addresses they are coming from. I can view the entire event to validate that the ConsoleLogin requests came from known IP addresses or perform a deeper security analysis, if I do not recognize the IP addresses.
These are just two examples of how you can use this feature to troubleshoot operational or security incidents.
— Sivakanth Mundru, Senior Product Manager
CloudTrail Integration with CloudWatch in Four More Regions
My colleague Sivakanth Mundru sent me a guest post with CloudTrail and CloudWatch integration news, along with information about a new CloudFormation template to help you to get going more quickly.
— Jeff;
At re: Invent 2014, we launched AWS CloudTrail integration with Amazon CloudWatch Logs in the US East (Northern Virginia), Europe (Ireland), and US West (Oregon) regions. With this integration, you can monitor for specific API calls that are made in your AWS account and receive email notifications when those API calls are made.
Today, we are making this feature available in Asia Pacific (Sydney), Asia Pacific (Singapore), Asia Pacific (Tokyo), and Europe (Frankfurt) regions with more regions to come in the future! We also created a AWS CloudFormation template to easily create CloudWatch alarms for API activity captured by CloudTrail.
CloudFormation Template
In this blog post, I will show you how you can use CloudFormation to configure CloudWatch alarms for monitoring critical network and security related API activity and receive an email notification when those API calls are made in your AWS account. This CloudFormation template contains predefined metric filters that monitor for critical network and security related API calls made to create, delete, and update Security Groups, Network ACL’s, Internet Gateways, EC2 instances, and IAM policy changes.
For more details, refer to the CloudTrail documentation that explains the alarms defined in the CloudFormation template. You can configure the CloudWatch alarms individually or you can tweak the metric filters to fit your own scenario.
Prerequisites
You need to configure CloudTrail log file delivery to CloudWatch Logs. The CloudTrail console provides secure default values for your configuration so that you can easily configure CloudTrail to send log files to CloudWatch Logs. Go to the CloudTrail Console or refer the CloudTrail documentation. If you use AWS in multiple regions, you can use the same process and CloudFormation template in those regions to monitor specific API calls and receive email notifications. If you are not using the default CloudWatch Logs log group, note the name to use in the CloudFormation template.
Step 1 – Download the CloudFormation Template
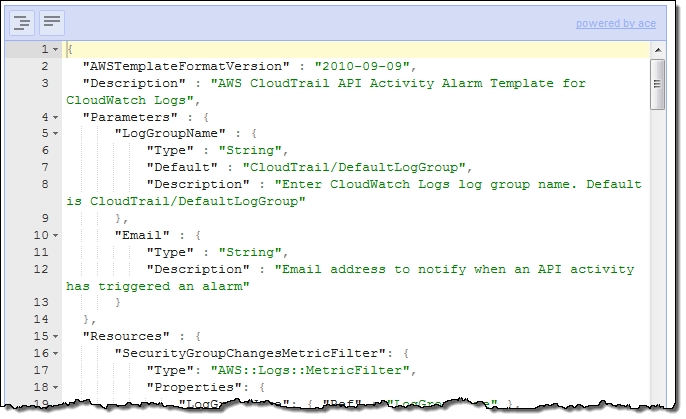
Download the template from https://s3-us-west-2.amazonaws.com/awscloudtrail/cloudwatch-alarms-for-cloudtrail-api-activity/CloudWatch_Alarms_for_CloudTrail_API_Activity.json and save it locally. The template is ready to go, but you are welcome to open it using your favorite text editor or an online JSON editing tool. Here’s a peek inside:
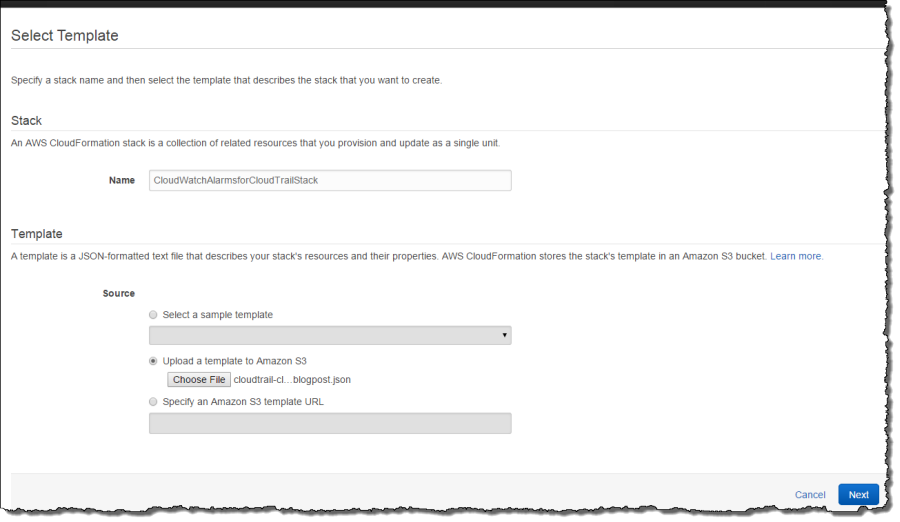
Step 2 – Upload the CloudFormation Template
Go to the CloudFormation Console and create a stack for uploading the template. Give the stack a name that is meaningful to you and upload the CloudFormation template from the location you used in Step 1.
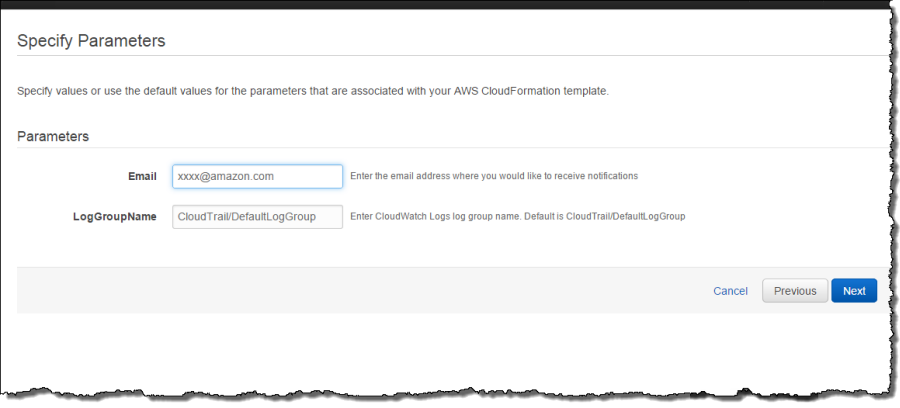
Step 3 – Specify Parameters
Click Next in the above screen to specify parameters. The parameters you need to specify are an email address where you would like to receive notifications and the CloudWatch Logs log group that you configured in step 1. The CloudFormation template will create an SNS topic and subscribe your email to that topic. Make sure you use the same CloudWatch Logs log group you specified in step 1.
Click Next for other options such as creating tags or other advanced options. In this case, I am not doing either one. In the next screen, you can review parameters and create the alarm stack.
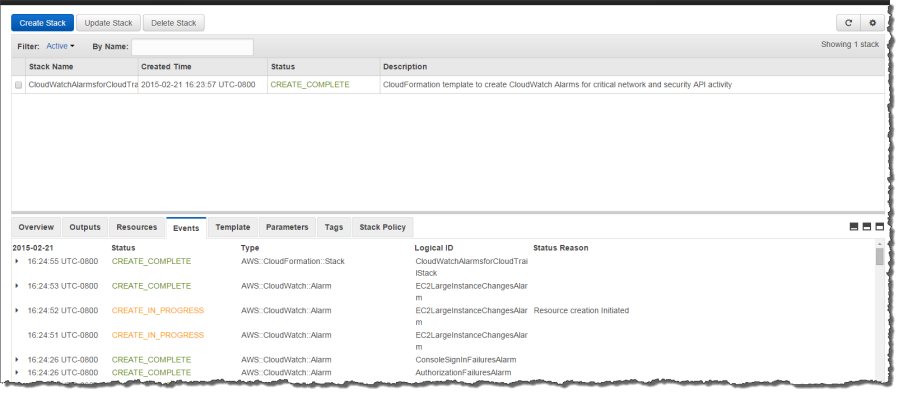
Step 4 – Review Parameters and Create
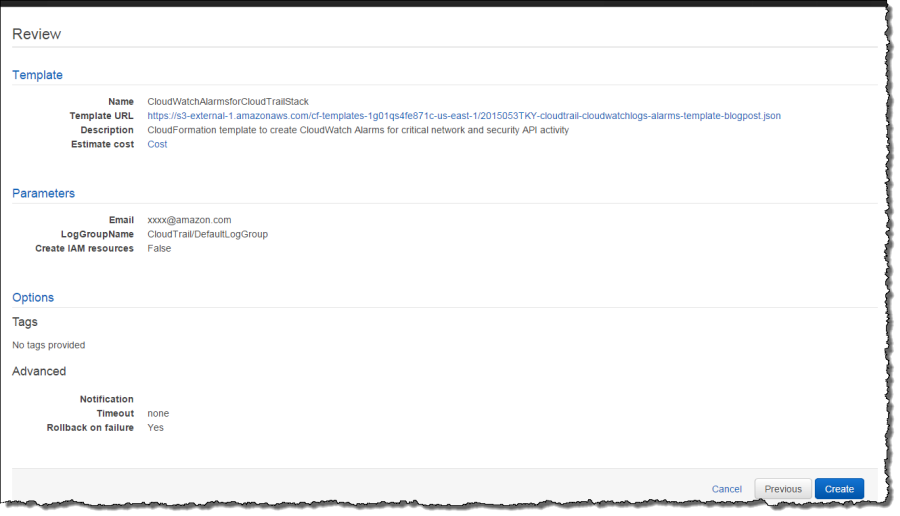
Verify that your email address and log group name are correct and click Create. Your CloudFormation stack will be created in few minutes.
Step 5 – Confirm Email Subscription from your Email
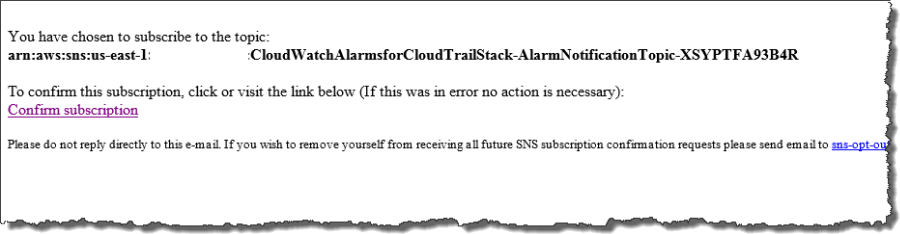
Once the CloudFormation stack creation process has completed, you will receive an email message that contains a request to validate your email address. Click Confirm Subscription in your email so that you can receive email notifications when alarms are triggered:
Step 6 – Receive Email Notifications
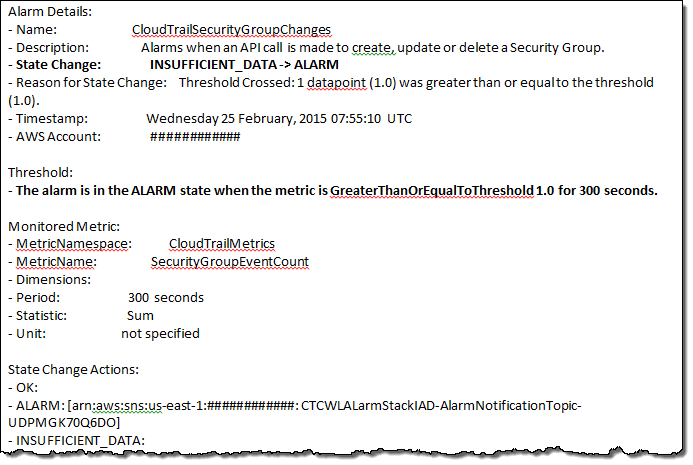
For example, the email I received below is a hint that an API call was made to create, update or delete a security group in my account:
If you would like us to add more alarms to the CloudFormation template, you can share that and other feedback in the CloudTrail forum.
You may also want to read the documentation for Using a AWS CloudFormation Template to Create CloudWatch Alarms and Creating CloudWatch Alarms for CloudTrail Events: Examples.
— Sivakanth Mundru, Senior Product Manager
Route 53 Update – Tagging, CloudTrail, One-Click Alarms, Visible Health Check Status
Amazon Route 53 is a highly available and scalable Domain Name Service (DNS) web service. In a nutshell, it translates symbolic names such as aws.amazon.com into numerical IP addresses like 176.32.100.36.
Today we are making Route 53 even more useful with the addition of four new features:
- Tagging of domains and hosted zones.
- API logging via CloudTrail.
- One-click alarms.
- Visible health check status.
Let’s take a look at each of these new features!
Tagging of Route 53 Resources
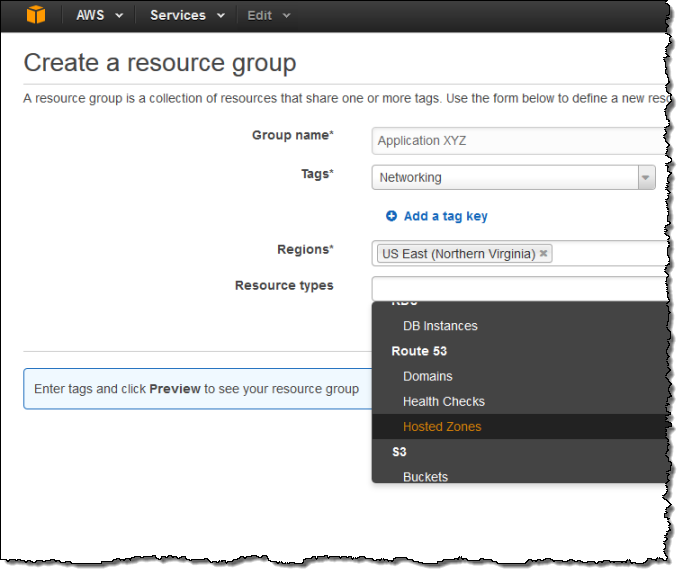
You can now organize your Route 53 resources (domains, hosted zones, and health checks) using tags. You can use the Cost Explorer to track the costs of the tagged resources and you can use Resource Groups to create and maintain collections of resources that share a common set of tags:
You can add and manage tags from the AWS Command Line Interface (CLI), the AWS Tools for Windows PowerShell, and the Route 53 APIs.
API Logging via CloudTrail
Calls to the Route 53 API are now logged to AWS CloudTrail. The information collected by CloudTrail can be used for resource tracking, security analysis, and compliance auditing.
One-Click Alarms
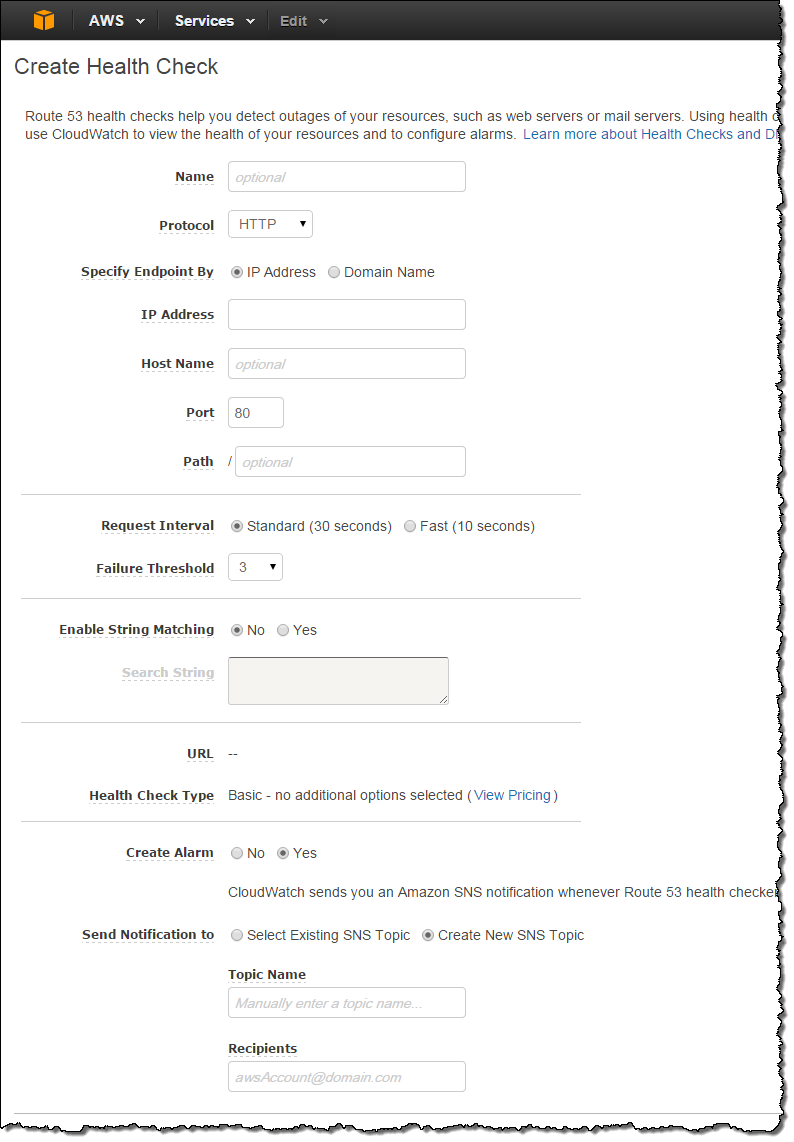
You can now create CloudWatch alarms to monitor the health of your Route 53 domains with a single click:
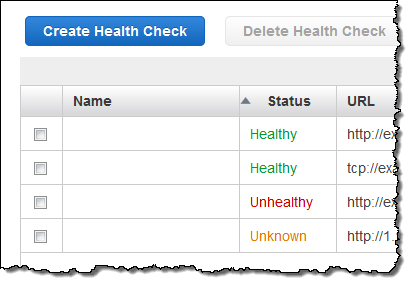
Visible Health Check Status
The status of your health checks is now visible at a glance in the Route 53 console:
Available Now
These features are available now and you can start using them today!
— Jeff;
AWS Config Update – New Regions, CloudTrail Support, ServiceNow
I first wrote about AWS Config last fall as part of our burst of announcements that we made during AWS re:Invent in Las Vegas. At that time I discussed the dynamic nature of the AWS cloud and how organizations face new challenges with regard to asset tracking, inventory management, change management, and governance when they move their operations to the cloud.
Today we are moving AWS Config out of Preview. We are also making it available in three additional regions and are now recording calls to the Config API in AWS CloudTrail. To top things, off, AWS Partner ServiceNow is ready to talk about the work that they have done to use the information generated by Config to drive their Configuration Management Database (CMDB).
Three More Regions
As we often do, we launched AWS Config in the US East (Northern Virginia) region. Today we are adding support for the US West (Oregon), Europe (Ireland), and Asia Pacific (Sydney) regions, with support for others also on the drawing board.
My initial blog post provided a detailed look at the Console interface to AWS Config. During the preview we made a number of stylistic and usability improvements to this interface, based in part on feedback from our customers. For a change of pace, let’s take a look at the data that it collects and stores.
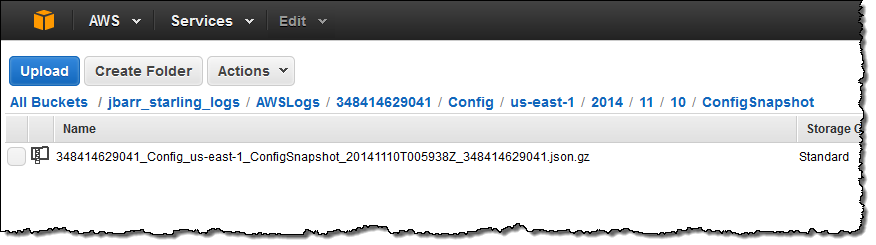
When I enabled AWS Config for my AWS account I created an AWS bucket called jbarr_starling_logs and set up the proper IAM permissions to allow Config to write to the bucket. At that time, Config took an initial inventory of my AWS configuration and stored it as a ConfigSnapshot:
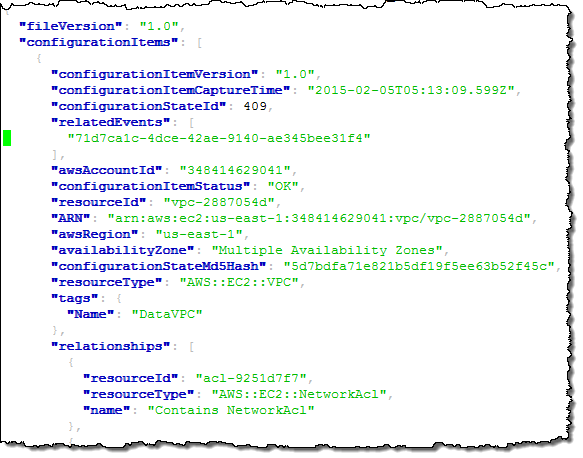
The snapshot file is in JSON form and can be formatted and inspected using the jq command. Here’s a small excerpt to give you a flavor for what’s inside the file:
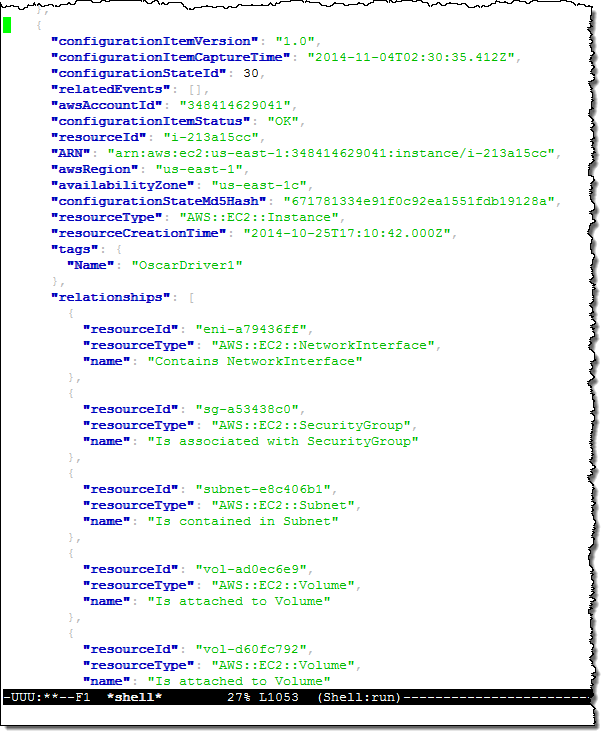
This excerpt describes one of my EC2 instances (“OscarDriver1”). As you can see, the snapshot contains information about the instance and the other AWS resources (Elastic Network Interfaces, Subnets, Security Groups, EBS Volumes, and so forth) that are related to it in some way (in most cases, you would use an application to analyze, visualize, and act on this information).
I can also use the cli-deliver-config-snapshot command to request fresh snapshots as needed.
Earlier today I made a slew of changes to my VPC configuration and deleted some resources that I no longer needed. Here’s what was written to the bucket shortly thereafter:
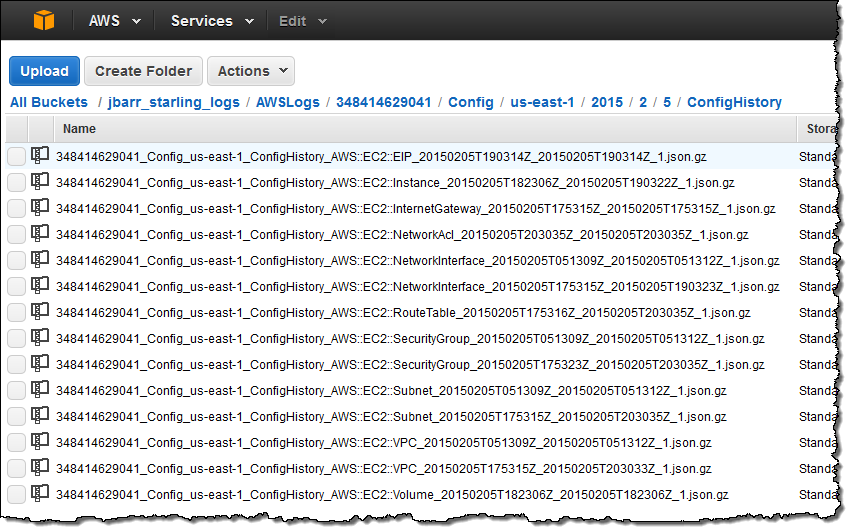
As you can see, there’s an entry for each AWS resource that I touched in some way. As was the case for the data in the initial snapshot, this information contains a lot of detail:
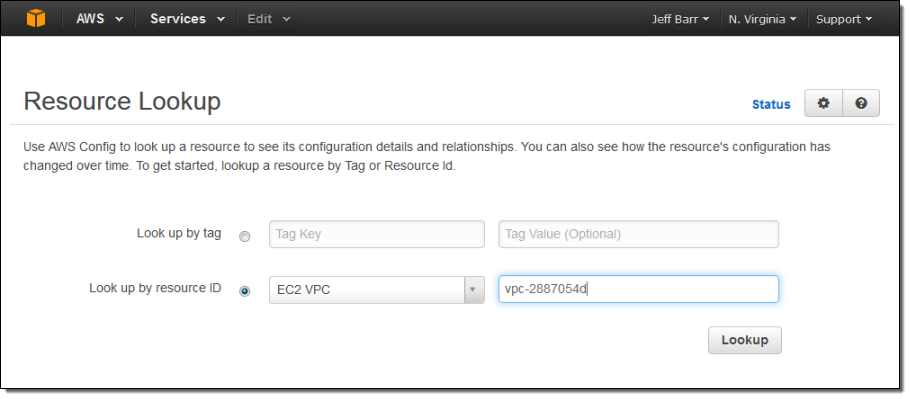
Now, let’s suppose that one of my colleagues was surprised by one of the changes and was wondering when a particular VPC was deleted. She could simply log in to to Console, enter the id (or a tag), and see for herself:
Here’s what she will see:
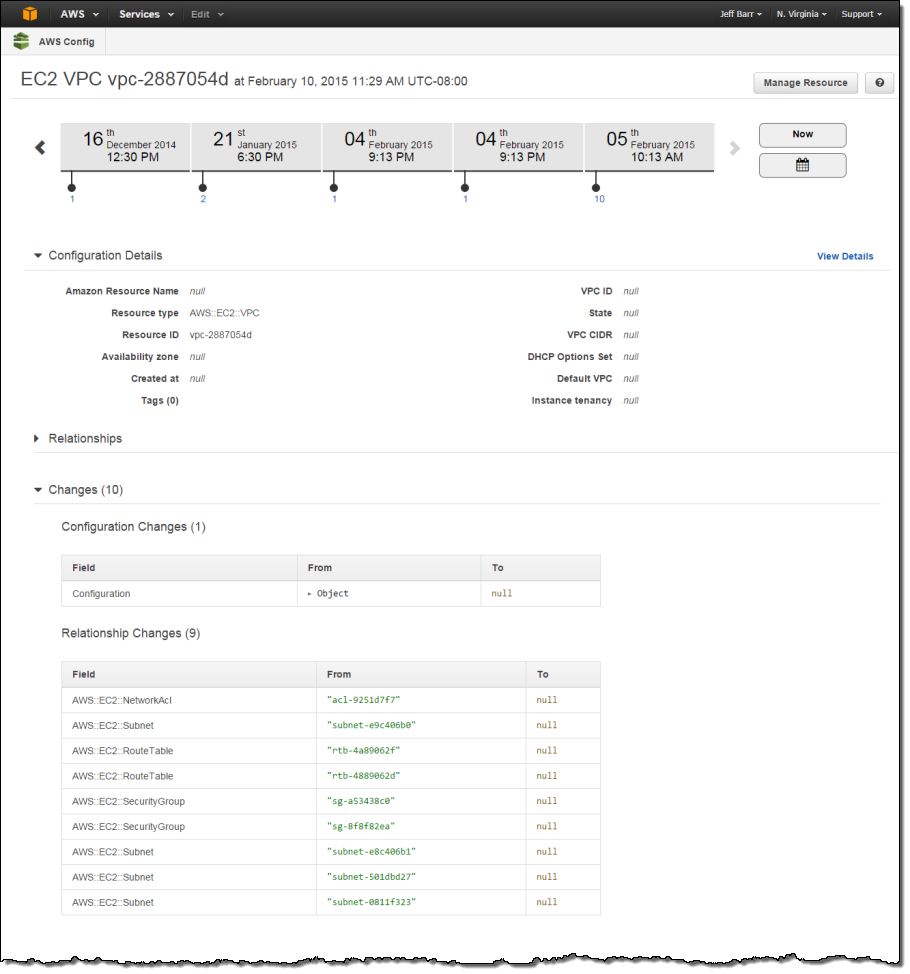
The example above illustrates some (but not all) of Config’s major features. It illustrates recording of configuration changes and delivery to Amazon S3. This happens on a continuous basis as changes are made to the resources. The console takes this recorded information and gives you the ability to browse through it in a structured fashion. The raw snapshot and change information (similar in concept to a dump of a SQL database) is also available to third-party and custom-built tools.
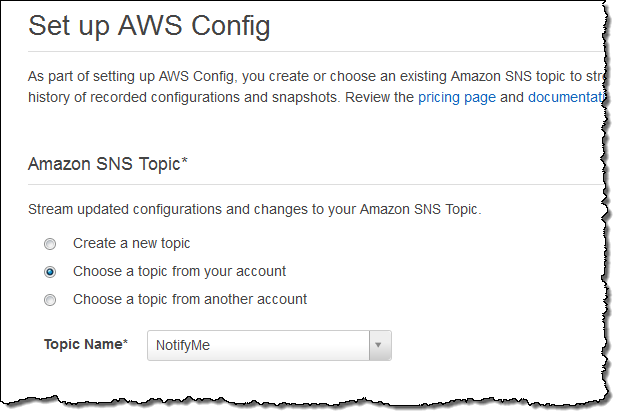
You can also tell Config to send configuration change notifications to an Amazon Simple Notification Service (SNS) topic. You can do this from within the Console:
If you want to centralize notifications that were generated in more than one region, simply create a single Amazon Simple Queue Service (SQS) queue and route (publish) all of the notifications to the queue.
CloudTrail Logging
The calls that you (or the console) make to the Config APIs are now captured and recorded by AWS CloudTrail. You can use this information to see if Config has been enabled or disabled over time.
ServiceNow Integration
AWS Partner ServiceNow provides a comprehensive solution for enterprises to manage services deployed in the Amazon cloud. ServiceNow integrates AWS Config with the ServiceNow CMDB, and allows you to manage usage and costs of your AWS resources at the application, service, and cost center levels. Here’s how it displays the information:
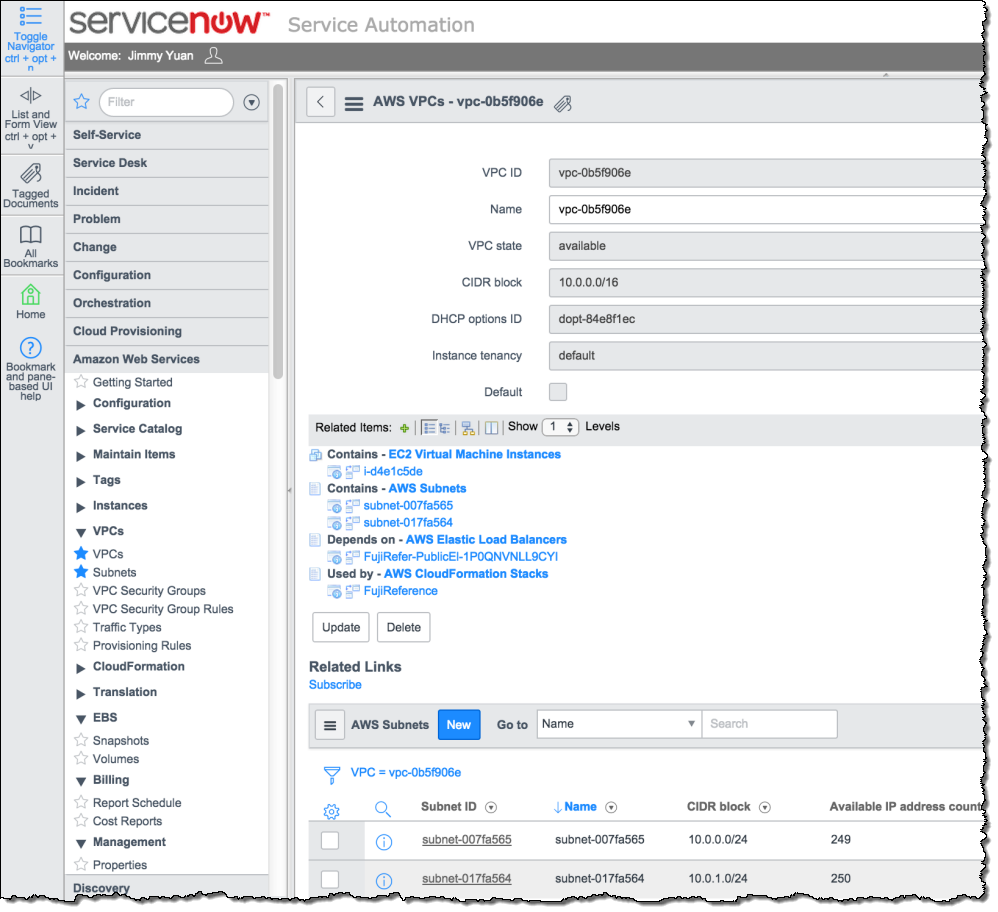
To learn more, take a look at ServiceNow Configuration Management.
Available Now
Config is available for use in the regions that I mentioned above. As detailed on the Config Pricing page, you pay based on the number of Configuration Items (changes to your resources) that are recorded each month, along with the usual charges for S3 storage and SNS usage. In most cases these charges will be very modest in comparison to the charges for the use of the actual AWS resources.
— Jeff;
Data Retrieval Policies and Audit Logging for Amazon Glacier
Amazon Glacier is a secure and durable storage service for data archiving and backup. You can store infrequently accessed data in Glacier for as little as $0.01 per gigabyte per month. When you need to retrieve your data, Glacier will make it available for download within 3 to 5 hours.
Today we are launching two new features for Glacier. First, we are making it easier for you to manage data retrieval costs by introducing the data retrieval policies feature. Second, we are happy to announce that Glacier now supports audit logging with AWS CloudTrail. This pair of features should make Glacier even more attractive to customers who are leveraging Glacier as part of their archival solutions, where managing a predictable budget and the ability to create and examine audit trails are both very important.
Data Retrieval Policies
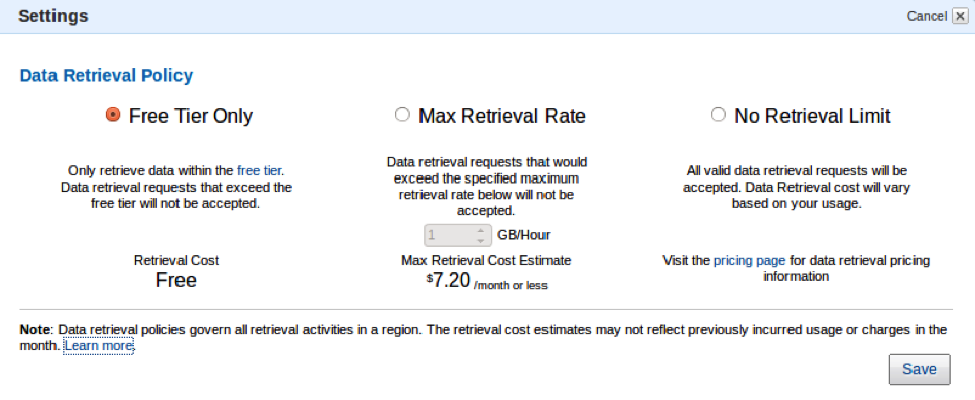
Glacier’s new data retrieval policies will help you manage your data retrieval costs with just a few clicks in the AWS Management Console. As you may know, Glacier’s free retrieval tier allows you to retrieve up to 5% of your monthly storage (pro-rated daily). This is best for smooth, incremental retrievals. With today’s launch you now have three options:
- Free Tier Only – You can retrieve up to 5% of your stored data per month. Retrieval requests above the daily free tier allowance will not be accepted. You will not incur data retrieval costs while this option is in effect. This is the default value for all newly created AWS accounts.
- Max Retrieval Rate – You can cap the retrieval rate by specifying a gigabyte per hour limit in the AWS Management Console. With this setting, retrieval requests that would exceed the specified rate will not be accepted to ensure a data retrieval cost ceiling.
- No Retrieval Limit – You can choose to not set any data retrieval limits in which case all valid retrieval requests will be accepted. With this setting, your data retrieval cost will vary based on your usage. This is the default value for existing Amazon Glacier customers.
The options are chosen on a per-account, per-region basis and apply to all Glacier retrieval activities within the region. This is due to the fact that data retrieval costs vary by region and the free tier is also region-specific. Also note that the retrieval policies only govern retrieval requests issued directly against the Glacier service (on Glacier vaults) and do not govern Amazon S3 restore requests on data archived in the Glacier storage class via Amazon S3 lifecycle management.
Here is how you can set up your data retrieval policies in the AWS Management Console:
If you have chosen the Free Tier Only or Max Retrieval Rate policies, retrieval requests (or “retrieval jobs”, to use Glacier’s terminology) that would exceed the specified retrieval limit will not be accepted. Instead, they will return an error code with information about your retrieval policy. You can use this information to delay or spread out the retrievals. You can also choose to increase the Max Retrieval Rate to the appropriate level.
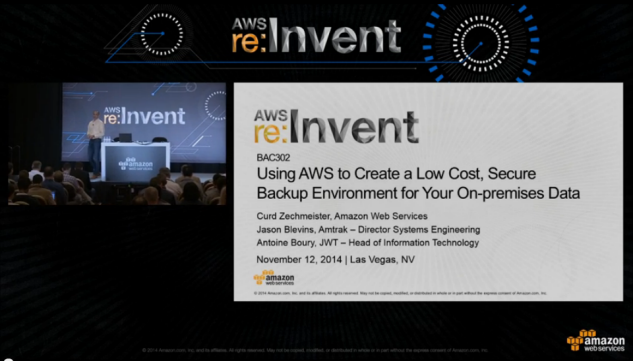
We believe that this new feature will give you additional control over your data retrieval costs, and that it will make Glacier an even better fit for your archival storage needs. You may want to watch this AWS re:Invent video to learn more:
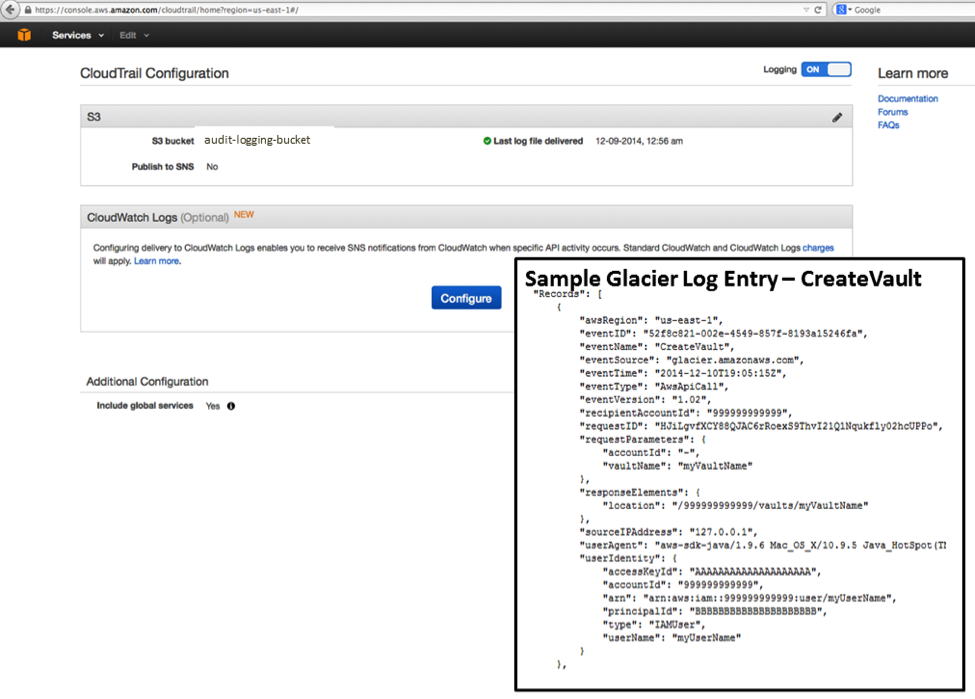
Audit Logging With CloudTrail
Glacier now supports audit logging with AWS CloudTrail. Once you have enabled CloudTrail for your account in a particular region, calls made to the Glacier APIs will be logged to Amazon Simple Storage Service (S3) and accessible to you from the AWS Management Console and third-party tools. The information provided to you in the log files will give you insight into the use of Glacier within your organization and should also help you to improve your organization’s compliance and governance profile.
Available Now
Both of these features are available now and you can start using them today in any region which supports Glacier and CloudTrail, as appropriate.
— Jeff;
Route 53 and CloudTrail Checks for the AWS Trusted Advisor
The AWS Trusted Advisor monitors your AWS resources and provides you with advice for cost optimization, security, performance, and fault tolerance. Today we are adding five additional checks that will be of benefit to users of Amazon Route 53 (Domain Name Services) and AWS CloudTrail (recording and logging of AWS API calls). With today’s launch, Trusted Advisor now performs a total of 37 checks, up from just 26 six months ago.
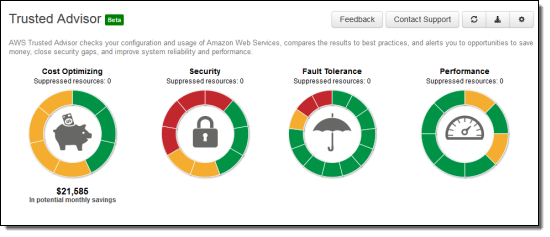
New Checks
There are four Route 53 checks and one CloudTrail check. Let’s start with Route 53, and take a look at each check.
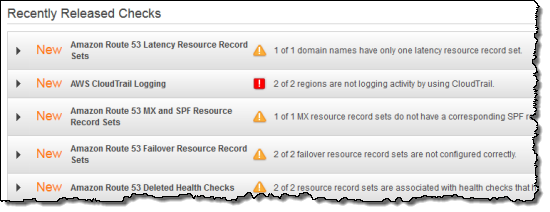
As you may know, Route 53 is a highly available and scalable DNS (Domain Name Service) web service. When you use Route 53 for a domain, you create a series of record sets. Each record set provides Route 53 with the information needed to map a name to a set of IP addresses. Today we are adding a set of checks to help you to use Route 53 in the most effective way possible.
The Latency Resource Record Sets check looks for proper and efficient use of latency record sets. A proper record set will always contain records for more than one AWS Region.
The MX and SPF Resource Record Sets check helps to improve email deliverability by checking for an SPF record for each MX record.
The Failover Resource Record Sets check verifies the configuration of record sets that are used to implement failover to a secondary resource set.
The Deleted Health Check check looks for record sets that refer to health checks which have been deleted.
AWS CloudTrail records and logs calls to the AWS API functions. The CloudTrail Logging check verifies that logging is properly configured and working as expected.
Check Today
If you have signed up for AWS Support at the Business or Enterprise level, you have access to the Trusted Advisor at no additional change.
— Jeff;
AWS CloudTrail – Capture AWS API Activity
Do you have the need to track the API calls for one or more AWS accounts? If so, the new AWS CloudTrail service is for you.
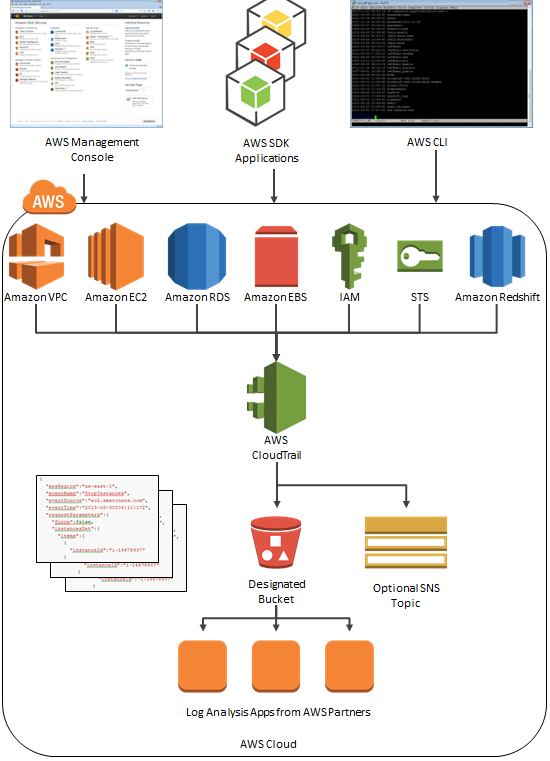
Once enabled, AWS CloudTrail records the calls made to the AWS APIs using the AWS Management Console, the AWS Command Line Interface (CLI), your own applications, and third-party software and publishes the resulting log files to the Amazon S3 bucket of your choice. CloudTrail can also issue a notification to an Amazon SNS topic of your choice each time a file is published. Each call is logged in JSON format for easy parsing and processing.
The API call history logged by CloudTrail is designed to support a wide variety of use cases. Here are some ideas to get you started:
- Compliance Aid – You have access to information needed to demonstrate that AWS resources were managed according to rules and regulatory standards.
- Resource Life Cycle Tracking -You can track an AWS resource from creation through deletion.
- Operational Troubleshooting – You can identify the most recent changes made to resources in your environment.
- Security Analytics – You can see which user activities failed due to inadequate permissions.
The data produced by CloudTrail can help you to answer questions such as:
- What actions did a given user take over a specific time period?
- For a given resource, which AWS user has taken action on it over a given time period?
- What is the source IP address of a particular activity?
CloudTrail logs API calls on the following AWS services:
- Elastic Compute Cloud (EC2)
- Elastic Block Store (EBS)
- Virtual Private Cloud (VPC)
- Relational Database Service (RDS)
- Identity and Access Management (IAM)
- Security Token Service (STS)
- Redshift
- CloudTrail
We plan to add support for additional services over time; please click here to let us know which services are most important to you.
There’s no charge for CloudTrail; you will pay the usual S3 and SNS charges to store the data and to receive the notifications.
CloudTrail Architecture
Here is a picture to help you understand how CloudTrail works:
Enabling and Configuring CloudTrail
You can enable CloudTrail from the AWS Management Console. You can route the log files to the S3 bucket of your choice. You can consolidate logs from multiple AWS accounts in a single bucket.
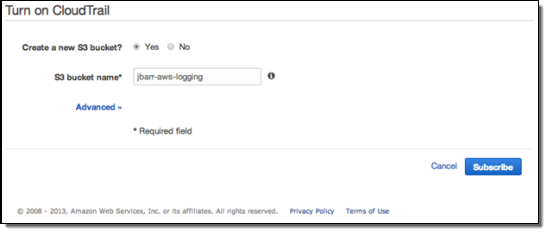
Here is how you enable CloudTrail using the AWS Management Console:
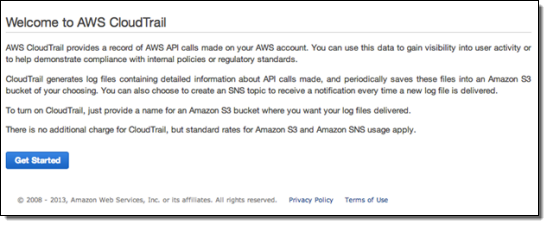
Click the Get Started button, then enter the configuration information. You can create a new S3 bucket or you can use an existing one. If you choose the default option and create a new bucket, CloudTrail will apply a suitable access policy to it. If you use an existing bucket, you will need to configure the policy yourself.
Using CloudTrail
Once you have enabled CloudTrail, log delivery will commence. Events will be delivered to the bucket, typically within 15 minutes after they take place. The log files are encrypted using S3’s Server Side Encryption and will remain in the bucket until you choose to delete or archive them (see my post on Archiving Amazon S3 Data to Glacier for more information). If you are using CloudTrail to pursue your compliance and auditing goals, you can add an additional layer of security by enabling MFA Delete on the bucket.
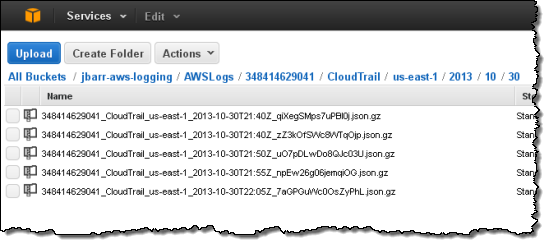
The log files will be organized by AWS Account Id, Region, Service Name, Date, and Time:
Each file contains events for all supported AWS Services. Each event is represented as a single JSON object. Note that the data includes AWS access keys. The following data represents a single Stop Instance request from the AWS Management Console:
{ "awsRegion":"us-east-1", "eventName":"StopInstances", "eventSource":"ec2.amazonaws.com", "eventTime":"2013-08-30T06:11:17Z", "requestParameters":{ "force":false, "instancesSet":{ "items":[ { "instanceId":"i-14678937" } ] } }, "responseElements":{ "instancesSet":{ "items":[ { "currentState":{ "code":64, "name":"stopping" }, "instanceId":"i-14678937", "previousState":{ "code":16, "name":"running" } } ] } }, "sourceIPAddress":"1.2.3.4", "userAgent":"AWS Console", "userIdentity":{ "accessKeyId":"ASxxxxxxxxxxxxxxxxxx", "accountId":"123456789012", "arn":"arn:aws:iam::123456789012:user/jbarr", "principalId":"AIxxxxxxxxxxxxxxxxxxx", "sessionContext":{ "attributes":{ "creationDate":"Thu Aug 29 14:36:54 PDT 2013", "mfaAuthenticated":"false" } }, "type":"IAMUser", "userName":"jdoe" } }
Learn more in the CloudTrail User Guide.
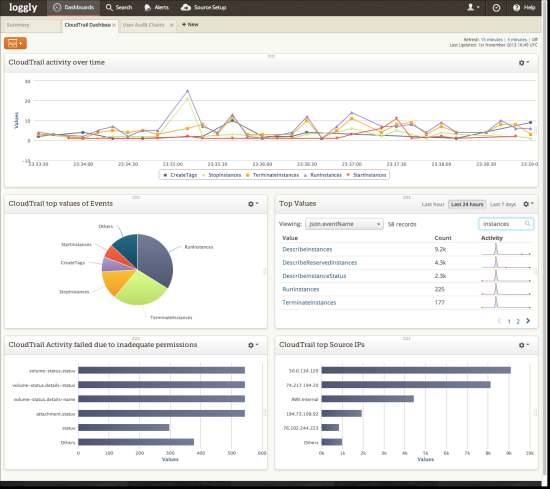
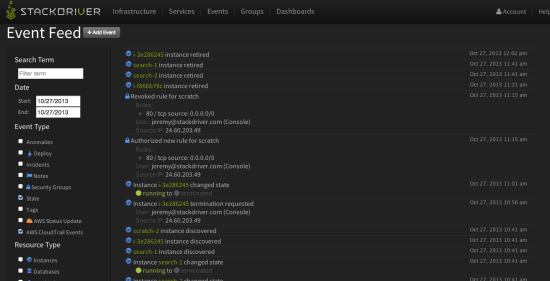
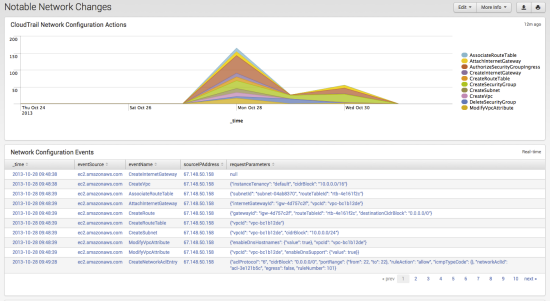
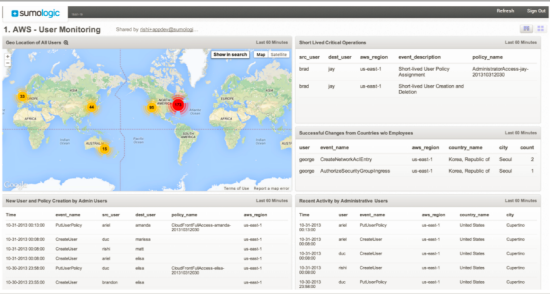
CloudTrail Partners
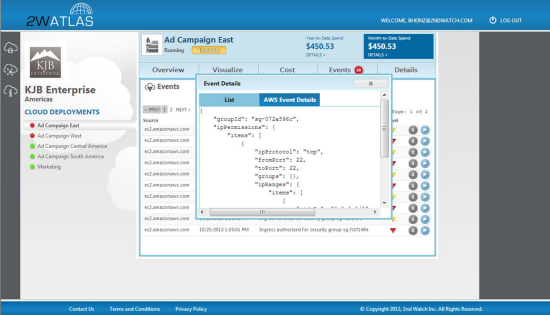
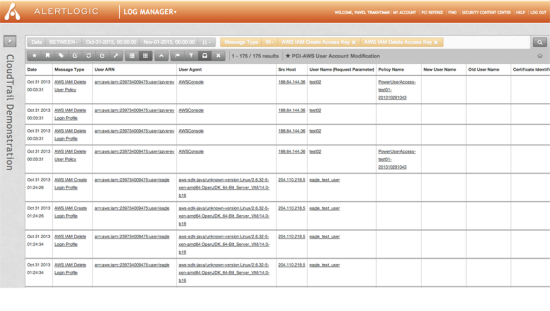
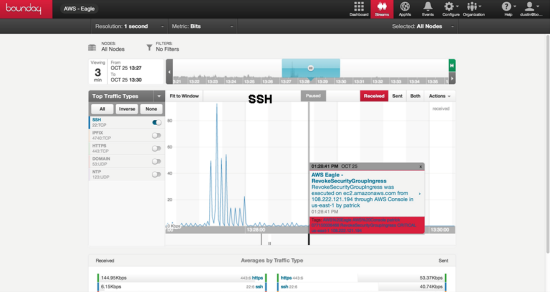
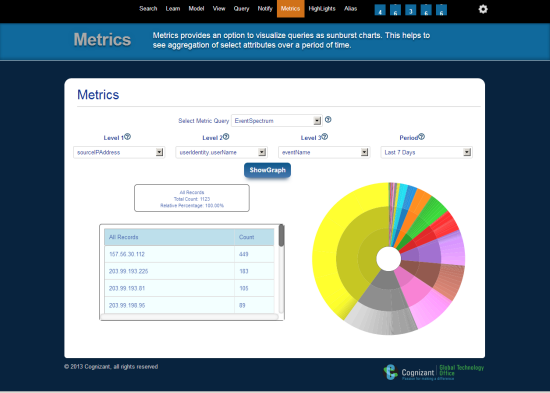
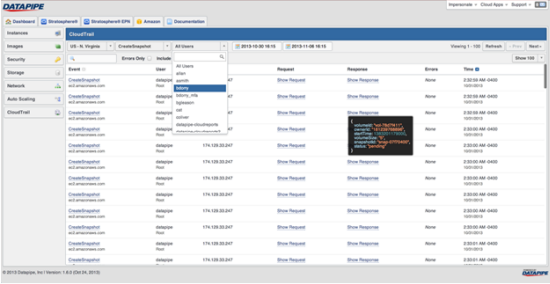
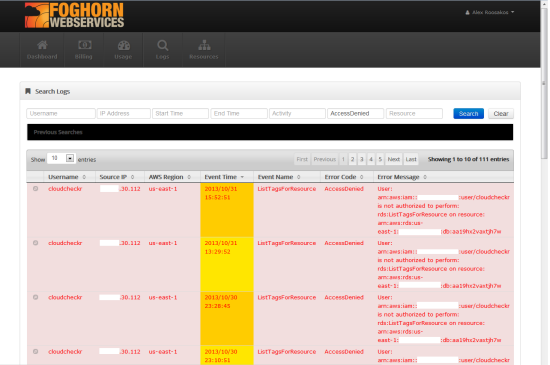
We have been working with partners to make sure that you have access to a wide variety of analytics tools for your CloudTrail logs. Here are some screen shots from some of these tools (visit the CloudTrail Partner Page for more information):
2nd Watch
Alert Logic
Boundary
Cognizant
Datapipe
Foghorn Consulting
Loggly
Stackdriver
Splunk
Sumo Logic
Blaze a Trail
CloudTrail is available now in the US East (Northern Virginia), and US West (Oregon) Regions. We’ll be adding support for additional Regions as quickly as possible.
— Jeff;
