AWS for Industries
Turning TR-069 bulk data into insights with AWS IoT Core and analytics services on AWS
Communications service providers (CSPs) often manage millions of customer premises equipment devices (CPEs) to provide services to their customers. These devices come in different types depending on the underlying communications technologies. Cable modems and xDSL modems, set-top boxes, and wireless routers are some examples of equipment types we see in customer environments.
To manage those devices, many CSPs use Broadband Forum’s TR-069 protocol (also known as CPE WAN Management Protocol, or CWMP). This protocol allows a standardized way of managing CPE operations across different types of CPEs, allowing CSPs to reuse the management plane across different types of devices via a management software called Auto Configuration Server (ACS). There are many ACS vendors who have successfully implemented the protocol and provided services to CSPs to manage their device fleets effectively.
The first versions of the TR-069 protocol did not define a dedicated way of collecting device telemetry information. In those early days, protocol-defined operations like GetParameterValues or periodic informs were used to collect some telemetry data from device agents at certain intervals by the ACSs. This way of data collection, however, brought scalability issues, especially for the device fleets that had millions of devices. Seeing the problem, Broadband Forum introduced a new way of collecting device telemetry information called bulk data collection and included it in TR-069 specification’s latest versions.
The bulk data collection feature creates an out-of-band data collection channel from the device and targets to send telemetry information to another entity other than ACS. This approach brings segregation of concerns and separates configuration management from performance management, allowing these functions to scale independently.
Last November, AWS published a TR-069 and AWS reference architecture, showcasing how AWS services can be used to collect telemetry data from devices to generate insights from them.
In this blog post, I’ll explain common CPE telemetry data use cases we see in the industry and show an implementation of the TR-069 and AWS reference architecture that addresses these use cases.
Approach
There are some common use cases where the CPE telemetry data can be used by the CSPs. In this blog, I will explain five of these use cases and how they can be addressed with a TR-069 bulk data processing on AWS solution:
- Real-time dashboards
- Heartbeat detection
- Anomaly detection and closed-loop automation
- Predictive maintenance
- Historical data analysis and reporting
In the following sections, I describe these use cases and introduce a proposed AWS architecture that addresses them.
Real-time dashboards
Real-time dashboards are typically listed as the first requirement for bulk data collection projects. These dashboards allow displaying the raw or processed data as soon as possible after the ingestion. Real-time dashboards allow operations personnel to visualize the real-time raw metrics as well as derived metrics to support operations and troubleshooting.
Heartbeat detection
Heartbeat detection allows CSPs to detect the devices that are offline. This detection can be implemented in several ways. With bulk data collection over HTTPS, a stateful streaming analytics application is typically used to track if a particular device has sent data within a defined time frame. In some implementations, real-time dashboarding software can also be used to detect the missing heartbeats from devices. If bulk data collection is implemented over MQTT, device disconnects can be detected immediately as there is a consistent connection between the device and the MQTT broker.
Anomaly detection and closed-loop automation
Anomaly detection is another common use case for telemetry data processing. Certain metrics such as CPU utilization, memory utilization, or throughput can be used to create baselines, and the system can create alerts in situations where the current readings deviate from the baseline. For detecting some point anomalies that do not require an ML-based approach, simple threshold-based checks are also effective. Detection of an increasing error rate on an interface is an example of these kinds of anomalies.
Once the anomaly is detected, an action should be taken to fix it. If the anomaly requires manual action, it is typically converted to an alarm or trouble ticket at the CSP’s operations support systems (OSS) to be tracked and managed. If the anomaly can be solved by an automated action (like a device reboot or changing the Wi-Fi channel), it can be attempted to be fixed in a closed-loop fashion. In this setup, the data collection system typically triggers the configuration management platform (ACS) to initiate a corrective action on the problematic device. Closed-loop automations work in near real time.
Predictive maintenance
Predictive maintenance aims to solve problems before they happen. For example, continuously monitoring the battery voltage levels of a battery-backed device can identify battery issues before they lead to downtime. Predictive maintenance analysis generally requires historical data, is not real-time, and can be run in batches. Avoidable truck rolls may bring a lot of cost savings for CSPs while increasing customer experience.
Historical data analysis and reporting
Historical reporting is another common use case. Historical device data can be used to train machine learning models for ML-based use cases I mentioned above. Another usage of it is troubleshooting customer problems. For example, a customer can call the contact center and complain about a recurring performance problem that is occurring at certain times of the week. Identifying the root cause of the customer’s problem may not be possible without analyzing the historical data. Historical data analysis is also used for exploratory data analysis purposes. Devices often emit hundreds of metrics. Identifying which one of these can be used to solve the mentioned use cases or to come up with new use cases, requires exploring the raw data available on hand.
Solution
The following solution architecture will be used to collect CPE data and analyze it to cover the above use cases. As I mentioned earlier, this architecture is an implementation of the reference architecture. Depending on the use cases you want to address, your implementation can be simpler, more complex, or can use some other AWS services.

In the following sections, I break down the proposed architecture into subsections and organize the sections by business use cases after I explain the common steps of device configuration, data ingestion and data filtering, normalization, and enrichment.
Device configuration
The very first step in TR-069-based bulk data collection is to enable a bulk data profile on a device. Bulk data profile is a part of TR-098 or TR-181 data models and needs to be configured by the ACS. A bulk data profile includes connection parameters like bulk data collector URL, protocol, port, authentication information and so on. Bulk data profile also includes which metrics from the data model will be collected and sent to a collector.
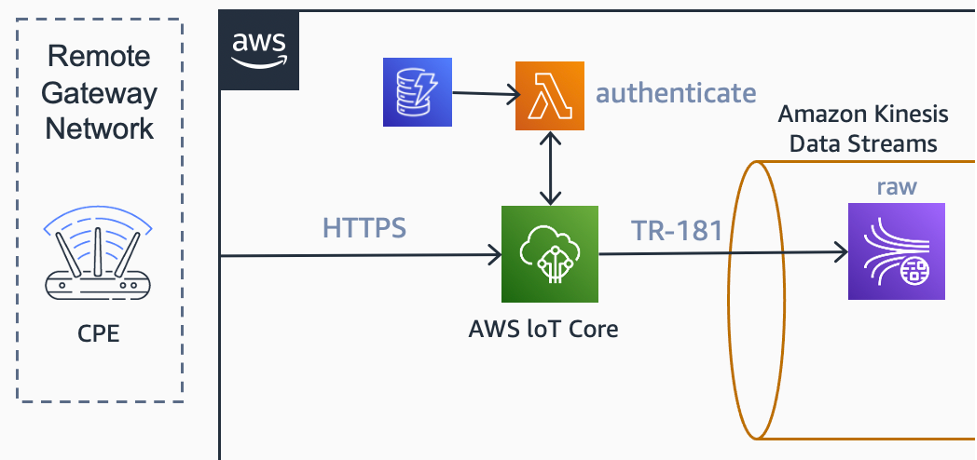
In this example, I am using the HTTPS POST-based bulk data collection mechanism. In this scenario, the CPE fleet is configured to send bulk data parameters to an AWS IoT Core HTTPS endpoint at specific intervals.
Data ingestion
For the data ingestion, AWS IoT Core is used. AWS IoT Core has the option to use an AWS Lambda function as a custom authorizer for its HTTP-based endpoint. AWS Lambda, backed by a table at Amazon DynamoDB, is used to collect and validate username and password information from the HTTP headers.
Since data ingestion is over HTTP only, AWS IoT Core’s Basic Ingest functionality is also used. This functionality allows us to bypass the message broker from the ingestion path, which allows a more cost-effective data flow.
A rule on AWS IoT rules engine delivers the raw messages to Amazon Kinesis Data Streams. A dedicated raw stream is used to collect and retain these messages.
Data filtering, normalization, and enrichment
An Apache Flink-based stream analytics application running on Amazon Kinesis Data Analytics continuously fetches new messages from the raw data stream. This application filters, normalizes, and converts the raw JSON payload into the internal canonical data model that will be used by downstream processors.
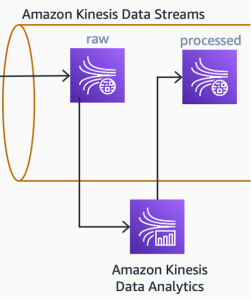
The Kinesis Data Analytics application also enriches the data. Often, we will find counter typed metrics inside the raw payload. Metrics like BytesSent, BytesReceived are counters that continuously increase on the device side. To use these types of metrics in analytics, we need to process them and create derived metrics from them. Inbound throughput, for example, can be calculated from two consecutive BytesReceived data points and the time interval between them.
Once the data is enriched with derived metrics, it can be written to another stream: processed stream. This stream will be an input for the first downstream use case: real-time dashboards.
Use case 1: Real-time dashboards
The first use case I explained earlier was real-time dashboards. In the proposed architecture, I am using Amazon Managed Grafana to address dashboarding needs. I am using an AWS Lambda function to read incoming data from the processed stream and writing it to Amazon Timestream. Amazon Timestream holds the timeseries information, which can be fetched from Amazon Managed Grafana dashboards via its plugin.

An Amazon Managed Grafana dashboard can display many details, depending on customer requirements. Aggregations such as MIN, MAX, AVG can be done at the dashboard level against wider timespans. Amazon Managed Grafana dashboards will also allow you to set thresholds against metrics and display alarms when these thresholds are breached.
Use case 2: Heartbeat detection
In the proposed architecture, the same Kinesis Data Analytics application is also used to detect missing heartbeats in the incoming stream, as it will not have separate scalability requirements, and I assumed a single team will be maintaining it. If, in your environment, this is not the case, it should be designed as a separate application reading from the raw or processed streams. This also applies to future use cases that will be defined in this blog post.
Since Apache Flink is a stateful stream processing platform, it can be used to maintain a state for a particular device. Within this state object, I can save the last seen timestamp of the device and use application timers to detect when a device misses a configurable number of time intervals. Once a heartbeat-missing condition is detected, the application emits an alarm event to another stream, heartbeat-alarms.
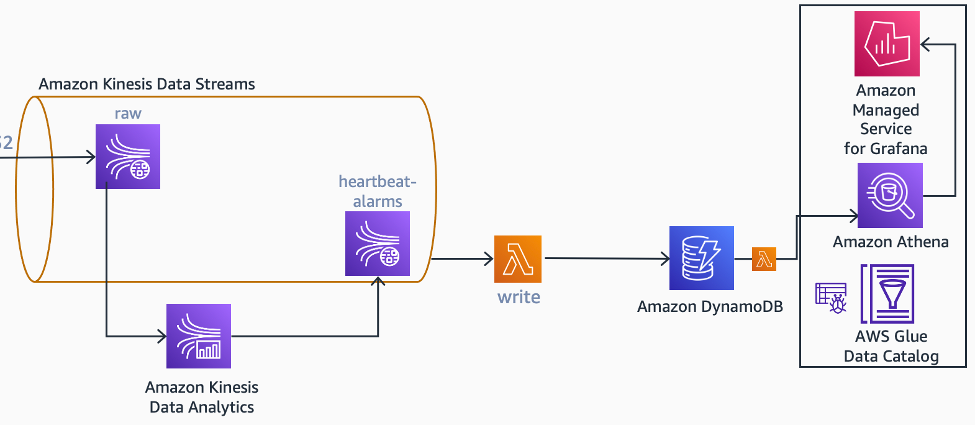
The same Kinesis Data Analytics application emits another event, alarm clear, to the same stream when the device comes back online. Alarm and alarm clear events are collected by an AWS Lambda function that maintains a heartbeat-missing-devices table in Amazon DynamoDB.
There may be a need to display this information in a dashboard as well. In the proposed architecture, the Amazon Managed Grafana dashboard uses Amazon Athena to pull information from this table.
Use case 3: Anomaly detection and closed-loop automation
As mentioned earlier, there are several ways to detect anomalies with metrics. Threshold-based anomaly detection can be used over individual data elements or time window-based aggregates. A Kinesis Data Analytics application can also do machine learning-based real-time anomaly detection via random cut forest-based detection or by calling a pre-trained Amazon SageMaker inference endpoint.
Regardless of the mechanism used, detected anomalies can be used to trigger self-healing automations with or without human approval.
In the proposed architecture, a point anomaly, detected by a simple threshold on an error metric, triggers a self-healing mechanism with user approval.
In this sub-architecture, the flow of events starts with the Kinesis Data Analytics application publishing an anomaly detection event to an Amazon SNS topic. This event includes the ID of the device that is experiencing the anomaly. When the event is received by Amazon SNS, it invokes a Lambda function. The Lambda function queries a DynamoDB table with the device ID to find the owner information of that device. Once the owner information is located, the Lambda function then fetches the phone number and sends the owner an SMS through Amazon Pinpoint and asks for a consent to reboot their device.

Amazon Pinpoint uses its two-way SMS functionality to collect the user’s response and delivers it to an Amazon SNS topic. This topic passes the information to an Amazon SQS FIFO queue, which is polled by another Lambda function. The Lambda function writes the owner’s response to a DynamoDB table and, if the response is positive, invokes another Lambda function. It then interacts with ACS’s northbound interface (NBI) to reboot the device.
Different anomalies require different self-healing mechanisms. Analyzing current troubleshooting mechanisms and their triggers will help find the candidate problems for self-healing scenarios.
Use cases 4 and 5: Historical data analysis, reporting, and predictive maintenance
Historical device data can play an important role in addressing historical data analysis and reporting use cases. This data can also be used to train machine learning algorithms to detect anomalies and do predictive maintenance activities.
Ingesting telemetry data from millions of devices with collection intervals in the minutes ranges brings scalability challenges, especially on the storage side. Amazon S3, with its virtually unlimited scalability and cost-effective characteristics, is a service that can be used to store the telemetry data, and is therefore chosen for the proposed architecture.
The raw and processed data in Amazon Kinesis Data Streams is copied to the raw and processed buckets, respectively. The copy operation is done by Amazon Kinesis Data Firehose. Kinesis Data Firehose organizes the data into a YYYY/MM/DD/HH folder structure at the S3 side by automatically adding prefixes. Since the processed data will be directly queried from Amazon Athena, Amazon Kinesis Data Firehose also converts the data into Parquet format for optimized and cost-effective reads. For both raw and processed buckets, Amazon S3 lifecycle policies are in effect, moving objects from Amazon S3 Standard storage class to colder storage classes after a specified retention period.
One common requirement I hear from our customers and partners is to bring ACS resident data close to the telemetry data. Generally, TR-069 bulk telemetry data does not include device metadata like location information, device capabilities, and other inventory information that is relatively static.
The ACS’s data can be imported into Amazon S3 as well and joined with telemetry data within the SQL queries issued from Amazon Athena. The data can also be used by the streaming analytics applications to do stream enrichment. In the proposed architecture, I used AWS Database Migration Service (AWS DMS) for metadata capturing from ACS databases. AWS DMS supports many SQL and NoSQL database engines like Oracle, MS SQL Server, and MongoDB. With its continuous migration and change data capture (CDC) capabilities, it can capture changes from ACS’s database and insert them into Amazon S3 in a near real-time fashion. Once the data lands at Amazon S3, an AWS Glue job further transforms it from Amazon DMS output format into a common, read-optimized format.

Conclusion
In this blog, I defined some of the common use cases of CPE telemetry data. I showed you how TR-069 bulk data collection can be used in conjunction with different AWS services for ingestion and analytics with a sample AWS architecture.
The use of serverless AWS services allows you to scale out seamlessly as your CPE fleets grow as well as reducing your management costs.
You can explore TR-069 and AWS reference architecture and implement it to solve your CPE bulk data collection challenges.
You can also visit Telecommunications on AWS to learn about how CSPs reinvent communication with AWS.