AWS Big Data Blog
Harmonize, Search, and Analyze Loosely Coupled Datasets on AWS
September 8, 2021: Amazon Elasticsearch Service has been renamed to Amazon OpenSearch Service. See details.
You have come up with an exciting hypothesis, and now you are keen to find and analyze as much data as possible to prove (or refute) it. There are many datasets that might be applicable, but they have been created at different times by different people and don’t conform to any common standard. They use different names for variables that mean the same thing and the same names for variables that mean different things. They use different units of measurement and different categories. Some have more variables than others. And they all have data quality issues (for example, badly formed dates and times, invalid geographic coordinates, and so on).
You first need a way to harmonize these datasets, to identify the variables that mean the same thing and make sure that these variables have the same names and units. You also need to clean up or remove records with invalid data.
After the datasets are harmonized, you need to search through the data to find the datasets you’re interested in. Not all of them have records that are relevant to your hypothesis, so you want to filter on a number of important variables to narrow down the datasets and verify they contain enough matching records to be significant.
Having identified the datasets of interest, you are ready to run your custom analyses on the data they contain so that you can prove your hypothesis and create beautiful visualizations to share with the world!
In this blog post, we will describe a sample application that illustrates how to solve these problems. You can install our sample app, which will:
- Harmonize and index three disparate datasets to make them searchable.
- Present a data-driven, customizable UI for searching the datasets to do preliminary analysis and to locate relevant datasets.
- Integrate with Amazon Athena and Amazon QuickSight for custom analysis and visualization.
Example data
The Police Data Initiative seeks to improve community and law enforcement relations through the public availability of data related to police activity. Datasets from participating cities, available through the Public Safety Open Data Portal, have many of the problems just outlined. Despite the commonality of crime and location metadata, there is no standard naming or value scheme. Datasets are stored in various locations and in various formats. There is no central search and discovery engine. To gain insights and value from this data, you have to analyze datasets city by city.
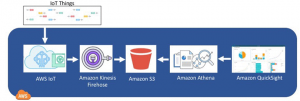
Although the focus of this post is police incident data, the same approach can be used for datasets in other domains, such as IoT, personalized medicine, news, weather, finance, and much more.
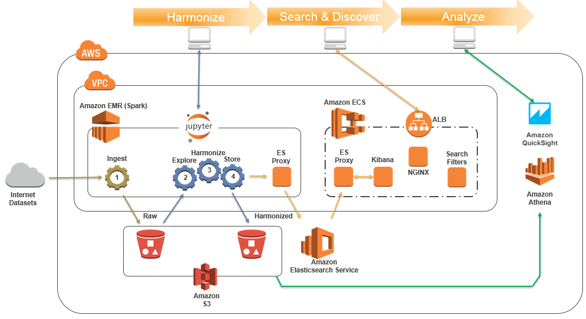
Architecture
Our architecture uses the following AWS services:
- Amazon EMR (with Apache Spark and Jupyter notebooks) to explore, clean, harmonize (transform), describe, and save multiple, loosely coupled datasets.
- Amazon S3 to store both raw and harmonized datasets.
- Amazon OpenSearch Service to host secure, searchable indexes of selected dataset variables and the associated dictionary/metadata used to power the search web page.
- Amazon EC2 Container Service (ECS) to host a web-based search UI.
- Amazon Athena and Amazon QuickSight to provide analysis and reporting.
- AWS CodeBuild and AWS CodePipeline to build and deliver the search UI application on ECS.
- AWS Identity and Access Management (IAM) policies and instance roles allow least-privilege access to Amazon ES from the UI containers and from the EMR cluster.
- AWS CloudFormation to orchestrate the provisioning of the environment.
The diagram below illustrates the solution architecture:
Install and configure the sample solution
Use this CloudFormation button to launch your own copy of the sample application in AWS region us-east-1:
![]()
NOTE: We have tested the solution in AWS region us-east-1. To deploy in a different region you must first fork our GitHub repository and review the README.md file to learn how to publish the solution templates and source code to your own S3 artifact bucket in your desired region. When selecting a region other than us-east-1, please first reference the Region Table to verify that your region supports both Amazon Athena and Amazon Quicksight.
The source code is available in our GitHub repository.
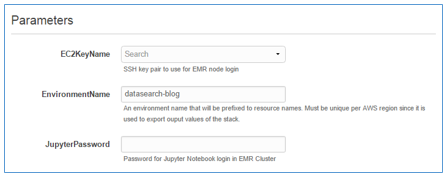
Enter an EC2 key pair and a password you will use to access Jupyter notebooks on your new EMR cluster. (You can create a key pair in the EC2 console.)
The master CloudFormation stack uses several nested stacks to create the following resources in your AWS account:
- VPC with public and private subnets in two Availability Zones.
- Amazon ES domain (2 x t2.small master nodes and 2 x t2.small data nodes) to store indexes and process search queries. Cost approx. $0.12/hr.
- S3 bucket for storing datasets and EMR logs.
- EMR cluster (1 x m4.2xlarge master node, 2 x m4.2xlarge core nodes) with Apache Spark, Jupyter Notebooks, and the aws-es-kibana proxy server (courtesy of santthosh) to sign Elasticsearch service requests. Cost approx. $1.80/hr.
- ECS cluster (2 x t2.large nodes) and tasks that run the search and discover web service containers and the aws-es-kibana proxy server to sign Amazon ES requests. Cost approx. $0.20/hr.
- IAM roles with policies to apply least-privilege principles to instance roles used on ECS and EMR instances.
You will be billed for these resources while they are running. In the us-east-1 region, expect to pay a little more than $2 per hour.
The EMR cluster is the most significant contributor to the compute cost. After you have harmonized the datasets, you can terminate the EMR cluster because it’s used only for harmonization. You can create a new cluster later when you need to harmonize new data.
It can take between 30-60 minutes for CloudFormation to set up the resources. When CREATE_COMPLETE appears in the Status column for the main stack, examine the Outputs tab for the stack. Here you will find the links you need to access the Jupyter harmonization notebooks and the dataset search page UI.

Harmonize sample datasets
- Launch the Jupyter Notebook UI with the JupyterURL shown on the Outputs tab.
- Type the password you used when you launched the stack.
- Open the datasearch-blog folder:
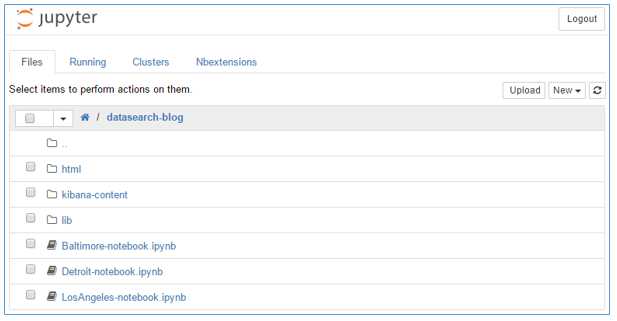
Here you see the harmonization notebooks for the three cities we use to illustrate the sample app: Baltimore, Detroit, and Los Angeles. The lib folder contains Python classes used to abstract common indexing and harmonization methods used by the harmonization notebooks. The html folder contains read-only HTML copies of each notebook created and published during notebook execution. The kibana-content folder holds the definitions for the default search dashboard pane and scripts for importing and exporting the dashboard to and from Amazon OpenSearch Service.
Now you’re ready to run the harmonization notebooks.
- Click Baltimore-notebook.ipynb to open the Baltimore notebook. To modify the sample to work with different datasets or to implement additional features, you need to understand how these files work. For now, we’ll just run the three sample notebooks to download and harmonize some datasets.
You can use Show/Hide Code to toggle the display of cells that contain Python code.
- From the Cell menu, choose Run All to run the notebook:
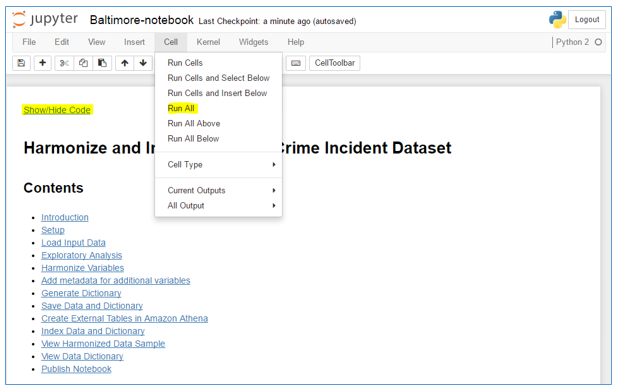
You can see the execution progress by monitoring the cells in the notebook. As each cell completes execution, output is displayed under the cell. The Notebook Execution Complete message appears at the bottom of the notebook:

At this point, the dataset for Baltimore has been downloaded and stored in S3. The data has been harmonized and a dictionary was generated. The dataset and the dictionary were stored in Elasticsearch indexes to power the search page and in S3 to facilitate later detailed analysis.
- Scroll through the sections in the notebook and read the embedded documentation to understand what it’s doing. The sample code is written in Python using the PySpark modules to leverage the power of Apache Spark running on the underlying EMR cluster.
PySpark allows you to easily scale the technique to process much larger datasets. R, Scala, and other languages can also be supported, as described in Tom Zeng’s excellent blog post, Run Jupyter Notebook and JupyterHub on Amazon EMR.
- To complete the sample dataset harmonization processes, open and execute the other two city notebooks, Detroit-notebook.ipynb and LosAngeles-notebook.ipynb.
Note: If you’d like to explore our sample harmonization notebooks without installing the application, you can browse them here: Baltimore-notebook, Detroit-notebook, LosAngeles-notebook.
Search and discovery
Now that the police incident datasets have been harmonized and indexed into Amazon OpenSearch Service, you can use the solution’s search and discovery UI to visualize and explore the full set of combined data.
Page layout
Launch the search UI using the SearchPageURL on the Outputs tab of the CloudFormation stack.
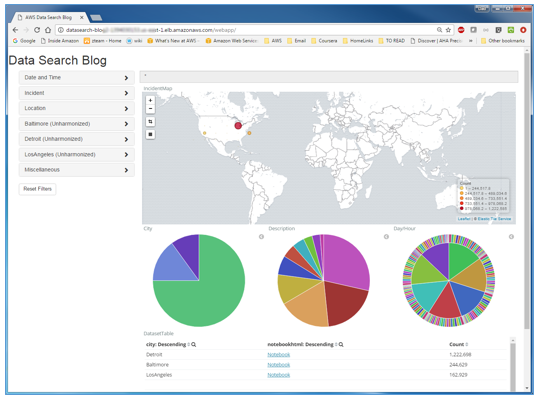
The search page has two components:
- An embedded Kibana dashboard helps you visualize aggregate information from your datasets as you apply filters:
- The sample dashboard is designed for the harmonized police incident datasets, but you can easily implement and substitute your own dashboards to provide alternative visualizations to support different datasets and variables.
- You can interact with the dashboard elements to zoom in on the map views and apply filters by selecting geographic areas or values from the visualizations.
- A filter sidebar with accordion elements shows groups of variables that you can use to apply filters to the dashboard:
- The filter sidebar is built dynamically from the dictionary metadata that was indexed in Amazon OpenSearch Service by the harmonization process.
- Use Jupyter to examine the lib/harmonizeCrimeIncidents.py file to see how each harmonized variable is associated with a vargroup, which is used to group associated variables into the accordion folders in the UI. Variables that aren’t explicitly assigned are implicitly assigned to a default vargroup. For example, the accordion labelled Baltimore (Unharmonized) is the default group for the Baltimore dataset. It contains the original dataset variables.
Filter sidebar components
The filter sidebar code dynamically chooses the UI component type to use for each variable based on dictionary metadata. If you look again at the code in lib/harmonizeCrimeIncidents.py, you will see that each harmonized variable is assigned a type that determines the UI component type. Variables that aren’t explicitly typed by the harmonization code are implicitly assigned a type when the dataset dictionary is built (based on whether the variable contains strings or numbers) and on the distribution of values.
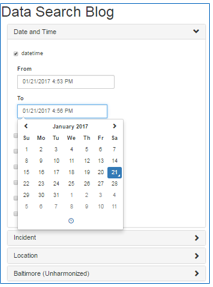
In the filter sidebar, open the Date and Time accordion. Select the datetime check box and click in the From or To fields to open the date/time calendar component:
Select the dayofweek check box to see a multi-valued picklist:

Other variable types include:
Ranges:

Boolean:

Text (with as-you-type automatic suggestions):

Take some time to experiment with the filters. The dashboard view is dynamically updated as you apply and remove filters. The count displayed for each dataset changes to reflect the number of records that match your filter criteria. A summary of your current filters is displayed in the query bar at the top of the dashboard.
Dataset documentation/transparency
The example dashboard provides Notebook links for each dataset:

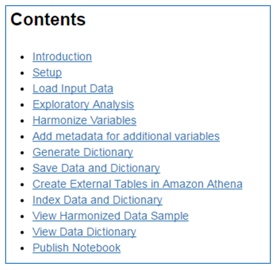
Click the Notebook link for Baltimore to open a browser tab that displays a read-only copy of the Baltimore notebook. Examine the sections listed in Contents:
Use this mechanism to document your datasets and to provide transparency and reproducibility by encapsulating dataset documentation, harmonization code, and output in one accessible artifact.
Search example
Let’s say your hypothesis relates specifically to homicide incidents occurring on weekends during the period 2007-2015.
Use the search UI to apply the search filters on dayofweek, year, and description:

You’ll see the city of Detroit has the largest number of incidents matching your criteria. Baltimore has a few matching records too, so you may want to narrow in on those two datasets.
Analyze
Having used the search UI to locate datasets, you now need to explore further to create rich analyses and custom visualizations to prove and present your hypothesis.
There are many tools you can use for your analysis.
One option is to use Kibana to build new queries, visualizations, and dashboards to show data patterns and trends in support of your hypothesis.
Or you could reuse the harmonization (Jupyter on EMR/Spark) environment to create new Jupyter notebooks for your research, leveraging your knowledge of Python or R to do deep statistical and predictive analytics on the harmonized dataset stored in S3. Create beautiful notebooks that contain your documentation and code, with stunning inline visualizations generated by using libraries like matplotlib or ggplot2.
Two recently launched AWS analytics services, Amazon Athena and Amazon QuickSight, provide an attractive, serverless option for many research and analytics tasks. Let’s explore how you can use these services to analyze our example police incident data.
Amazon Athena
Open the Amazon Athena console in region us-east-1. From DATABASE, choose incidents. You’ll see the tables for our datasets are already loaded into the Athena catalog. Choose the preview icon for any of these tables to see some records.

How did the tables for our datasets get loaded into the Athena catalog? If you explored the harmonization notebooks, you may know the answer. Our sample harmonization notebooks save the harmonized datasets and dictionaries to S3 as Parquet files and register these datasets as external tables with the Amazon Athena service using Athena’s JDBC driver (example).
Amazon QuickSight
Amazon QuickSight can use Athena as a data source to build beautiful, interactive visualizations. To do this:
- Open and sign in to the QuickSight console. If this is your first time using QuickSight, create an account.
Note: Your QuickSight account must have permissions to access Amazon Athena and the S3 bucket(s) where your harmonized datasets are stored.
- Follow the steps in the console to create an Athena data source.
- After the data source is created, choose the incidents database, and then choose Edit/Preview data:

- Build a custom query to combine the separate harmonized city datasets into a single dataset for analysis. Open the Tables accordion and click Switch to Custom SQL tool:

- The following example combines the harmonized variables datetime, city, and description from all three of our sample datasets:

- Explore the data preview, modify the analysis label, then choose Save and Visualize to store your dataset and open the visualization editor:

- Select datetime and description to display a default visualization that shows incident counts over time for each incident description:

Take some time to explore QuickSight’s features by building visualizations, stories, and dashboards. You can find tutorials and examples in the QuickSight UI and in other blog posts.
Customization
This post and the companion sample application are intended to illustrate concepts and to provide you with a framework you can customize.
Code repository and continuous build and deployment
The sample solution installs a pipeline in AWS CodePipeline in your account. The pipeline monitors the source code archive in the aws-big-data-blog S3 bucket (s3://aws-bigdata-blog/artifacts/harmonize-search-analyze/src.zip). Any changes to this source archive will trigger AWS CodePipeline to automatically rebuild and redeploy the UI web application in your account.
Fork our GitHub repository and review the README.md file to learn how to create and publish the solution templates and source code to your own S3 artifact bucket.
Use CloudFormation to launch the solution master stack from your new S3 bucket and verify that your pipeline now monitors the source code archive from your bucket.
You are ready to start customizing the solution.
Customize harmonization
Using the examples as a guide, harmonize and index your own datasets by creating your own Jupyter notebooks. Our sample notebooks and Python classes contain embedded notes and comments to guide you as you make changes. Use the harmonization process to control:
- Variable names
- Variable values, categories, units of measurements
- New variables used to create searchable dataset tags
- New variables to enrich data
- Data quality checks and filters/corrections
- The subset of variables that are indexed and made searchable
- How variables are grouped and displayed on the search UI
- The data dictionary used to describe variables and preserve data lineage
- Dataset documentation, publish and make accessible from search UI
Customize search UI
Customize the web search UI dashboard to reflect the variables in your own datasets and embed/link the dashboard page into your own website.
The main search page panel is an embedded Kibana dashboard. You can use Kibana to create your own customized dashboard, which you can link to the search page by editing ./services/webapp/src/config.js to replace the value of dashboardEmbedUrl.
The filter sidebar is a Bootstrap Javascript application. You won’t need to modify the sidebar code to handle new datasets or variables because it is fully data-driven from the dataset dictionary indexes saved to Amazon OpenSearch Service during harmonization.
For more information about how to build and test the web UI, see the README.md file in our GitHub repository.
Integration with other AWS services
Consider using the recently launched Data Lake Solution on AWS to create a data lake to organize and manage your datasets in S3. The APIs can be used to register and track your harmonized datasets. The solution’s console can be used to manage your dataset lifecycles and access control.
Use Amazon CloudWatch (logs, metrics, alarms) to monitor the web UI container logs, the ECS cluster, the Elasticsearch domain, and the EMR cluster.
You might also want to store your harmonized datasets into an Amazon Redshift data warehouse, run predictive analytics on harmonized variables using Amazon Machine Learning, and much more. Explore the possibilities!
Cleanup
You will be charged an hourly fee while the resources are running, so don’t forget to delete the resources when you’re done!
- Delete the master datasearch-blog CloudFormation stack
- Use the S3 console to delete the S3 bucket: datasearch-blog-jupyterspark
- Use the Athena console to manually delete the incidents database
- Finally, use the QuickSight console to remove the data source and visualization that you created to analyze these datasets
Summary
In this blog post, we have described an approach that leverages AWS services to address many of the challenges of integrating search and analysis across multiple, loosely coupled datasets. We have provided a sample application that you can use to kick the tires. Try customizing the approach to meet your own needs.
If you have questions or suggestions, please leave your feedback in the comments. We would love to hear from you!
About the Authors
 Oliver Atoa and Bob Strahan are Senior Consultants for AWS Professional Services. They work with our customers to provide leadership on a variety of projects, helping them shorten their time to value when using AWS.

 Ryan Jancaitis is the Sr. Product Manager for the Envision Engineering Center at AWS. He works with our customers to enable their cloud journey through rapid prototyping and innovation to solve core business challenges.
Related