AWS Partner Network (APN) Blog
How to Get Logs from Amazon S3 Using Filebeat and Metricbeat in Elastic Stack
By Antony Prasad Thevaraj, Partner Solutions Architect, Data & Analytics – AWS
By Kiran Randhi, Sr. Partner Management Solutions Architect – AWS
By Hemant Malik, Principal Solutions Architect – Elastic
 |
When you use Amazon Simple Storage Service (Amazon S3) to store corporate data and host websites, you need additional logging to monitor access to your data and the performance of your applications. An effective logging solution enhances security and improves detection of security incidents.
You can rely on Amazon S3 for a range of use cases while simultaneously looking for ways to analyze your logs to ensure compliance, perform the audit, and discover risks.
Amazon S3’s server access logging feature captures and monitors the traffic from the application to your S3 bucket at any time, with detailed information about the source of the request. The logs are stored in the S3 bucket you own in the same AWS Region, and this addresses the security and compliance requirements of most organizations.
Logs are critical for establishing baselines, analyzing access patterns, and identifying trends. For example, they could answer a financial organization’s question about how many requests are made to a bucket and who is making certain types of access requests to the objects.
Logs from multiple AWS services are stored in Amazon S3. For example, you can configure Amazon Simple Queue Service (SQS) and Amazon Simple Notification Service (SNS) to store logs in Amazon S3. In addition, there are Amazon S3 server access logs, Elastic Load Balancing access logs, Amazon CloudWatch logs, and virtual private cloud (VPC) flow logs.
All of these provide customers with useful information, but unfortunately there are multiple .txt files for operations being generated every second or minute. This can make it difficult to see exactly what operations are recorded in the log files without opening every single .txt file separately.
Additionally, Amazon S3 server access logs are recorded in a complex format, making it hard for users to just open the .txt file and find the information they need.
Fortunately, all of your AWS logs can be indexed, analyzed, and visualized with the Elastic Stack, letting you utilize all of the important data they contain. In this post, we’ll walk you through how to set up the Elastic beats agents and configure your Amazon S3 buckets to gather useful insights about the log files stored in the buckets using Elasticsearch Kibana.
Solution Overview
Elastic is an AWS ISV Partner that helps you find information, gain insights, and protect your data when you run on Amazon Web Services (AWS). Elastic offers enterprise search, observability, and security that are built on a single, flexible technology stack that can be deployed anywhere.
Search is foundation of Elastic, which started with building an open search engine that delivers fast, relevant results at scale. Elastic Cloud enables fast time to value for users where creators of Elasticsearch run the underlying Elasticsearch Service, freeing users to focus on their use case.
Beats in Elastic stack are lightweight data shippers that provide turn-key integrations for AWS data sources and visualization artifacts. Beats support a backpressure-sensitive protocol when sending data to accounts for higher volumes of data. Beats can leverage the Elasticsearch security model to work with role-based access control (RBAC).
Elasticsearch security provides built-in roles for Beats with minimum privileges. Roles and privileges can be assigned API keys for Beats to use. To establish secure communication with Elasticsearch, Beats can use basic authentication or token-based API authentication. Beats supports compression of data when sending to Elasticsearch to reduce network usage.
Filebeat offers a lightweight way to ship logs to Elasticsearch and supports multiple inputs besides reading logs including Amazon S3. Metricbeat is a lightweight metrics shipper that supports numerous integrations for AWS.
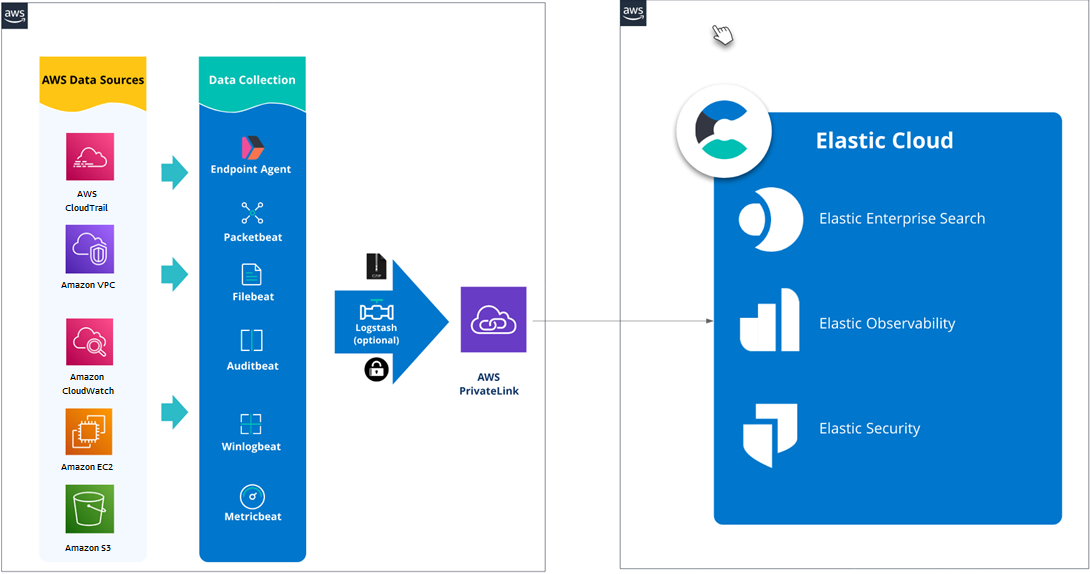
Figure 1 – AWS integrations provided by Elastic for observability, security, and enterprise search.
OLX is a customer who chose Elastic Cloud on AWS to keep their highly-skilled security team focused on security management and remove the additional work of managing their own clusters. OLX is one of the world’s fastest-growing networks of trading platforms and part of OLX Group, a network of leading marketplaces present in more than 30 countries.
OLX helps people buy and sell cars, find housing, get jobs, buy and sell household goods, and more. With more than 20 local brands including AutoTrader, Avito, OLX, Otomoto, and Property24, their solutions are built to be safe, smart, and convenient for customers.
The tools used by the security team at OLX had reached their limits. They couldn’t scale to capture the growing volume and variety of security-related log data that’s critical for understanding threats. The toolset was also complex to manage as separate items and created silos of security data.
The team wanted expanded visibility across their data estate in order to better protect the company and their users. They wanted interactive access to details, resulting in faster incident response and resolution. Protection of user and transaction data is critical to OLX’s ongoing business success. Buyer and seller trust in OLX’s trading platforms provides a service differentiator and foundation for growth.
The next question for OLX was whether they wanted to run the Elastic Stack themselves or have Elastic run the clusters as software-as-a-service (SaaS) with Elastic Cloud. As security practitioners, the team saw the value of having the creators of Elasticsearch run the underlying Elasticsearch Service, freeing their time to focus on security issues. The security team could then work on building the integrations with security data sources and using Elastic Security for threat hunting and incident investigation.
The time to value for their upgraded security solution within OLX would be significantly increased by choosing Elastic Cloud. To prove out this path, OLX opened an Elastic Cloud account through the Elastic Cloud listing on AWS Marketplace. OLX got started in a few minutes with billing flowing through their existing AWS account. OLX continued to prove out the solution with Elastic Cloud using this flexible, pay-as-you-go model.
The Elastic and AWS partnership meant that OLX could deploy Elastic Cloud in AWS regions where OLX already hosted their applications. Elastic’s pre-built integrations with AWS services made it easy to ingest data from AWS services via Beats.
Once the decision was made for Elastic Cloud on AWS, OLX decided to purchase an annual Elastic Cloud subscription through the AWS Marketplace private offers process, allowing them to apply the purchase against their AWS EDP consumption commit and leverage consolidated billing.
Some of the insights Elastic can collect for the AWS platform include:
- Leveraging Metricbeat and Amazon CloudWatch for fetching metrics, collecting log files, and setting alarms for resource utilization, application performance, and operational health on things such as:
- Metrics on billing, Amazon Elastic Compute Cloud (Amazon EC2), AWS Lambda, Amazon S3, usage, and more.
- Containers for Amazon Elastic Container Service (Amazon ECS), Amazon Elastic Kubernetes Service (Amazon EKS), AWS Fargate, and vanilla Kubernetes data.
- Application insights to monitor .NET and SQL Server on Windows and Linux.
- Leveraging Filebeat and Amazon S3 input to get log files from S3 buckets with SQS notifications from services that log to S3, including:
- VPC flow logs, Elastic Load Balancer access logs, AWS CloudTrail logs, Amazon CloudWatch, and EC2.
- Amazon S3 server access logs, including security audits and access logs, which are useful to help understand S3 access and usage charges.
- Leveraging Functionbeat as a serverless Lambda function to collect CloudWatch logs and events from SQS and Amazon Kinesis.
Almost all of the Elastic modules that come with Metricbeat, Filebeat, and Functionbeat have pre-developed visualizations and dashboards, which let customers rapidly get started analyzing data.
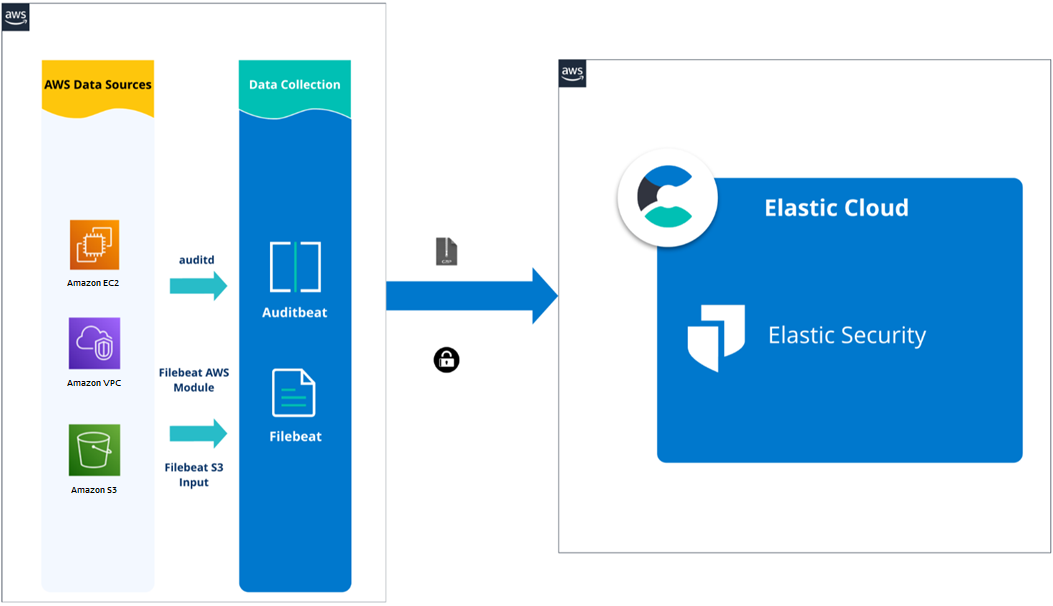
Figure 2 – Typical architecture when using Elastic Security on Elastic Cloud.
Prerequisites
For this example, you must have an AWS account, an Elastic Cloud account, and a role with sufficient access to create resources in the following services:
- Amazon S3
- Amazon SQS
Walkthrough
Please follow the below steps to implement this solution:
- Configure S3 event notifications using SQS.
- Install Elastic Filebeat
- Install Elastic Metricbeat
Configure S3 Event Notifications Using SQS
By following these four steps, you can add a notification configuration on a bucket requesting S3 to publish events of the s3:ObjectCreated:* type to an SQS queue. See the documentation to learn how to configure a bucket notification example walkthrough.
Step 1: Create an SQS Queue and S3 Bucket
Create an SQS queue and S3 bucket in the same AWS Region using Amazon SQS console.
Step 2: Configure an SQS Queue
Replace the access policy attached to the queue with the following queue policy:
Make sure to change the <sqs-queue-arn> and <bucket-name> to match your SQS queue Amazon Resource Name (ARN) and S3 bucket name.
Step 3: Configure S3 Bucket
Using the Amazon S3 console, add a notification configuration requesting S3 to publish events of the s3:ObjectCreated:* type to your SQS queue.
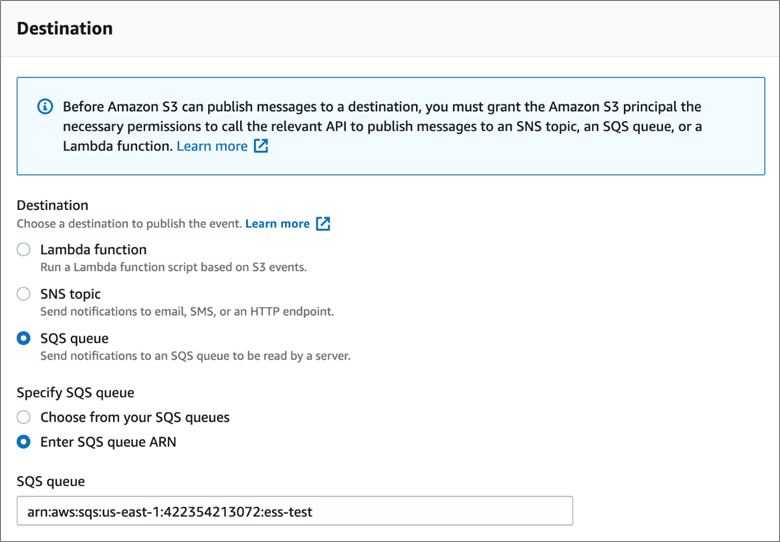
Figure 3 – Destination to publish notification for S3 events using SQS.
Step 4: Test S3-SQS Setup
Upload an object to the S3 bucket and verify the event notification in the Amazon SQS console.
Using the Filebeat S3 Input
By enabling Filebeat with Amazon S3 input, you will be able to collect logs from S3 buckets. Every line in a log file will become a separate event and are stored in the configured Filebeat output, like Elasticsearch. Using only the S3 input, log messages will be stored in the message field in each event without any parsing.
When processing an S3 object referenced by an SQS message, if half of the configured visibility timeout passes and the processing is still ongoing, then the visibility timeout of that SQS message will be reset to make sure the message doesn’t go back to the queue in the middle of the processing.
If there are errors happening during the processing of the S3 object, the process will be stopped and the SQS message will be returned back to the queue.
Step 1: Install Filebeat
To download and install Filebeat, there are different commands working for different systems. For example, with Mac:
Please see the Install Filebeat documentation for more details.
Step 2: Configure the s3 Input
Here’s an example of enabling S3 input in filebeat.yml:
With this configuration, Filebeat will go to the test-fb-ks SQS queue to read notification messages. From the messages, Filebeat will obtain information about specific S3 objects and use the information to read objects line by line.
visibility_timeout is the duration (in seconds) the received messages are hidden from subsequent retrieve requests after being retrieved by a ReceiveMessage request. By default, the visibility_timeout is 300 seconds. The minimum is 0 seconds and the maximum is 12 hours.
In order to make AWS API calls, Amazon S3 input requires AWS credentials in its configuration. In the example above, the profile name elastic-beats is given for making API calls. Please see AWS Credentials Configuration documentation for more details.
Step 3: Start Filebeat
For Mac and Linux:
Please see Start Filebeat documentation for more details.
Collecting S3 Server Access Logs Using the ‘s3access’ Fileset
In Filebeat 7.4, the s3access fileset was added to collect Amazon S3 server access logs using the S3 input. Server access logs provide detailed records for the requests that are made to a bucket, which can be very useful in security and access audits.
By default, server access logging is disabled. To track requests for access to your bucket, you can enable server access logging. Each access log record provides details about a single access request, such as the requester, bucket name, request time, request action, response status, and an error code, if relevant.
Step 1: Enable Server Access Logging
Under Properties in a specific S3 bucket, you can enable server access logging by selecting Enable logging.

Figure 4 – Enable server access logging for the S3 bucket.
Step 2: Enable AWS Module in Filebeat
In a default configuration of Filebeat, the AWS module is not enabled. The following command enables the AWS module configuration in the modules.d directory on MacOS and Linux systems:
Step 3: Configure AWS Module
By default, the s3access fileset is disabled. To enable it, please see aws.yml below:
Step 4: Start Filebeat
For Mac and Linux:
Please see the Start Filebeat documentation for more details.
Step 5: Using the Kibana ‘s3access’ Fileset Dashboard
The s3access fileset includes a predefined dashboard, called [Filebeat AWS] S3 Server Access Log Overview. By running the setup command when you start Metricbeat, you automatically set up these dashboards in Kibana.
For Mac and Linux:
For more information on this, please see the Set up the Kibana dashboards documentation. This dashboard is an overview of Amazon S3 server access logs and shows top URLs with their response code, HTTP status over time, and all of the error logs.
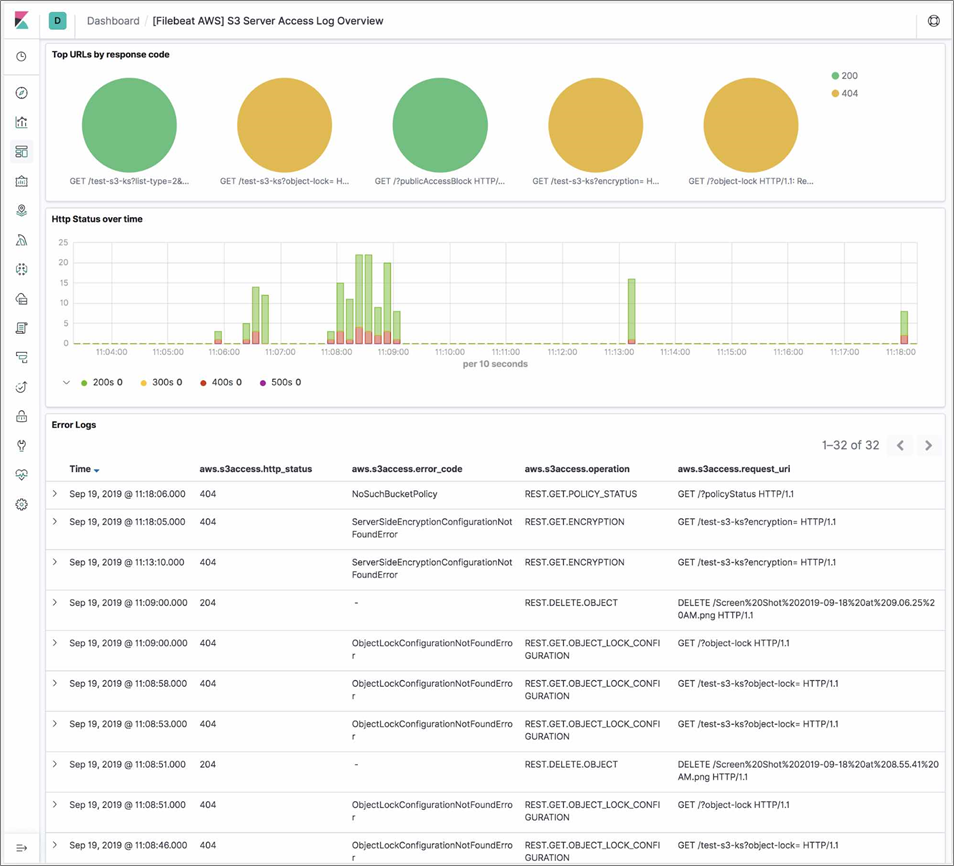
Figure 5 – Elastic Kibana dashboard.
You can follow the same steps and setup the Elastic Metricbeat in the same manner.
Conclusion
In this post, we described key benefits and how to use the Elastic Beats to extract logs stored in Amazon S3 buckets that can be indexed, analyzed, and visualized with the Elastic Stack.
With the Filebeat S3 input, users can easily collect logs from AWS services and ship these logs as events into the Elasticsearch Service on Elastic Cloud, or to a cluster running off of the default distribution.
Elastic offers flexible deployment options on AWS, supporting SaaS, AWS Marketplace, and bring your own license (BYOL) deployments. Elastic also provides AWS Marketplace Private Offers.
Customers have the option to deploy and run the Elastic Stack themselves within their AWS account, either free or with a paid subscription from Elastic. Learn how to get started with Elastic Cloud running on AWS.
.

.
Elastic – AWS Partner Spotlight
Elastic is an AWS ISV Partner that helps you find information, gain insights, and protect your data when you run on AWS.
Contact Elastic | Partner Overview | AWS Marketplace
*Already worked with Elastic? Rate the Partner
*To review an AWS Partner, you must be a customer that has worked with them directly on a project.