Artificial Intelligence
AWS Cloud technology for near-real-time cardiac anomaly detection using data from wearable devices
Cardiovascular diseases (CVDs) are the number one cause of death globally: more people die each year from CVDs than from any other cause.
The COVID-19 pandemic made organizations change healthcare delivery to reduce staff contact with sick people and the overall pressure on the healthcare system. This technology enables organizations to deliver telehealth solutions, which monitor and detect conditions that can put patient health at risk.
In this post, we present an AWS architecture that processes live electrocardiogram (ECG) feeds from common wearable devices, analyzes the data, provides near-real-time information via a web dashboard. If a potential critical condition is detected, it sends real-time alerts to subscribed individuals.
Solution overview
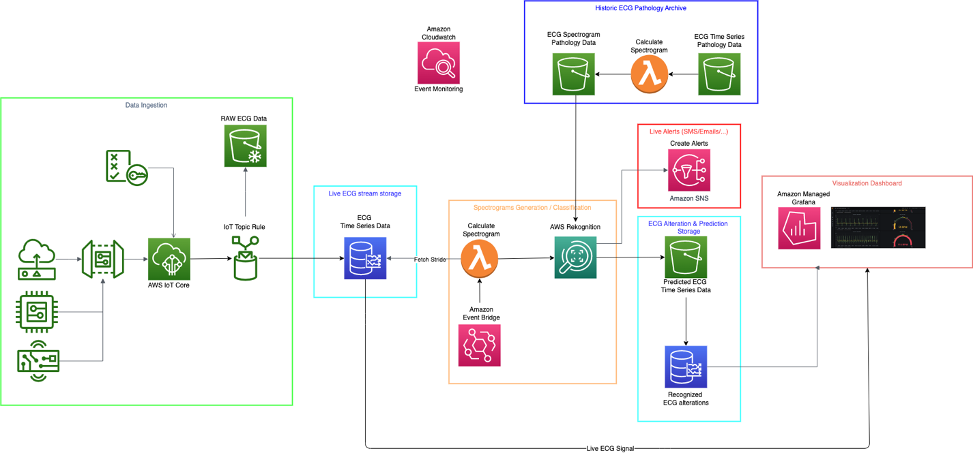
The architecture is divided in six different layers:
- Data ingestion
- Live ECG stream storage
- ECG data processing
- Historic ECG pathology archive
- Live alerts
- Visualization dashboard
The following diagram shows the high-level architecture.
In the following sections, we discuss each layer in more detail.
Data ingestion
The data ingestion layer uses AWS IoT Core as the connection point between the external remote sensors and the AWS Cloud architecture, which is capable of storing, transforming, analyzing, and showing insights from the acquired live feeds from remote wearable devices.
When the data from the remote wearable devices reaches AWS IoT Core, it can be sent using an AWS IoT rule and associated actions.
In the proposed architecture, we use one rule and one action. The rule extracts data from the raw stream using a simple SQL statement, as outlined by the following AWS IoT Core rule definition SQL code.
SELECT device_id, ecg, ppg, bpm, timestamp() as timestamp FROM ‘dt/sensor/#’The action writes the extracted data from the rule into an Amazon Timestream database.
For more information on how to implement workloads using AWS IoT Core, refer to Implementing time-critical cloud-to-device IoT message patterns on AWS IoT Core.
Live ECG stream storage
Live data arriving from connected ECG sensors is immediately stored in Timestream, which is purposely designed to store time series data.
From Timestream, data is periodically extracted into shards and subsequently processed by AWS Lambda to generate spectrograms and by Amazon Rekognition to perform ECG spectrogram classification.
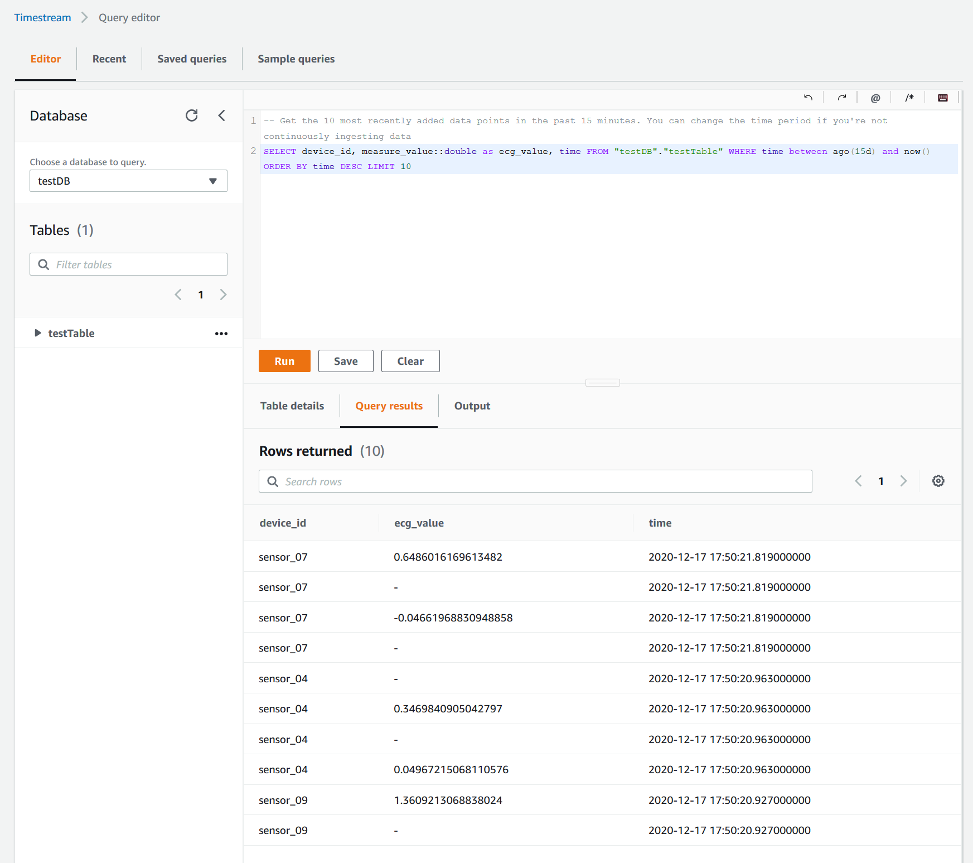
You can create and manage a Timestream database via the AWS Management Console, from the AWS Command Line Interface (AWS CLI), or via API calls.
On the Timestream console, you can observe and monitor various database metrics, as shown in the following screenshot.

In addition, you can run various queries against a given database.
ECG data processing
The processing layer is composed of Amazon EventBridge, Lambda, and Amazon Rekognition.
The core of the detection centers on the ability to create spectrograms from a time series stride and use Amazon Rekognition Custom Labels, trained with an archive of spectrograms generated from time series strides of ECG data from patients affected by various pathologies, to perform a classification of the incoming ECG data live stream transformed into spectrograms by Lambda.
EventBridge event details
With EventBridge, it’s possible to create event-driven applications at scale across AWS.
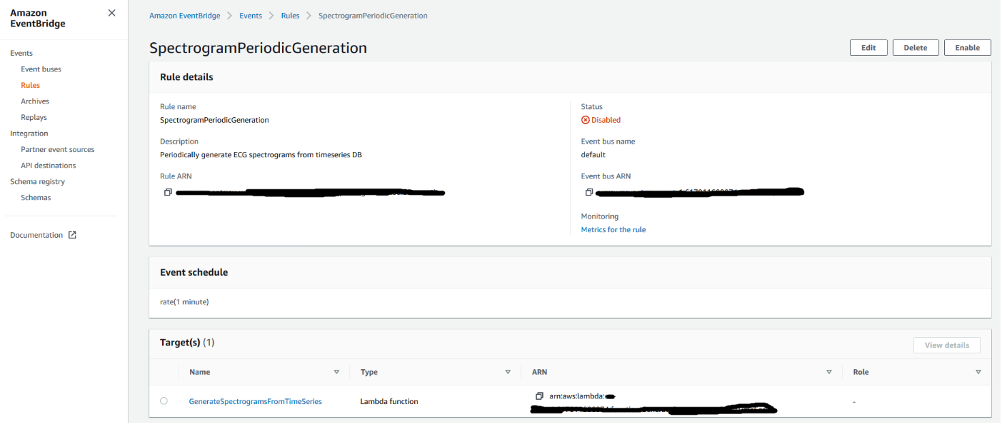
In the case of the ECG near-real-time analysis, EventBridge is used to create an event (SpectrogramPeriodicGeneration) that periodically triggers a Lambda function to generate spectrograms from the raw ECG data and send a request to Amazon Rekognition to analyze the spectrograms to detect signs of anomalies.
The following screenshot shows the configuration details of the SpectrogramPeriodicGeneration event.
Lambda function details
The Lambda function GenerateSpectrogramsFromTimeSeries, written entirely in Python, functions as orchestrator among the different steps needed to perform a classification of an ECG spectrogram. It’s a crucial piece of the processing layer that detects if an incoming ECG signal presents signs of possible anomalies.
The Lambda function has three main purposes:
- Fetch a 1-minute stride from the live ECG stream
- Generate spectrograms from it
- Initiate an Amazon Rekognition job to perform classification of the generated spectrograms
Amazon Rekognition details
The ECG analysis to detect if anomalies are present is based on the classification of spectrograms generated from 1-minute-long ECG trace strides.
To accomplish this classification job, we use Rekognition Custom Labels to train a model capable of identifying different cardiac pathologies found in spectrograms generated from ECG traces of people with various cardiac conditions.
To start using Rekognition Custom Labels, we need to specify the locations of the datasets, which contain the data that Amazon Rekognition uses for labeling, training, and validation.
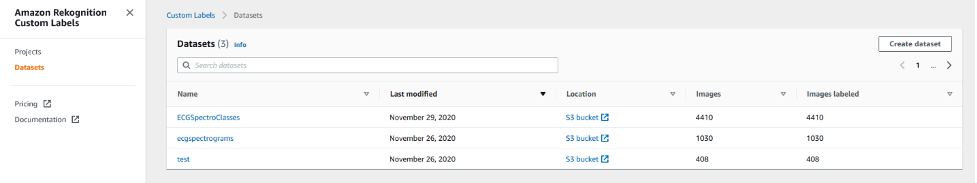
Looking inside of the defined datasets, it’s possible to see more details that Amazon Rekognition has extracted from the given Amazon Simple Storage Service (Amazon S3) bucket.
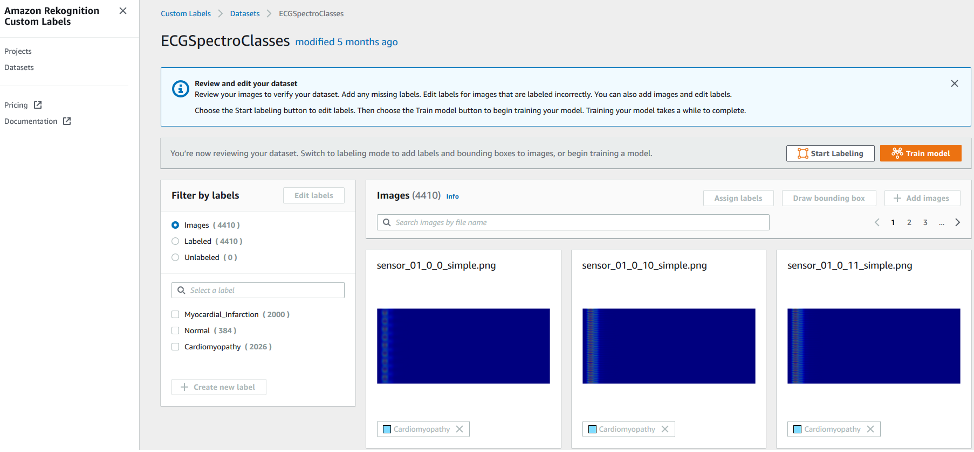
From this page, we can see the labels that Amazon Rekognition has automatically generated by matching the folder names present in the S3 bucket.
In addition, Amazon Rekognition provides a preview of the labeled images.
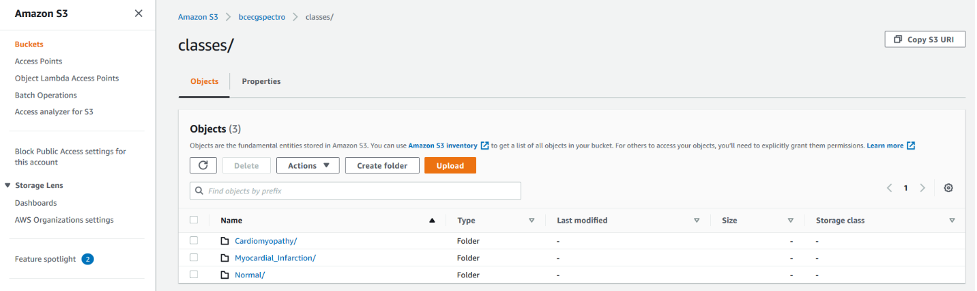
The following screenshot shows the details of the S3 bucket used by Amazon Rekognition.
After you have defined a dataset, you can use Rekognition Custom Labels to train on your data, and deploy the model for inference afterwards.
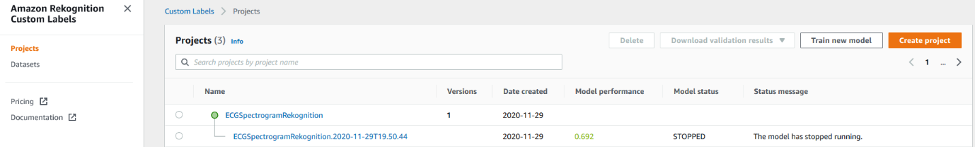
The Rekognition Custom Labels project pages provide details about each available project and a tree representation of all the models that have been created.
Moreover, the project pages show the status of the available models and their performances.
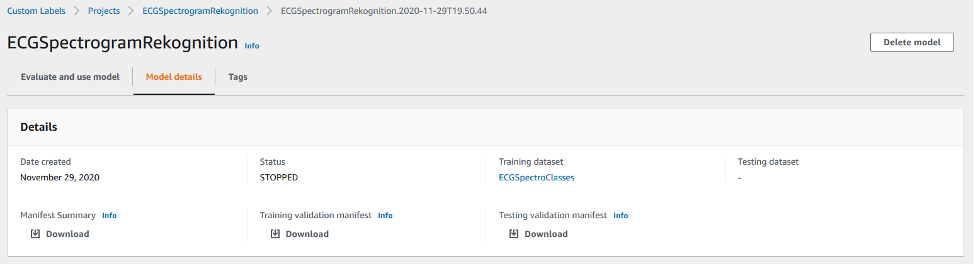
You can choose the models on the Rekognition Custom Labels console to see more details of each model, as shown in the following screenshot.
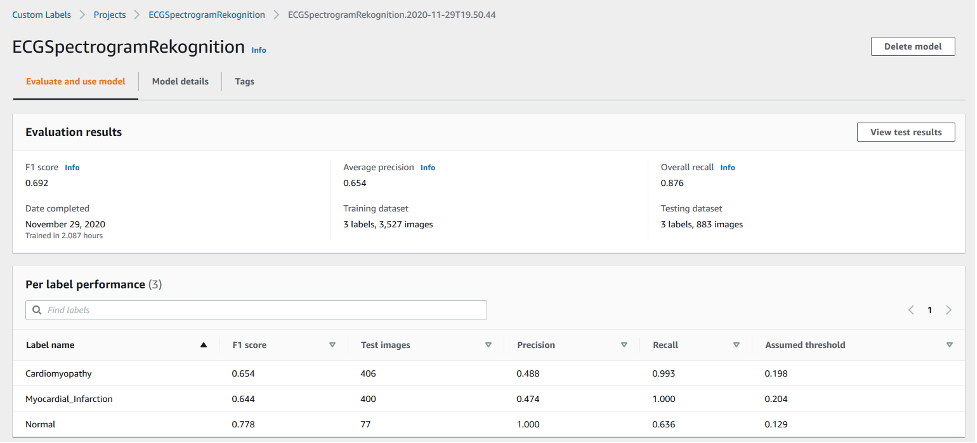
Further details about the model are available on the Model details tab.
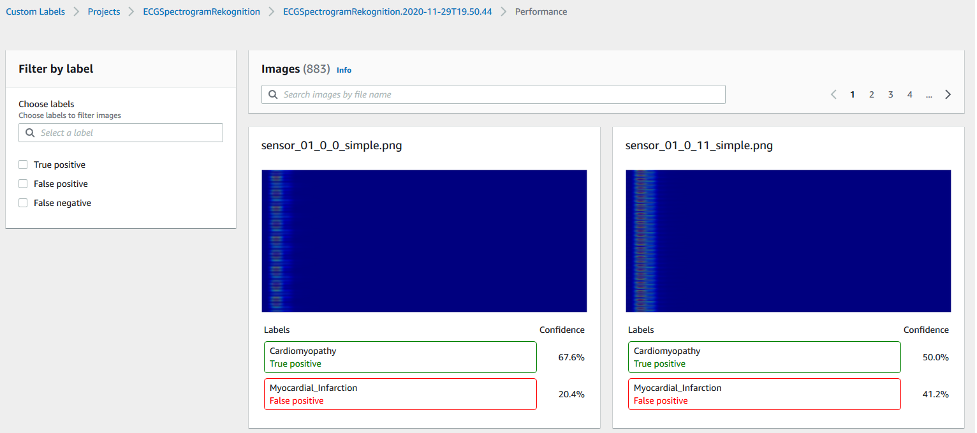
For further assessment of model performance, choose View test results. The following screenshot shows an example of test results from our model.
Historic ECG pathology archive
The pathology archive layer receives raw time series ECG data, generates spectrograms, and stores those in a separate bucket that you can use to further train your Rekognition Custom Labels model.
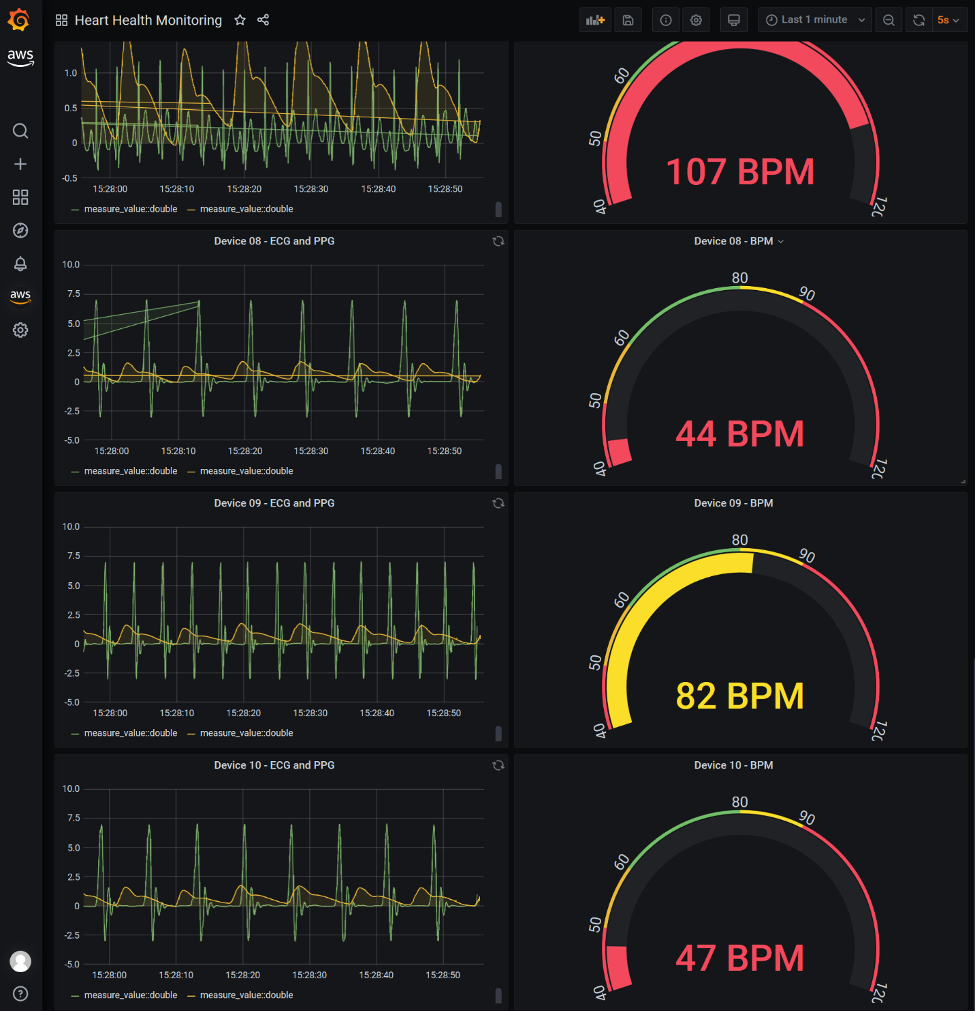
Visualization dashboard
The live visualization dashboard, responsible for showing real-time ECGs, PPG traces, and live BPM, is implemented via Amazon Managed Grafana.
Amazon Managed Grafana is a fully managed service that is developed together with Grafana Labs and based on open-source Grafana. Enhanced with enterprise capabilities, Amazon Managed Grafana makes it easy for you to visualize and analyze your operational data at scale.
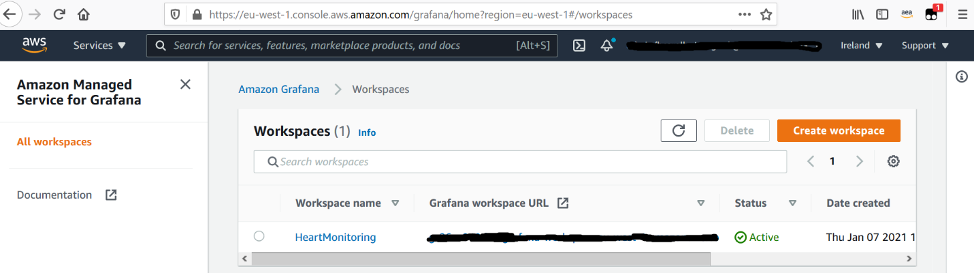
On the Amazon Managed Grafana console, you can create workspaces, which are logically isolated Grafana servers where you can create Grafana dashboards. The following screenshot shows a list of our available workspaces.
You can also set up the following on the Workspaces page:
- Users
- User groups
- Data sources
- Notification channels
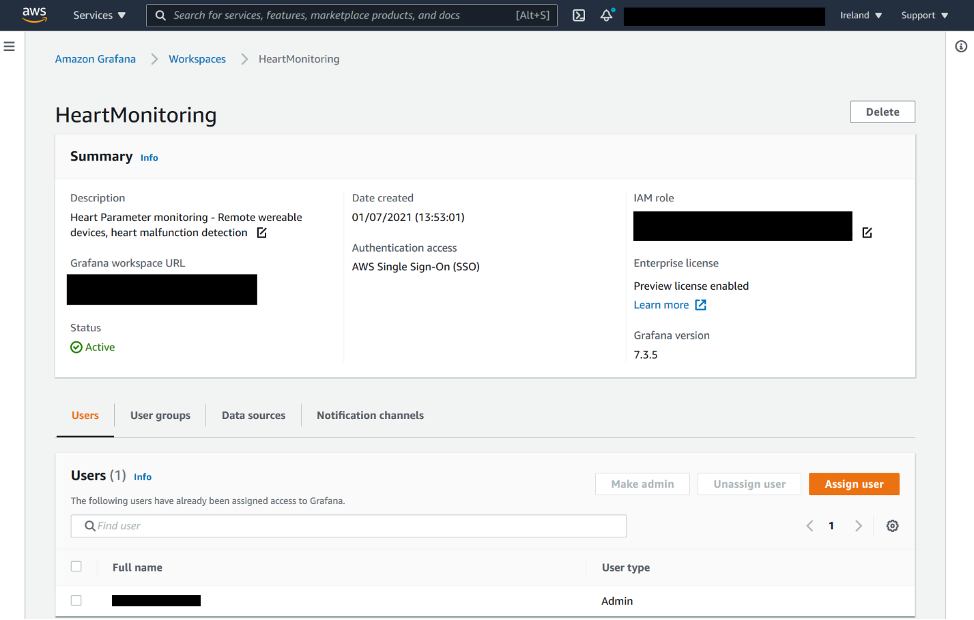
The following screenshot shows the details of our workspace and its users.
In the Data sources section, we can review and set up all the source feeds that populate the Grafana dashboard.
In the following screenshot, we have three sources configured:
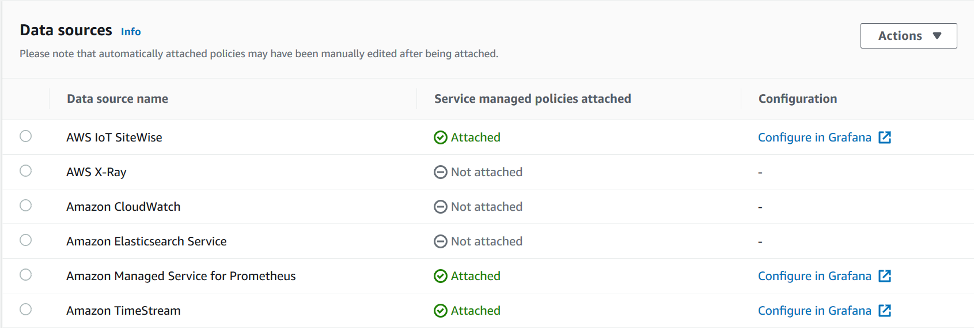
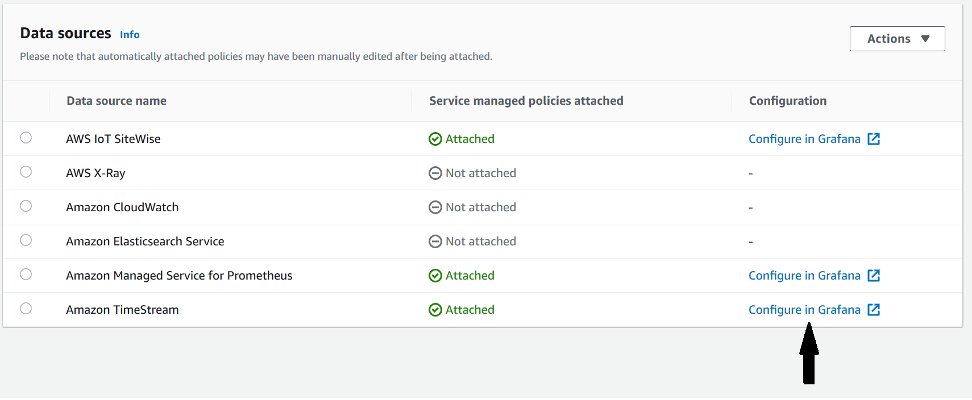
You can choose Configure in Grafana for a given data source to configure it directly in Amazon Managed Grafana.
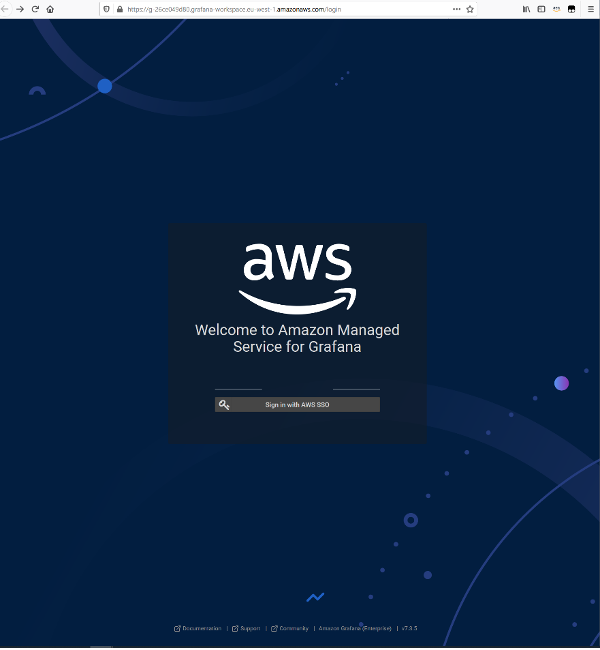
You’re asked to authenticate within Grafana. For this post, we use AWS IAM Identity Center (Successor to AWS Single Sign-On)
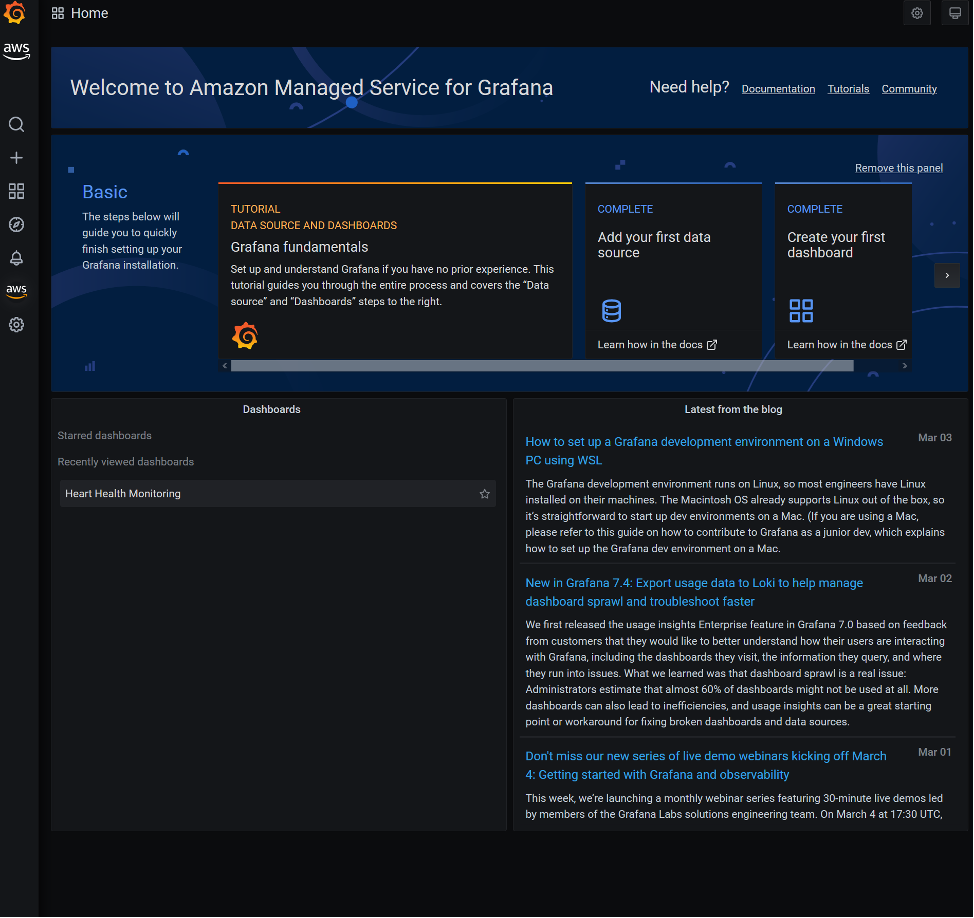
After you log in, you’re redirected to the Grafana home page. From here, you can view your saved dashboards. As shown in the following screenshot, we can access our Heart Health Monitoring dashboard.
You can also choose the gear icon in the navigation pane and perform various configuration tasks on the following:
- Data sources
- Users
- User groups
- Statistics
- Plugins
- Preferences
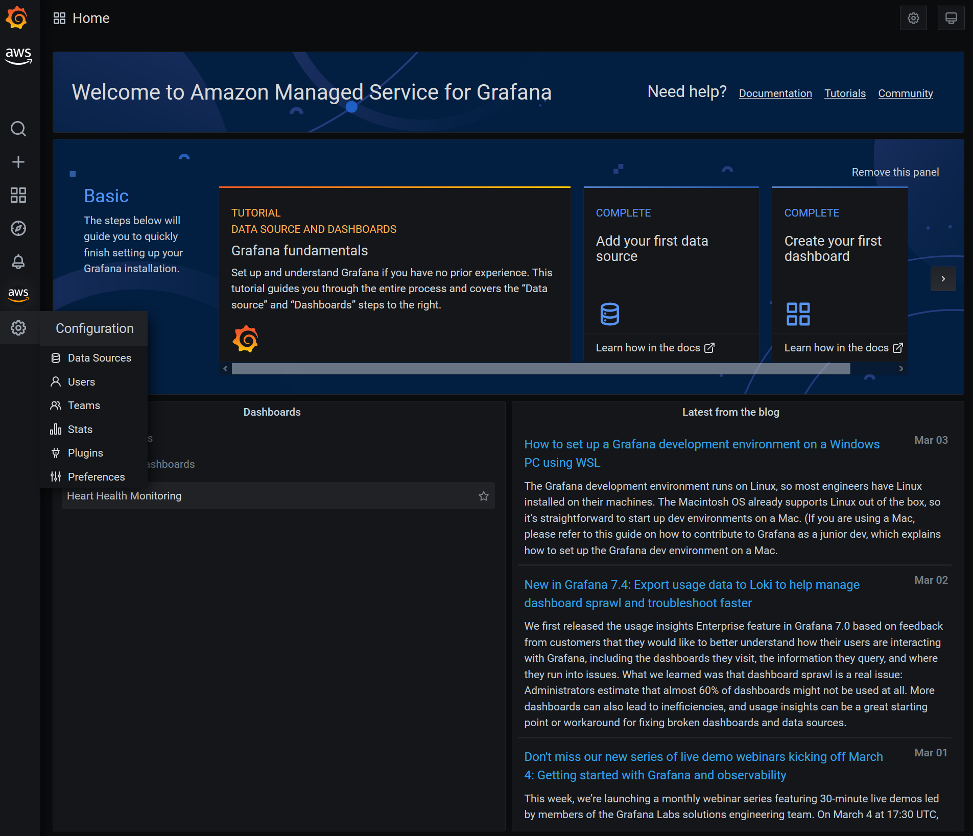
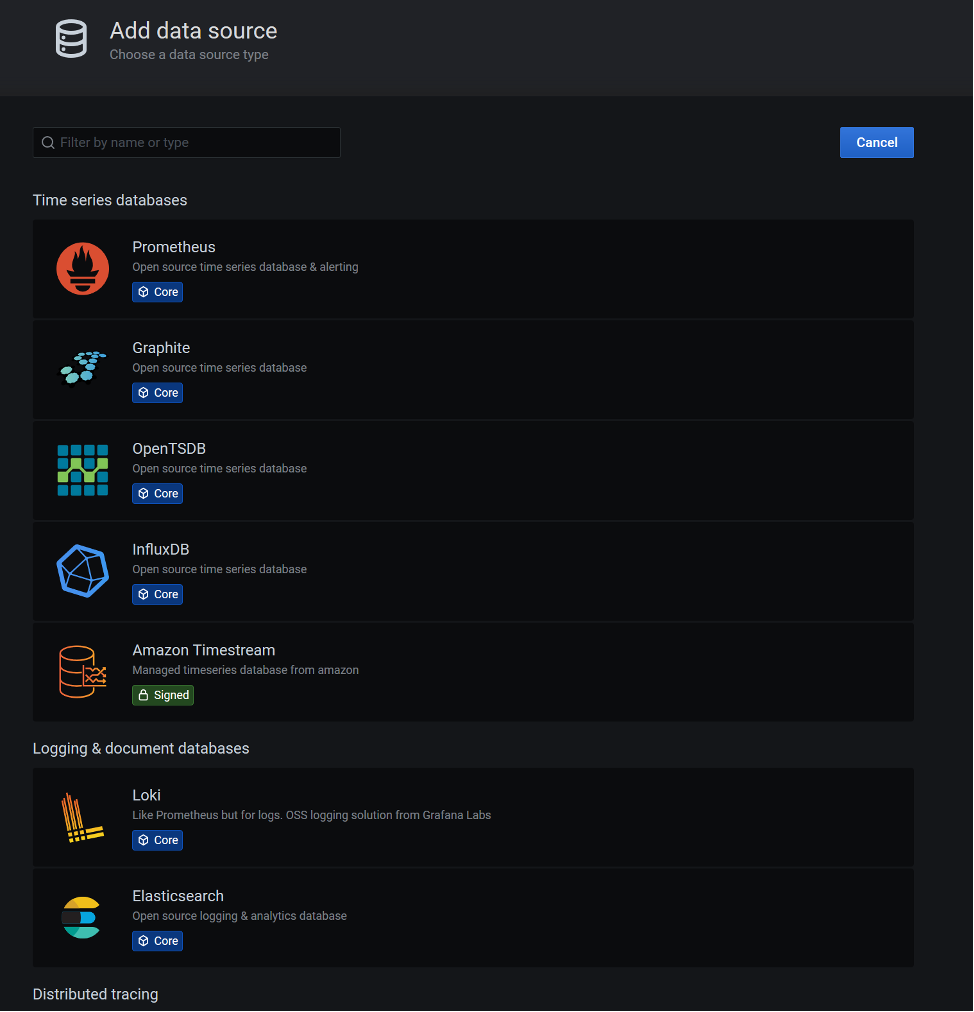
For example, if we choose Data Sources, we can add sources that will feed Grafana boards.
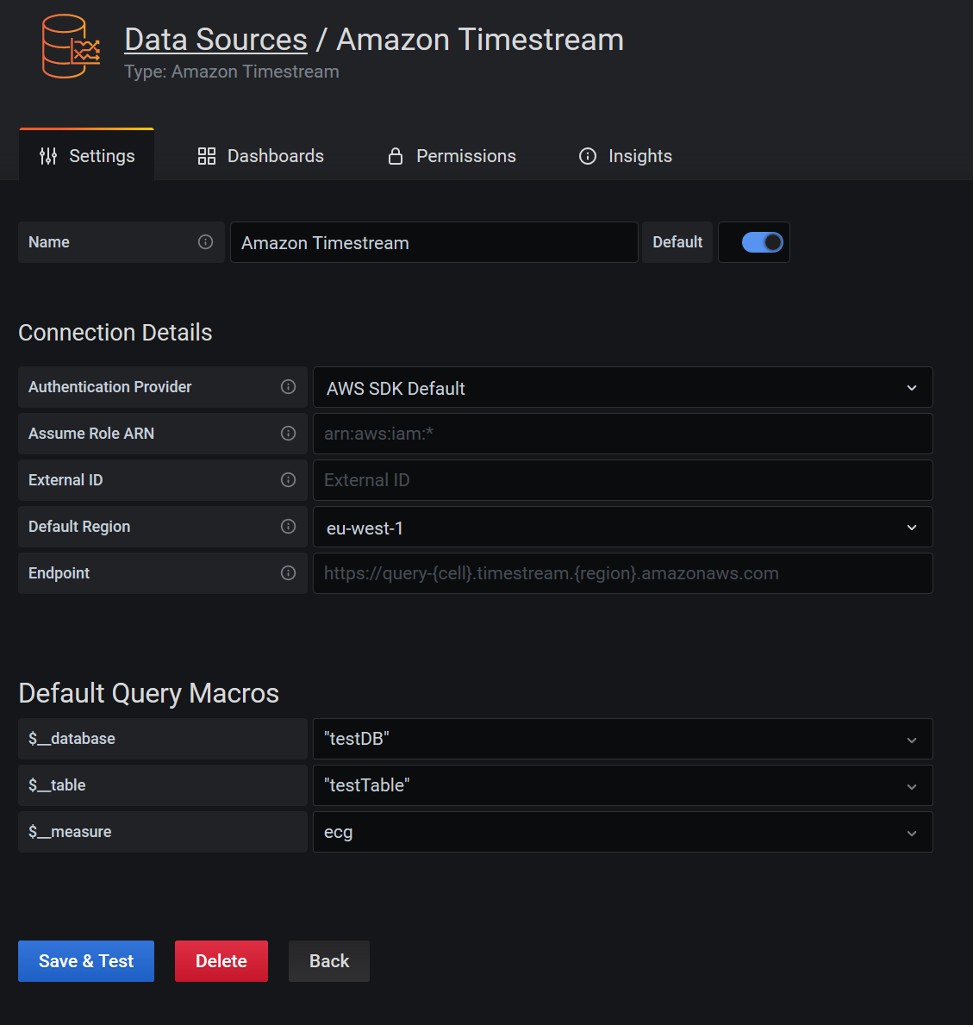
The following screenshot shows the configuration panel for Timestream.
If we navigate to the Heart Health Monitoring dashboard from the Grafana home page, we can review the widgets and information included within the dashboard.
Conclusion
With services like AWS IoT Core, Lambda, Amazon SNS, and Grafana, you can build a serverless solution with an event-driven architecture capable of ingesting, processing, and monitoring data streams in near-real time from a variety of devices, including common wearable devices.
In this post, we explored one way to ingest, process, and monitor live ECG data generated from a synthetic wearable device in order to provide insights to help determine if anomalies might be present in the ECG data stream.
To learn more about how AWS is accelerating innovation in healthcare, visit AWS for Health.
About the Author
 Benedetto Carollo is a Senior Solution Architect for medical imaging and healthcare at Amazon Web Services in Europe, Middle East, and Africa. His work focuses on helping medical imaging and healthcare customers solve business problems by leveraging technology. Benedetto has over 15 years of experience of technology and medical imaging and has worked for companies like Canon Medical Research and Vital Images. Benedetto received his summa cum laude MSc in Software Engineering from the University of Palermo – Italy.