AWS Partner Network (APN) Blog
Automatically Visualize and Monitor Applications on Amazon EKS with Instana
By Andrew Park, Partner Solutions Architect at AWS
By Jonathon Skog, Sr. Product Marketer at Instana
 |
 |
Modern application delivery has become more automated with the move to cloud platforms, containerization, orchestration, and microservices.
The shift from a traditional Service Oriented Architecture (SOA) to microservices running on Kubernetes has given rise to a new set of challenges for observability and monitoring.
To avoid blind spots, engineers need visibility into the dependencies between different microservices at the individual request level.
To achieve this, Instana has fully automated the installation of the monitoring agent into Kubernetes. With a single Helm install command, the Instana agent is deployed as a DaemonSet into the Kubernetes cluster and immediately starts collecting information.
The agent is automatically added to all schedulable nodes in the cluster. All of the data from Kubernetes, services, sidecars, and physical hosts are mapped together by Instana to provide a full end-to-end view of the contextual dependencies and impact of different components.
In this post, we will show you how you can leverage Instana to monitor your containerized workloads in Amazon Elastic Kubernetes Service (Amazon EKS).
Instana is an AWS Advanced Technology Partner and automated Application Performance Monitoring (APM) platform that discovers all application service components and application infrastructure in your Amazon Web Services (AWS) applications. It provides the ability to monitor containerized workloads in Kubernetes and provides the ability to monitor CI/CD pipelines like Jenkins.
Instana automatically deploys monitoring sensors for each part of the application technology stack, traces all application requests, and profiles every process—without requiring any human configuration or even application restarts.
The platform detects application and infrastructure changes in real-time, adjusting its own models and visualizing the changes and any performance impact in seconds.
Monitoring Amazon EKS with Instana
Instana automatically discovers and monitors your Amazon EKS components such as:
- Clusters
- Nodes
- Namespaces
- Deployments
- Services
- Pods
Instana provides real-time monitoring for all of the above Kubernetes components, and also monitors the services being deployed into Kubernetes, internal ones, and custom business services. This includes end-to-end distributed tracing of every request flowing through all services.
After the Instana agent starts, every container in the Kubernetes cluster is scanned for supported technologies, automatically set up to be monitored, and added to Instana. The single agent implementation keeps the monitoring overhead extremely low and simplifies the overall installation and maintenance process.
Get Started with Instana on Amazon EKS
Prerequisites
First, you will need to set up an Amazon EKS cluster. For this demo, we’ll use eksctl to launch the cluster. We recommend you download the following tools:
Once you have installed the tools, you can launch your EKS cluster. In this example, we’ll deploy your cluster in us-east-1, the AWS Virginia region; you can replace the AWS_REGION with any region that supports Amazon EKS.
Deploying the Cluster
To deploy the cluster, you can copy and paste the command below using the eksctl create cluster command, which will create the control plane and two worker nodes for your cluster.
eksctl create cluster <insert cluster name> --region=us-east-1
This will take approximately 10 minutes to complete. Once your cluster is ready to go, test that your installation finished correctly using the command below:
kubectl get svc
If everything was installed correctly, you should see a service listed.
Installing the Instana Agent Using the Helm Chart
Via a DaemonSet, the Helm chart adds the Instana agent to all schedulable nodes in your cluster.
To get started, you will need an Instana instance. If you do not already have one, sign up for a free trial.
If you’d prefer to test Instana on a sample application, Instana has created Stan’s Robot Shop. This is a sample microservices application you can use as a sandbox to test and learn application orchestration and monitoring techniques.
You will then follow these steps using the same cluster you deployed Stan’s Robot Shop into:
- Sign in to Instana, click More > Agents > Installing Instana Agents > Kubernetes.
- From this page, you’ll need your host agent endpoint and your agent key.
- From the Technology list, select Helm chart.
- Enter the cluster name and (optionally) the agent zone.
- The cluster name (INSTANA_KUBERNETES_CLUSTER_NAME) is the customized name of the cluster monitored by this daemonset.
- The agent zone (INSTANA_ZONE) is used to customize the zone grouping displayed on the infrastructure map. It also sets the default name of the cluster.
All of the other required parameters are pre-populated.
- The following command is for Helm 3:
To configure the installation, specify the values on the command line using the –set flag, or provide a yaml file with your values using the -f flag.
For a detailed list of all the configuration parameters, see the Instana Helm Chart.
Utilizing Instana in Your AWS EKS Environment
Instana’s automated continuous discovery and distributed tracing technology achieves full observability across your Amazon EKS environments.
Instana monitors both the Kubernetes core services and the applications deployed on the cluster, providing deep insights into the infrastructure and deployed microservices. The collected data is automatically analyzed and turned into actionable insights, maintaining the speed of your CI/CD process when using EKS as your deployment platform.
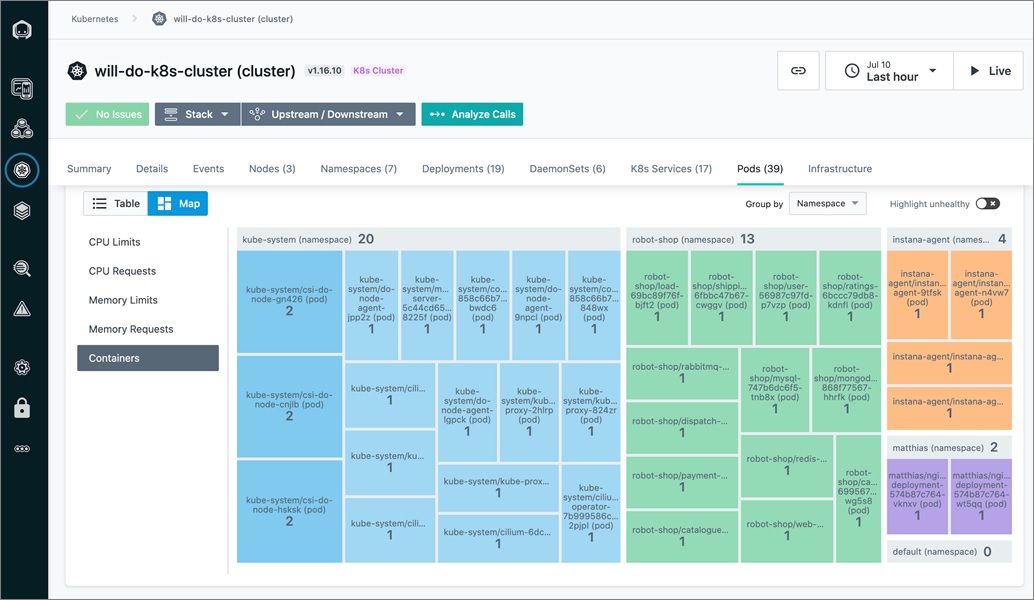
Figure 1 – Instana visualizes all running containers in your Amazon EKS cluster via unified dashboard.
The Instana agent is deployed as a daemonset within your Kubernetes cluster. Once the Instana agent has been installed into the EKS cluster, it will automatically discover all the containers running in the Pods.
Instana automatically collects time series metrics for all supported technologies and captures an end-to-end trace for every request for the supported language runtimes with AutoTrace.
Services and their endpoints are discovered and their KPIs automatically calculated: rate, errors and duration. All application and service dependencies are automatically discovered and tracked. Error messages are automatically captured and indexed against each endpoint and rolled up to service and application level.
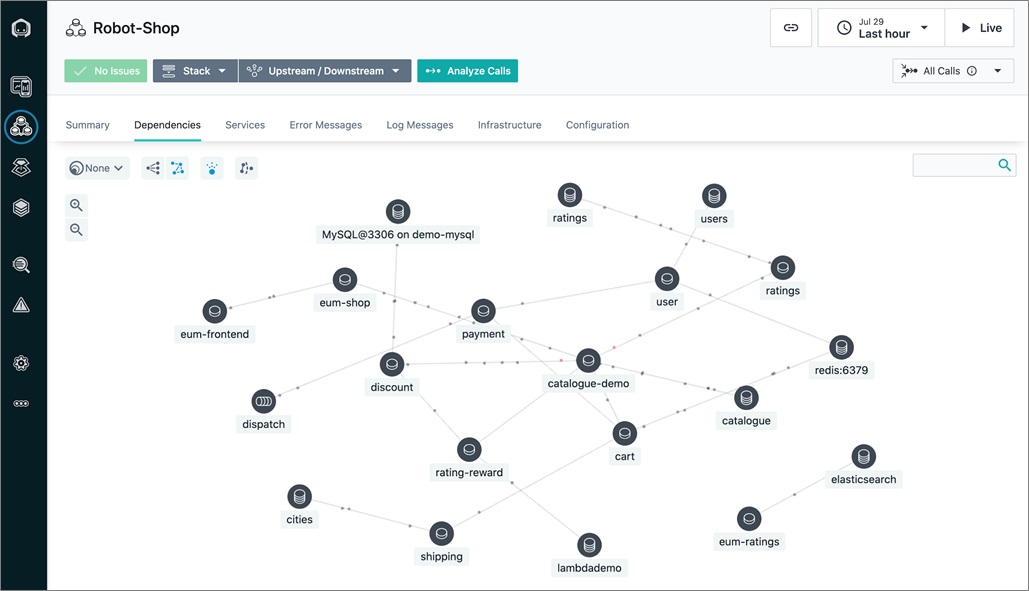
Figure 2 – Service dependency maps allow quick access to information.
Tracking the relationships between everything enables automatic root cause analysis, providing intelligent alerting. Indexing error messages against each endpoint facilitates immediate access to additional diagnostic context without the need to switch tools.
The figure below is an example of the Instana AutoTrace feature, which uses sensors to collect information about the health and performance of your services and gathers relationship data for every request such as service dependencies.

Figure 3 – AutoTrace uses sensors to collect information about the health and performance of your services.
Every request is traced end-to-end; there is no averaging or sampling as data is presented.
Instana AutoTrace does this entirely automatically without the need for any code modification or restarts for supported languages. All contextual information, including any error messages, are included in the trace along with any additional contextual information.
Summary
As the cloud platform marketplace continues to mature, with increasing enterprise adoption by both providers and consumers, Instana is already providing performance management value to those organizations.
The highly automated monitoring capabilities of Instana adapts to rapidly changing Kubernetes, serverless, and/or microservices-based environments, providing actionable information with nearly zero configuration. Maintaining, and even accelerating the speed of your software delivery process, is only possible with high levels of automation.
You can use Instana with all of your services, applications, and databases, no matter where and how they run. Trace your requests into AWS and out into services running on-premises, and into your cloud providers or other SaaS offerings.
Instana seamlessly captures all the necessary tracing information and delivers the correlated call information the way we love; simple and automatic.
.

.
Instana – AWS Partner Spotlight
Instana is an AWS Advanced Technology Partner that enables DevOps teams to build applications faster and deliver higher quality services by automating performance monitoring.
Contact Instana | Partner Overview | AWS Marketplace
*Already worked with Instana? Rate the Partner
*To review an AWS Partner, you must be a customer that has worked with them directly on a project.