AWS Partner Network (APN) Blog
Maximizing the Value of Your Cloud-Enabled Enterprise Data Lake by Tracking Critical Metrics
By Alberto Artasanchez, DBG Artificial Intelligence Lab Director at Accenture
By Raniendu Singh, Senior Data Engineer at AWS
By Gopal Wunnava, Principal Architect at AWS
 |
More than ever, consulting projects run with lean staffs and tight deadlines. It’s imperative to quickly demonstrate value-add and results. There are many resources, vendors, and tools to assist in the creation of an enterprise data lake, but the tooling needed to measure the success of a cloud-based enterprise data lake implementations is lacking.
Successful data lake implementations can serve a corporation well for years. A key to success and longevity is to effectively communicate whether the implementation is adding value or not. However, most metrics for an enterprise data lake are not binary and are more granular than just saying the project is “green” or “red.”
Accenture, an AWS Partner Network (APN) Premier Consulting Partner, recently had an engagement with a Fortune 500 company that wanted to optimize its Amazon Web Services (AWS) data lake implementation.
As part of the engagement, Accenture moved the customer to better-suited services and developed metrics to closely monitor the health of its overall cloud environment.
In this post, we will focus on specifying the different metrics you can use in your environment to properly assess the status of your cloud-based data lake. We’ll detail some of the data lake metrics that can be used to measure performance. To set the context, we’ll first introduce some basic data lake concepts.
Data Lake Overview
The data lake paradigm is not new, and many enterprises are either thinking about implementing one or in the middle of implementing one for their organization.
An important concept to cover is the set of components that form the data lake. A data lake is most often divided into the following parts:
- Transient data zone: This is a buffer used to temporarily host the data as you prepare to permanently move it to the landing data zone defined later.
- Raw data zone: After quality checks and security transformations have been performed in the transient data zone, the data can be loaded into the raw data zone for permanent storage.
- Trusted data zone: This is where the data is placed after it’s been checked to be in compliance with all government, industry, and corporate policies. It’s also been checked for quality.
- Refinery data zone: In this zone, data goes through more transformation steps. Data here is integrated into a common format for ease of use. It goes through possible detokenization, more quality checks, and lifecycle management. This ensures the data is in a format you can easily use to create models and derive insights.
- Sandboxes: Sandboxes are an integral part of the data lake because they allow data scientists, analysts, and managers to create unplanned exploratory use cases without the involvement of the IT department.
Sample Data Lake Architecture
Building a data lake is a non-trivial task requiring the integration of disparate technologies for data storage, ingestion, and processing, to name a few. Moreover, there are no standards for security, governance, and collaboration, which makes things more complicated.
There are many other factors a business must investigate before selecting its technology stack. There are many tools that can be used to implement a data lake, which could exist purely on the cloud, on-premises, or use a hybrid architecture.
Most data lakes take advantage of new open source and cloud services, but you could potentially use legacy technologies to implement your data lake if the business requirements sent you in that direction.
Here is a sample architecture for a data lake Accenture recently created for another customer using cloud-based technologies from AWS.
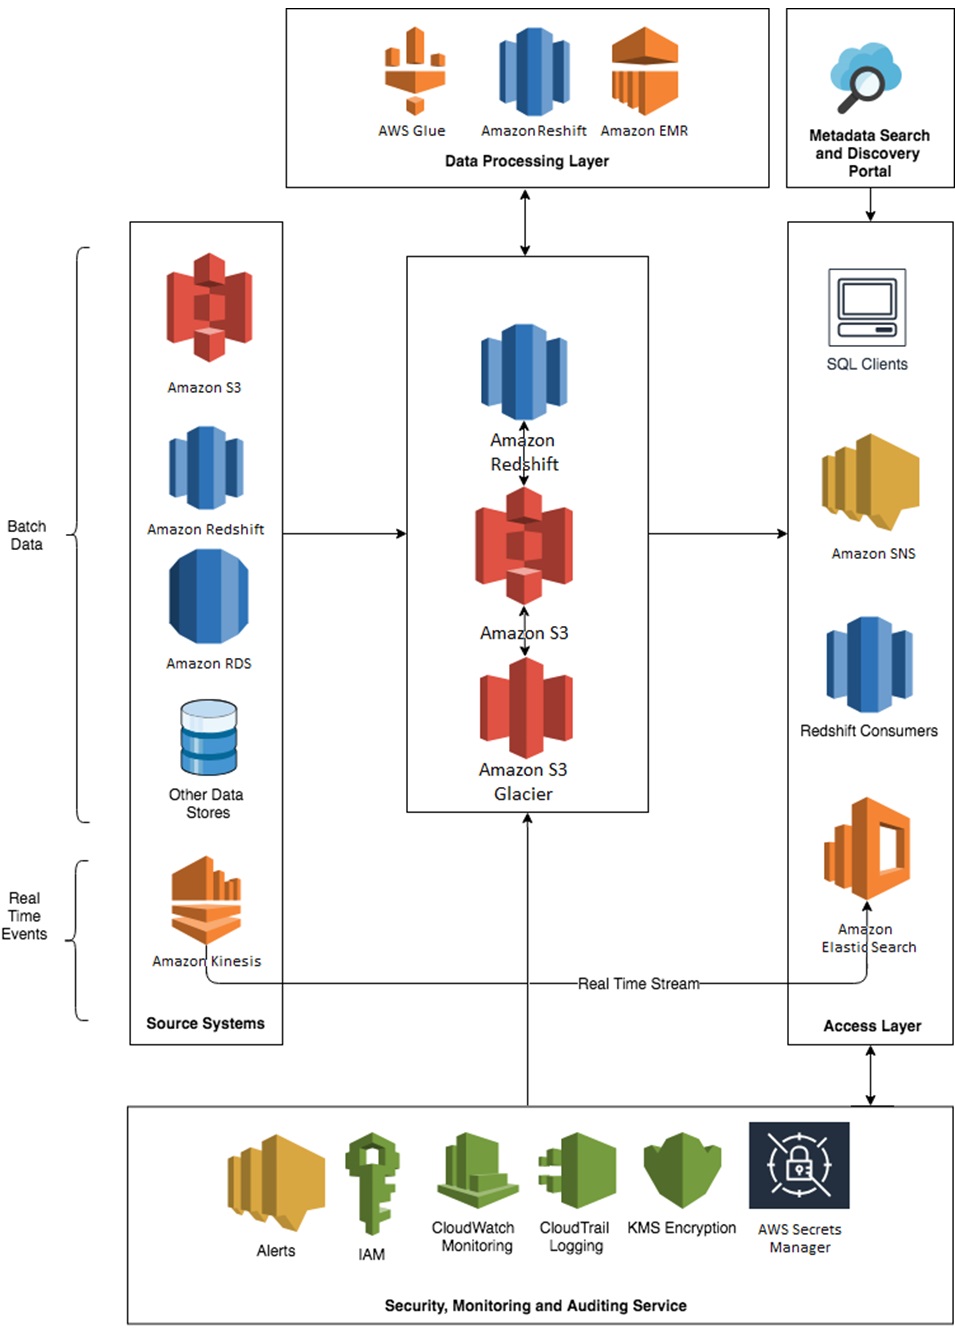
Figure 1 – Sample data lake physical architecture.
Data Lake Characteristics to be Measured
Before you can measure a data lake, you have to define what to measure. Here are a few characteristics to help you with these measurements:
- Size: Together with variety and speed, these three characteristics are the oft-mentioned three Vs in many definitions of big data (volume, variety, velocity). How big is the data lake?
- Governability: How easy is it to verify and certify the data in your lake?
- Quality: What’s the quality of the data contained in the lake? Are some records and files invalid? Are there duplicates? Can you determine the source and lineage of the data?
- Usage: How many visitors, sources, and downstream systems does the lake have? How easy is it to populate and access the data in the lake?
- Variety: Does the data the lake is holding have many types? Are there many types of data sources that feed the lake? Can the data be extracted in different ways and formats, such as files, Amazon Simple Storage Service (Amazon S3), HDFS, traditional databases, and NoSQL?
- Speed: How fast can you populate and access the lake?
- Stakeholder and customer satisfaction: Users, downstream systems, and source systems are the data lake customers. We recommend periodically probing the data lake customers in a formal and measurable fashion—with a survey, for example—to get feedback and levels of satisfaction or dissatisfaction.
- Security: Is the lake properly secured? Can only users with the proper access obtain data in the lake? Is the data encrypted? Is personally identifiable information (PII) properly masked for people without access?
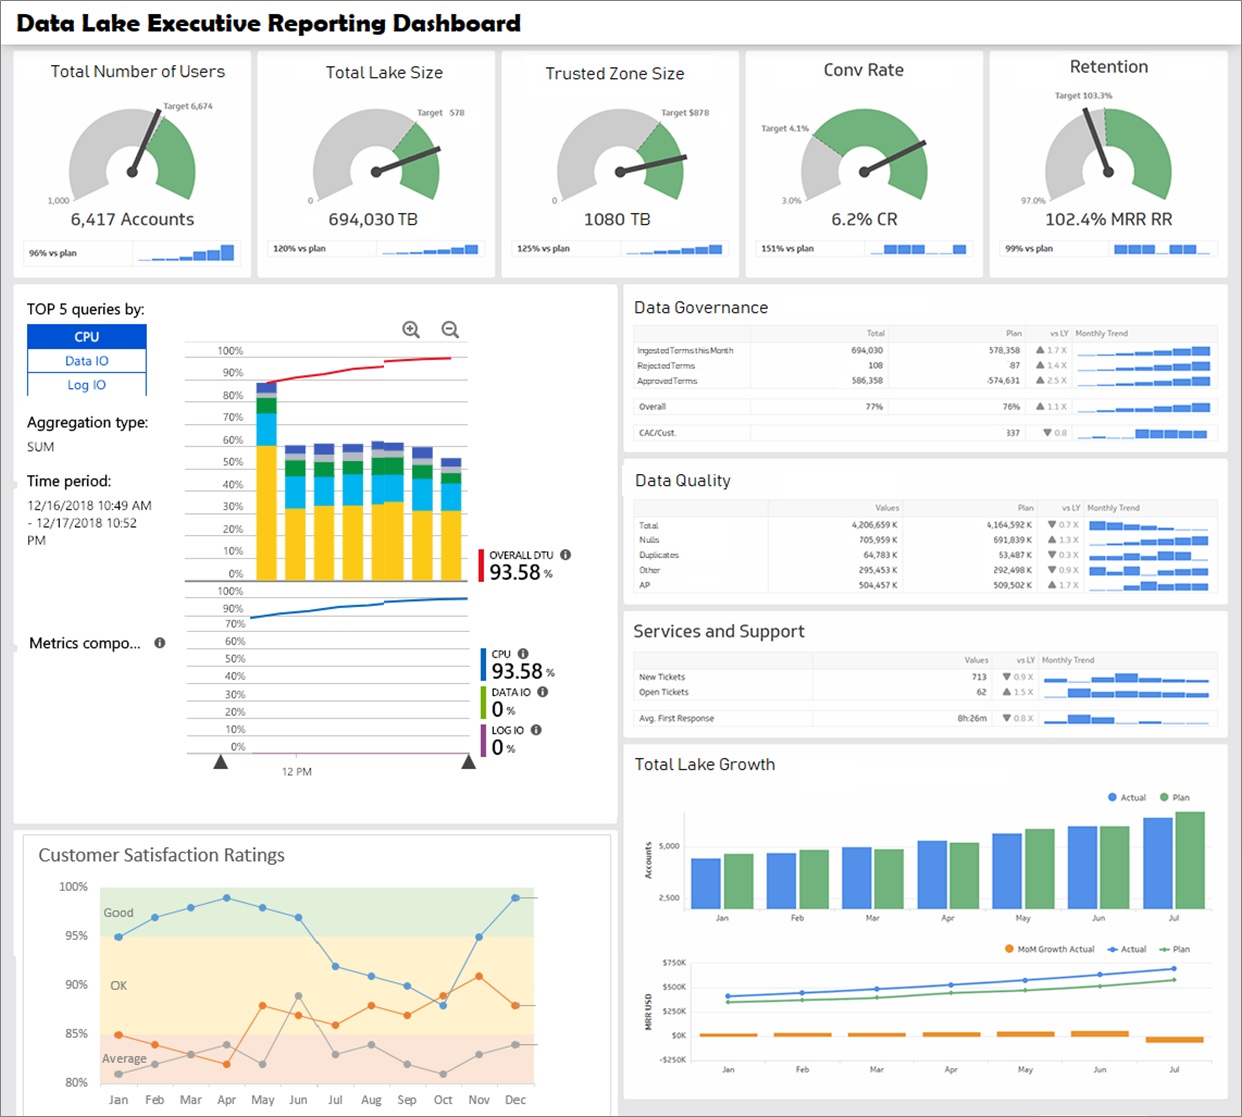
Figure 2 – Sample enterprise data lake executive dashboard.
In the image above, you see a sample data lake executive dashboard for a Fortune 500 company, capturing many of the metrics discussed in this post.
A dashboard of this nature can help you to quickly obtain a visual snapshot of how your data lake is performing, using key metrics such as data governance, data quality, growth, user base, and customer satisfaction.
Measuring Data Lake Performance
Now that we have laid out all of the necessary context to get into the core of this post, let’s explore some of the metrics that can be used to gauge the success of your data lake.
A list of these metrics follows, but it’s not meant to be a comprehensive list. Rather, this is a starting point to generate the metrics applicable to your particular implementation.
Size
You may want to track two measurements: total lake size, and trusted zone size. For total lake size, the number itself might not be significant or provide any value. The lake could be full of useless data or valuable data. However, this number has a direct effect on your billing costs.
One way to keep this number in check and reduce costs is to set up an archival or purge policy. Your documents are moved to long-term storage like Amazon Glacier, or they can be permanently deleted.
Amazon S3 provides a convenient way to purge files by using life cycles policies, or by using S3 Intelligent-Tiering that optimizes costs by automatically moving data to the most cost-effective access tier, without performance impact or operational overhead. S3 Intelligent-Tiering stores objects in two access tiers: one that’s optimized for frequent access, and another lower-cost tier that’s optimized for infrequent access.
For trusted zone size, the bigger the number the better. It’s a measure of how much “clean data” exists in the lake. You can dump enormous amounts of data into the raw data zone. If it’s never transformed, cleaned, and governed, however, the data is useless.
Governability
This might be a difficult characteristic to measure, but it’s an important one as not all data must be governed. The critical data needs to be identified and a governance layer should be added on top of it.
There are many opportunities to track governability, such as:
- Designate critical data elements (CDEs) and relate them at the dataset level to the data in the lake. Track what percentage of CDEs that are matched and resolved at the column level.
- Track the number of approved CDEs against the total CDEs.
- Track the number of modifications done to CDEs after the CDEs have already been approved.
Quality
Data quality does not need to be perfect; it just needs to be good enough depending on the domain. For example, if you’re using a dataset to generate this quarter’s financial report, the key metrics used to summarize the financial state of the company need to be as accurate as possible.
However, it may be OK for some reports accompanying this financial data to contain typos in the names of people presenting the financial data to the public. Such typos are far less damaging to the company and can be fixed easily without attracting the attention of auditors.
If the use case is trying to determine who should receive a marketing email, the data must still be fairly clean. However, if some of the emails are invalid, it’s not going to be a huge issue.
Data quality dimensions that are normally measured are:
- Completeness: What percentage of the data includes a value? It’s important that critical data such as customer names, phone numbers, and emails be complete. Completeness doesn’t impact non-critical data that much.
- Uniqueness: Are there duplicates in the data when there shouldn’t be any?
- Timeliness: Is the data being produced in time for it to be useful?
- Validity: Does the data conform to the respective standards set for it?
- Accuracy: How well does the data reflect the real-world scenario that it represents?
- Consistency: How well does the data align with a pre-established pattern? A common example is dates where patterns can vary greatly.
Usage
Borrowing a term from the internet, you might want to track the number of page requests, as well as the number of visits and visitors to your data lake in general. Also, track individual components of the lake.
Metrics we monitored in the dashboard we created for our Fortune 500 customer was the conversion (i.e. how many visitors turn into customers) and retention rates (i.e. how many customers turned into long-term customers).
Tracking these metrics gives you one indication of where to focus your efforts. If a certain section of the data lake is not getting much traffic, for example, you may want to consider make it obsolete.
AWS provides a convenient way to track your usage metrics by directly using SQL queries against AWS CloudTrail using Amazon Athena.
Variety
You should measure the variety of a couple components of the data lake:
- Ideally, data lakes should be able to ingest a wide variety of input types: relational database management systems (RDBMS), NoSQL databases such as Amazon DynamoDB, CRM application data, JSON, XML, emails, logs, etc.
. - Even though the input data may be of many different types, you might want to homogenize the data in the lake as much as possible into one format and one storage type. This could be, for example, converting the data to a columnar format such as Parquet, which makes querying more efficient, and then storing the same in Amazon S3 buckets in your data lake. Adopting this technique as a standard approach enhances the overall user experience.
Complete uniformity might not be achievable or even desired. For example, it doesn’t make sense to convert unstructured data into Parquet. Use this metric as a loose guideline and not a strict policy.
Speed
Two useful measurements to use when it comes to speed are:
- How long it takes to update the trusted data zone from the moment you start the ingestion process.
- How long it takes for users to access the data that they require.
In both of these cases, it’s not required to squeeze every possible millisecond from the process. It just needs to be good enough. For example, if the nightly window to populate the data lake is four hours and the process is taking two hours, that may be acceptable.
However, if you know your input data will double, you’ll want to find ways to speed up the process since you will be hitting the limit shortly. Similarly, if user queries are taking a few seconds and they are using the queries to populate reports, the performance might be acceptable. The time it takes to optimize the queries further may be better spent on other priorities.
Customer Satisfaction
Other than security, this is one of the most important metrics to continuously track. We’re all at the mercy of our customers, and in this case the customers are our data lake users. If you don’t have users in your lake, or your users are unhappy, don’t be surprised if your data lake initiative withers in the vine and eventually dies.
You can track customer satisfaction in a variety of ways, ranging from the informal to the strict and formal. The most informal way is to periodically ask your project sponsor for a temperature reading.
To formalize this metric, we recommend a formal survey of the data lake users. You can multiply those opinions by the level of usage by each of the survey participants. If the lake gets a bad grade from a few sporadic users and great grades from hardcore users, it probably means your data lake implementation has a steep learning curve. When users get familiar with it, though, they can be hyper-productive.
Security
Security is paramount to ensure the data lake is secure and users have access only to their data. Having only a few breaches in the lake is not acceptable. Even one breach could mean critical data is compromised and can be used for nefarious purposes by competitors or other parties.
Following are some AWS services and features that assist in data lake implementation and facilitate the tracking of security metrics.
- AWS Lake Formation: One of the features of this services is that it provides centralized access controls for your data in the lake. Granular data access policies can be defined for your users and applications to protect your data, which is independent of the services used to access the data.
.
AWS Lake Formation ensures all of your data is described in a data catalog, giving you one central location to browse and query the data you have permission to access. AWS Lake Formation uses AWS Identity and Access Management (IAM) policies to control permissions, and IAM and SAML authenticated users can be automatically mapped to data protection policies that are stored in the data catalog.
.
After the rules are established, AWS Lake Formation can enforce access controls with fine-grained granularity at the table and column level for Amazon Redshift Spectrum and Amazon Athena users. EMR integration supports authorization of Active Directory, Okta, and Auth0 users for EMR and Zeppelin notebooks connected to EMR clusters.
. - AWS Security Hub: This services provides AWS users with a central dashboard to track, aggregate, and measure security findings, and compare the against pre-established policies and compliance checks.
.
AWS Security Hub provides a “single pane of glass” view that serves as a starting point to get a sense of the overall health of a system. With AWS Security Hub, we can consolidate multiple AWS services like Amazon GuardDuty, Amazon Inspector, and Amazon Macie, as well as other APN Partner solutions, into one dashboard.
. - Amazon Macie: Storing PII data incorrectly can carry big penalties to a company’s reputation, as well as to its bottom lines via fines and lost business. To minimize this risk, Amazon Macie can be used to automatically scan your data lake to locate and flag errant PII in your repositories.
Optimizing the Data Lake
Once we start measuring the performance of the data lake, we can identify areas that can be improved and enhanced. AWS offers a variety of services that can assist in this task.
One powerful and new service at our disposal is AWS Lake Formation, which allows you to easily set up data lakes. In the context of optimizing the data lake, though, AWS Lake Formation offers the following features:
- Data discovery, catalog, and search: AWS Lake Formation automatically discovers all AWS data sources to which it’s provided access by your IAM policies. The service invokes Aws Glue to crawl through data sources such as Amazon S3, Amazon Relational Database Service (Amazon RDS), and AWS CloudTrail to ensure your data is described in a centralized data catalog.
.
While the crawlers automatically generate properties useful to describe your metadata, you can add custom labels to categorize and comment on business attributes, such as data sensitivity and criticality, at the table or column level. These custom labels also provide you with the opportunity to be creative in terms of labeling and describing key metrics we use to measure data lake performance as identified earlier.
.
AWS Lake Formation provides an intuitive user interface to perform text-based search and filtering on entities by type, classification, attribute or free form text.
. - Increased performance: AWS Lake Formation facilitates data transformation into more performant formats like Parquet and ORC. It also optimizes data partitioning in Amazon S3 to improve performance and reduce costs. Raw data that’s loaded may be in partitions that are too small (requiring extra reads) or too large (reading more data than needed).
. - Clean and deduplicate data: AWS Lake Formation provides a powerful feature called AWS Lake Formation FindMatches to help clean and prepare your data for analysis by providing deduplication and finding matching records using artificial intelligence.
. - Increased security: AWS Lake Formation simplifies security management by enforcing encryption leverages the existing encryption capabilities of Amazon S3. The service records all activity in AWS CloudTrail, which enables governance, compliance, and operational and risk auditing capabilities.
Getting Started
In the AWS console, you can quickly start building data lakes and measuring their performance with AWS Lake Formation.
Accenture has a strong partnership with AWS, with a joint group dedicated to helping customers accelerate their innovation using cloud as a catalyst.
If you have questions or feedback about AWS Lake Formation, please email lakeformation-feedback@amazon.com.
Summary
In this post, we discussed a customer’s journey and some challenges they faced when implementing a data lake. We specified the elements of a well-formed data lake and presented a sample data lake architecture using cloud-based technologies from AWS.
We also defined a few of the data lake characteristics that can be measured, and then laid out how these characteristics are then measured and tracked. Finally, we showed you how these measurements can be used to enhance the data lake.
Just like the number of data lake definitions is vast, the number of potential metrics to use against your data lake is also large. The metrics we have laid out here should be a launching pad for your own custom metrics to measure your data lake’s success.
We are interested in hearing about the metrics you find relevant, as well as the challenges you faced and the solutions that worked for you.
.

.
Accenture – APN Partner Spotlight
Accenture is an APN Premier Consulting Partner. A leading, global professional services company that provides an end-to-end solution to migrate to and manage operations on AWS, Accenture’s staff of 440,000+ includes more than 4,000 trained and 2,000 AWS Certified professionals.
Contact Accenture | Practice Overview
*Already worked with Accenture? Rate this Partner
*To review an APN Partner, you must be an AWS customer that has worked with them directly on a project.