AWS Partner Network (APN) Blog
DXC Technology Enables End-to-End Tracing for Microservice Architecture Using AWS X-Ray
By Charles Christopher, Cloud Solution Architect – DXC Technology
By Rakesh Kootheri, Cloud Solution Lead – DXC Technology
By Sumit Upadhyaya, Cloud Solution Lead – DXC Technology
By Dhiraj Thakur, Solutions Architect – AWS
 |
| DXC Technology |
 |
DXC Technology was managing a customer application on Amazon Web Services (AWS) that received two million requests per day, but it was challenging and time consuming to trace the failure and performance of the application.
The customer was looking to get a complete view of requests traveling through the application so they could compare trace sets with different conditions for the purpose of root cause analysis.
DXC deployed distributed tracing using AWS X-Ray, which helps monitor and debug distributed applications within the workflow to aid in swift identification of any performance issues or errors.
In this post, we will present a reference architecture that aligns with what DXC designed and explain step-by-step how to enable AWS X-Ray for different AWS products.
DXC Technology is an AWS Premier Tier Services Partner and AWS Marketplace Seller with multiple AWS Competencies, including Migration, Mainframe, and Security Consulting. With over 10,000 AWS-accredited professionals, DXC understands the complexities of migrating workloads to AWS in large-scale environments.
Benefits of AWS X-Ray
AWS X-Ray gives customers an end-to-end view of an application’s request flow and aggregates the data generated by various services in the application. This helps customers to monitor and view utilization in real time.
AWS X-Ray provides the following benefits:
- Collects traces: AWS X-Ray gathers data from each fundamental service within the application.
- Records traces: X-Ray combines all of the data gathered from each service into singular units called “traces.”
- Provides a service map: X-Ray generates a detailed map or visual representation that shows the relationship between resources and services in the application.
- Enables analysis: After all the traces are gathered and formatted into a service map, developers can identify any unusual behavior in the application, or drill down into specific services and paths that are affecting application performance.
AWS X-Ray is ready to use with applications running on Amazon Elastic Compute Cloud (Amazon EC2), Amazon Elastic Container Service (Amazon ECS), AWS Lambda, AWS Elastic Beanstalk, AWS Step Functions, and Application Load Balancer, among other AWS products.
That makes it easier to integrate and scale up when new components are added to the architecture.
Solution Architecture for Distribution Tracing Using X-Ray
Figure 1 shows how to implement end-to-end observability for an online order application. The basic application function is to validate a product’s availability and payment information. After successful product validation, the system places the order and notifies the user.
Because this is a microservices-based architecture, tracing will be difficult since there are multiple microservices and AWS service components are included. Also, identifying the failures and errors between these various services can be complex.
Hence, this solution helps to trace the end-to-end flow between the product, order, and notification microservices.

Figure 1 – Solution architecture for distribution tracing using X-Ray.
The architecture is REST API-based and observability is implemented using AWS X-Ray.
The order request is submitted in JSON format and the request initially hits the Amazon API Gateway. The API call is secured using two-way authentication using the API key and Amazon Cognito authorizer.
After authentication, the request triggers the AWS Step Functions state machine and calls the microservices in an order defined in the state machine.
First, the product microservice is invoked from the Step Function, which is deployed in AWS Fargate.
The product microservice validates the product and payment information by referring to product data stored in the MySQL database. After successful validation, Step Functions invokes the order microservice, which is deployed in the Amazon EC2 instance.
The order microservice places the order and stores the order information in Amazon DynamoDB. It also pushes the order details to Amazon Simple Queue Service (SQS).
Then the notification microservice, which deploys as a Lambda function, polls the SQS and invokes Amazon Simple Notification Service (SNS) to notify the order confirmation details to the user by email.
As shown in Figure 1 above, AWS X-Ray has been enabled for various AWS services through configuration and AWS X-Ray SDK code snippets in microservices.
Below, you will find step-by-step instructions for how to configure AWS X-Ray for AWS products supporting X-Ray.
AWS X-Ray Enablement on Amazon API Gateway
Refer to the following steps and Figure 2 to configure AWS X-Ray for Amazon API Gateway REST APIs:
- Log in to the Amazon API Gateway console and select APIs from the left menu.
- Go to Stages.
- Select the stage and select the Logs/Tracing tab.
- Check the Enable X-Ray Tracing box.
- Click Save Changes to enable X-Ray tracing.
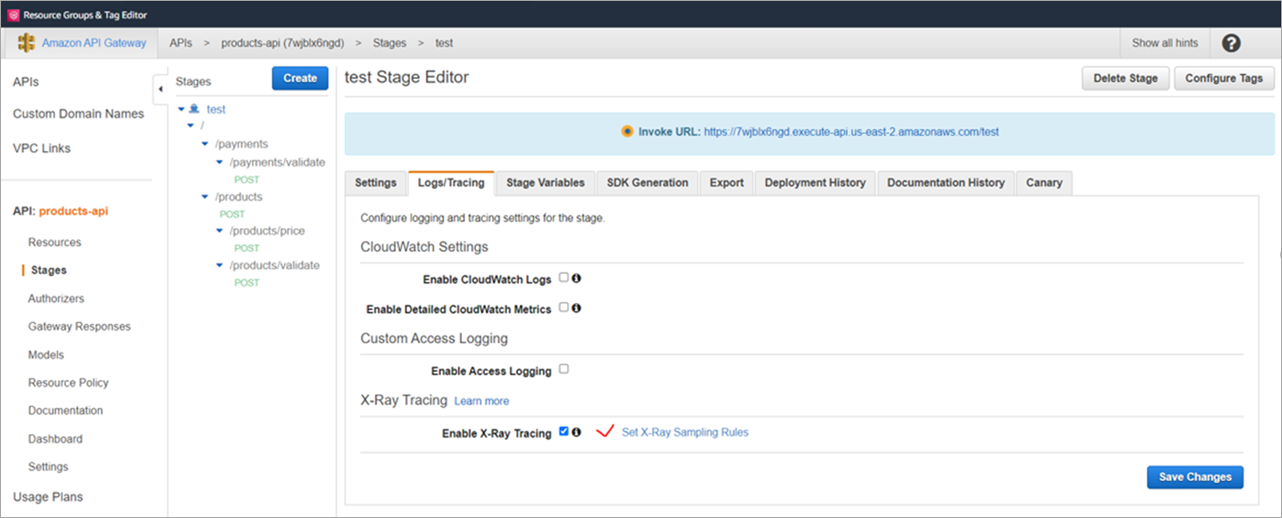
Figure 2 – Enabling AWS X-Ray for Amazon API Gateway.
AWS X-Ray Enablement on AWS Step Functions
Refer to the following steps to enable AWS X-Ray tracing for AWS Step Functions:
- Log in to the Step Functions console and select the state machine where we need to enable X-Ray.
- Click the Edit button at the top of the page.
- Enable X-Ray from the Logging section by ticking the Enable X-Ray tracing entry.

Figure 3 – Enabling AWS X-Ray for AWS Step Functions.
AWS X-Ray Enablement on Microservices
There are some code changes required to use AWS X-Ray in microservices application code. Below are the code snippets for enabling AWS X-Ray for a Spring Boot Java-based application:
- Add the following dependencies in pom.xml to enable X-Ray SDKs:
- Add the following maven dependencies to enable X-Ray SDK for RDS/SQL in pom.xml:
- Add the following config class in the microservice project package for AWS X-Ray-related configuration:
- To enable the traces to other microservices using Feign Client, add the AWSXRayFeignClientConfig class to the microservices project package:
- Annotation in service classes for method-level tracing:
.
To deploy method-level tracing, annotate your service methods with @XRayEnabled. You should see the complete call stack of the application, from the controller down through the service calls.
. - For getting trace details for a particular code snippet:
.
Wrap this code snippet within AWSXRay.beginSubSegment and AWSXRay.endSubSegment calls (you need to give a unique subsegment name to identify it in the tracing call stack):
AWS X-Ray Enablement on Amazon EC2
Amazon EC2 instances are used to host microservices in the solution. Below are the steps to enable X-Ray tracing on an Amazon EC2 instance.
- Install X-Ray daemon on the Amazon EC2 instance > download the X-Ray agent.
- Once the zip file for X-Ray daemon is downloaded, unzip the file, open the command prompt, and change the directory to the unzipped folder of X-Ray daemon.
- To start the X-Ray daemon, type the following command into the command prompt by replacing the AWS region with your corresponding region:
xray_windows.exe ./xray -o -n us-east-2
- For the X-Ray agent to have permission to send data to AWS X-Ray, save your credentials (API key and secret key) in the EC2 instance. It should be saved in your user directory under the .aws folder, and the file name should be “credentials.” The content of the file should appear as follows:
[default]
aws_access_key_id = <aws account user access key>
aws_secret_access_key = <aws account user secret>
Here the aws_access_key_id and the aws_secret_access_key are the aws IAM user access key and secret created during AWS IAM user account creation.
- Alternatively, create an AWS Identity and Access Management (IAM) policy allowing the EC2 instance to send X-Ray data.
. - The X-Ray setup for EC2 is ready now. Make sure Microsoft Defender is allowing port 80 and 443 traffic, otherwise the instance will not be accessible from the internet.
. - In your microservices X-Ray configuration, make sure the EC2 plugin is enabled as shown below:
AWS X-Ray Enablement on AWS Lambda
To toggle active tracing on your AWS Lambda function with the console, follow these steps:
- Open the Functions page of the Lambda console.
- Choose a function (for example, xray-lambda-application-dev-candidate).
- Choose Configuration and then select Monitoring and operations tools.
- Choose Edit.
- Under X-Ray, toggle on active tracing.
- Choose Save.

Figure 4 – Enabling AWS X-Ray monitoring for the AWS Lambda function.
To trace in Lambda function code level, use AWS X-Ray SDKs suitable for each coding language. The Lambda function will generate and send trace data for classes and methods to the X-Ray daemon.
Here is the sample code used for a Node.js application:
- Install Node.js SDK and save to package .json using the following command:
npm install aws-xray-sdk --save
- Use subsegment in code. Subsegments extend a trace’s segment with details about work done to serve a request. Each time you make a call with an instrumented client, the X-Ray SDK records the information generated in a subsegment.
See the following code snippet, which defines the segment and subsegment at the beginning of the code block:
- Finally, the subsegment has to close, as follows:
Sample Output of X-Ray Tracing
Figure 5 is the AWS X-Ray service map where you can see information about all of the APIs and downstream services deployed.
You can zoom the service map to see a trace view of API stages. The trace will display in-depth information regarding APIs represented as segments and subsegments.

Figure 5 – Sample service map created with AWS X-Ray.
Below is a more detailed timeline trace view generated for the API calls.

Figure 6 – Timeline view of end-to-end tracing with AWS X-Ray.
Conclusion
In this post, we described the architecture of AWS products using AWS X-Ray for observability and tracing for any application irrespective of technology. This approach helps an organization to quickly and easily set up AWS X-Ray distributed observability in a microservices-based architecture.
With the help of AWS X-Ray, you can understand how your application and its fundamental services are performing. This way, you can identify and debug the root cause of performance issues and errors.
AWS X-Ray provides an end-to-end view of requests as they travel through your application. This can be used for any modern application for observability and tracing.
.

.
DXC Technology – AWS Partner Spotlight
DXC Technology is an AWS Premier Tier Services Partner that understands the complexities of migrating workloads to AWS in large-scale environments, and the skills needed for success.
Contact DXC Technology | Partner Overview | AWS Marketplace | Case Studies