Category: CloudTrail
New CloudWatch Events – Track and Respond to Changes to Your AWS Resources
When you pull the curtain back on an AWS-powered application, you’ll find that a lot is happening behind the scenes. EC2 instances are launched and terminated by Auto Scaling policies in response to changes in system load, Amazon DynamoDB tables, Amazon SNS topics and Amazon SQS queues are created and deleted, and attributes of existing resources are changed from the AWS Management Console, the AWS APIs, or the AWS Command Line Interface (CLI).
Many of our customers build their own high-level tools to track, monitor, and control the overall state of their AWS environments. Up until now, these tools have worked in a polling fashion. In other words, they periodically call AWS functions such as DescribeInstances, DescribeVolumes, and ListQueues to list the AWS resources of various types (EC2 instances, EBS volumes, and SQS queues here) and to track their state. Once they have these lists, they need to call other APIs to get additional state information for each resources, compare it against historical data to detect changes, and then take action as they see fit. As their systems grow larger and more complex, all of this polling and state tracking can become onerous.
New CloudWatch Events
In order to allow you to track changes to your AWS resources with less overhead and greater efficiency, we are introducing CloudWatch Events today.
 CloudWatch Events delivers a near real-time stream of system events that describe changes in AWS resources. Using simple rules that you can set up in a couple of minutes, you can easily route each type of event to one or more targets: AWS Lambda functions, Amazon Kinesis streams, Amazon SNS topics, and built-in targets.
You can think of CloudWatch Events as the central nervous system for your AWS environment. It is wired in to every nook and cranny of the supported services, and becomes aware of operational changes as they happen. Then, driven by your rules, it activates functions and sends messages (activating muscles, if you will) to respond to the environment, making changes, capturing state information, or taking corrective action.
We are launching CloudWatch Events with an initial set of AWS services and events today, and plan to support many more over the next year or so.
Diving in to CloudWatch Events
The three main components that you need to know about are events, rules, and targets.
Events (represented as small blobs of JSON) are generated in four ways. First, they arise from within AWS when resources change state. For example, an event is generated when the state of an EC2 instance changes from pending to running or when Auto Scaling launches an instance. Second, events are generated by API calls and console sign-ins that are delivered to Amazon CloudWatch Events via CloudTrail. Third, your own code can generate application-level events and publish them to Amazon CloudWatch Events for processing. Fourth, they can be issued on a scheduled basis, with options for periodic or Cron-style scheduling.
Rules match incoming events and route them to one or more targets for processing. Rules are not processed in any particular order; all of the rules that match an event will be processed (this allows disparate parts of a single organization to independently look for and process events that are of interest).
Targets process events and are specified within rules. There are four initial target types: built-in, Lambda functions, Kinesis streams, and SNS topics, with more types on the drawing board. A single rule can specify multiple targets. Each event is passed to each target in JSON form. Each rule has the opportunity to customize the JSON that flows to the target. They can elect to pass the event as-is, pass only certain keys (and the associated values) to the target, or to pass a constant (literal) string.
CloudWatch Events in Action
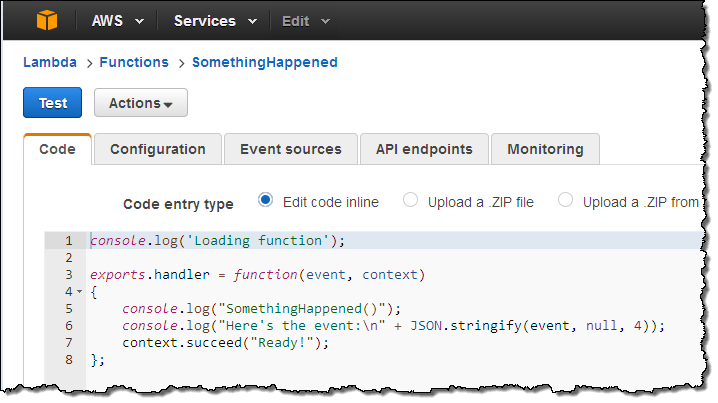
Let’s go ahead and set up a rule or two! I’ll use a simple Lambda function called SomethingHappened. It will simply log the contents of the event:
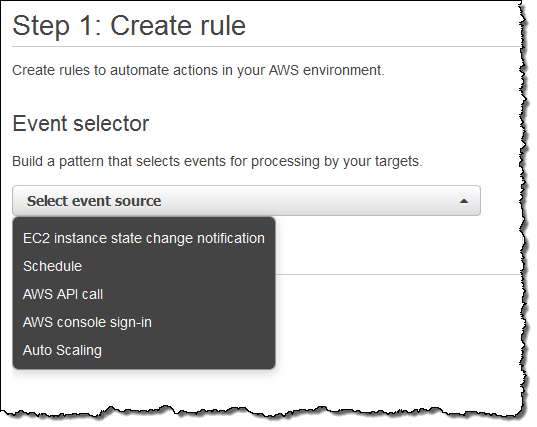
Next, I switch to the new CloudWatch Events Console, click on Create rule and choose an event source (here’s the menu with all of the choices):
Just a quick note before going forward. Some of the AWS services fire events directly. Others are fired based on the events logged to CloudTrail; you’ll need to enable CloudTrail for the desired service(s) in order to receive them.
I want to keep tabs on my EC2 instances, so I choose EC2 from the menu. I can choose to create a rule that fires on any state transition, or on a transition to one or more states that are of interest:
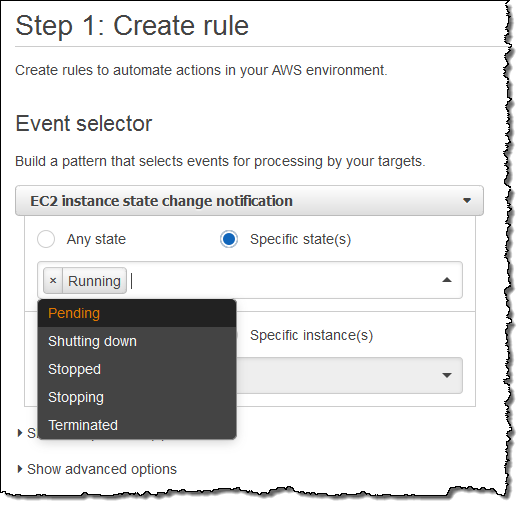
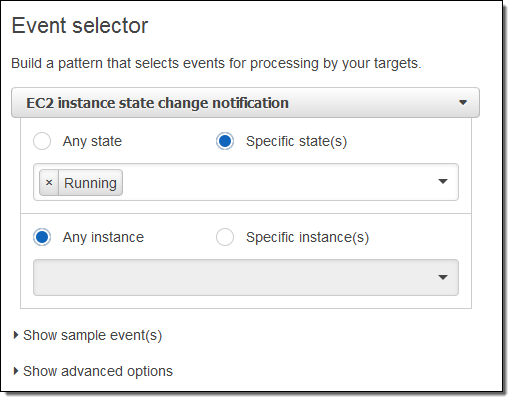
I want to know about newly launched instances, so I’ll choose Running. I can make the rule respond to any of my instances in the region, or to specific instances. I’ll go with the first option; here’s my pattern:
Now I need to make something happen. I do this by picking a target. Again, here are my choices:
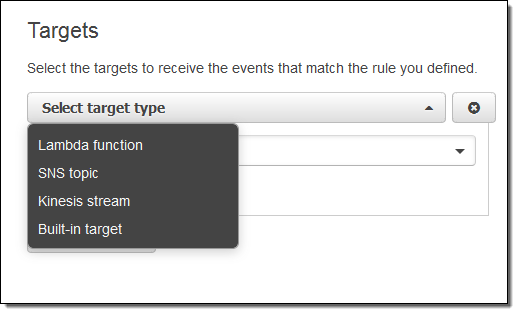
I simply choose Lambda and pick my function:
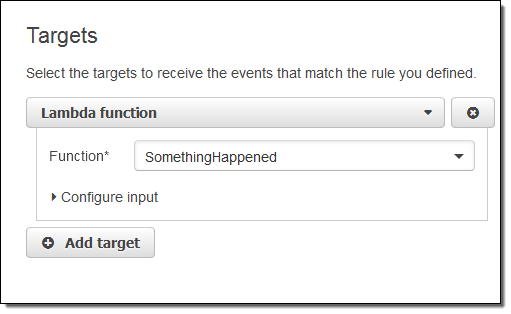
I’m almost there! I just need to name and describe my rule, and then click on Create rule:
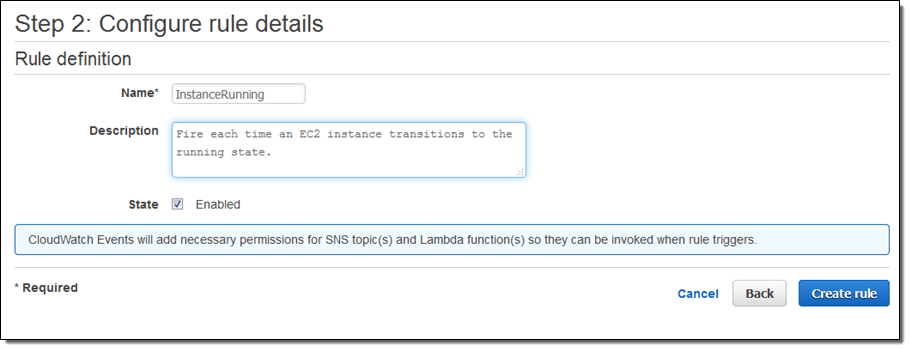
I click on Create Rule and the rule is all set to go:
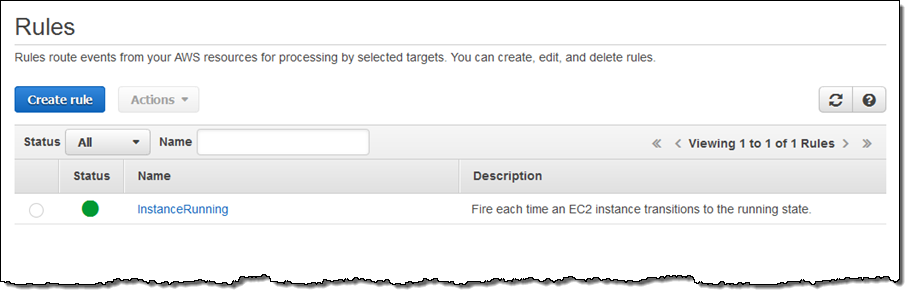
Now I can test it by launching an EC2 instance. In fact, I’ll launch 5 of them just to exercise my code! After waiting a minute or so for the instances to launch and to initialize, I can check my Lambda metrics to verify that my function was invoked:
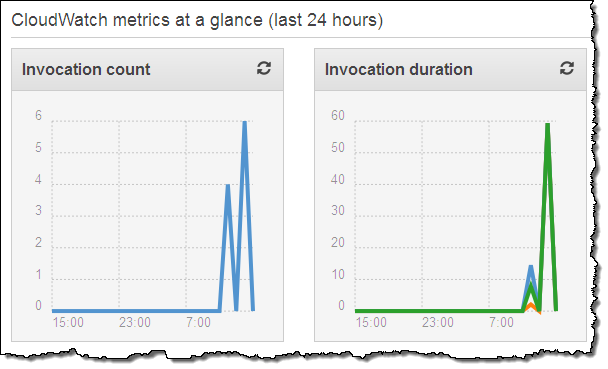
This looks good (the earlier invocations were for testing). Then I can visit the CloudWatch logs to view the output from my function:
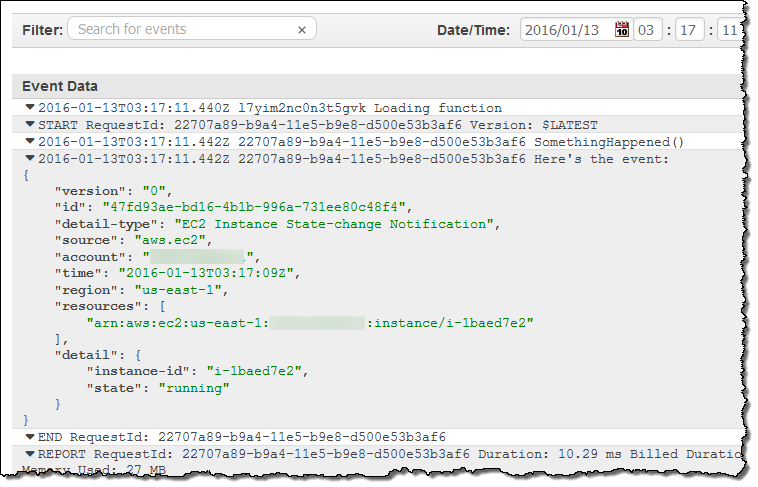
As you can see, the event contains essential information about the newly launched instance. Your code can call AWS functions in order to learn more about what’s going on. For example, you could call DescribeInstances to access more information about newly launched instances.
Clearly, a “real” function would do something a lot more interesting. It could add some mandatory tags to the instance, update a dynamic visualization, or send me a text message via SNS. If you want to do any (or all of these things), you would need to have a more permissive IAM role for the function, of course. I could make the rule more general (or create another one) if I wanted to capture some of the other state transitions.
Scheduled Execution of Rules
I can also set up a rule that fires periodically or according to a pattern described in a Cron expression. Here’s how I would do that:
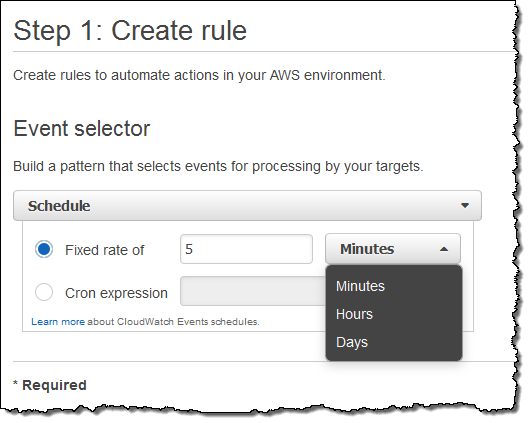
You might find it interesting to know that this is the underlying mechanism used to set up scheduled Lambda jobs, as announced at AWS re:Invent.
API Access
Like most AWS services, you can access CloudWatch Events through an API. Here are some of the principal functions:
PutRuleto create a new rule.PutTargetsandRemoveTargetsto connect targets to rules, and to disconnect them.ListRules,ListTargetsByRule, andDescribeRuleto find out more about existing rules.PutEventsto submit a set of events to CloudWatch events. You can use this function (or the CLI equivalent) to submit application-level events.
Metrics for Events
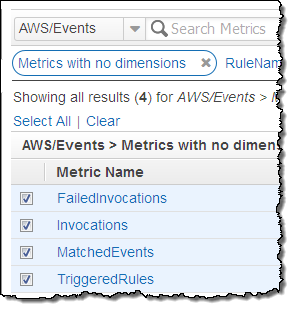
CloudWatch Events reports a number of metrics to CloudWatch, all within the AWS/Events namespace. You can use these metrics to verify that your rules are firing as expected, and to track the overall activity level of your rule collection.
 The following metrics are reported for the service as a whole:
- Invocations – The number of times that target have been invoked.
- FailedInvocations – The number of times that an invocation of a target failed.
- MatchedEvents – The number of events that matched one or more rules.
- TriggeredRules – The number of rules that have been triggered.
The following metrics are reported for each rule:
- Invocations – The number of times that the rule’s targets have been invoked.
- TriggeredRules – The number of times that the rule has been triggered.
In the Works
Like many emerging AWS services, we are launching CloudWatch Events with an initial set of features (and a lot of infrastructure behind the scenes) and some really big plans, including AWS CloudFormation support. We’ll adjust our plans based on your feedback, but you can expect coverage of many more AWS services and access to additional targets over time. I’ll do my best to keep you informed.
Getting Started
We are launching CloudWatch Events in the US East (Northern Virginia), US West (Oregon), Europe (Ireland), and Asia Pacific (Tokyo) regions. It is available now and you can start using it today!
— Jeff;
Amazon S3 Update – CloudTrail Integration
You can now use AWS CloudTrail to track bucket-level operations on your Amazon Simple Storage Service (S3) buckets. The tracked operations include creation and deletion of buckets, modifications to access controls, changes to lifecycle policies, and changes to cross-region replication settings.
AWS CloudTrail records API activity in your AWS account and delivers the resulting log files to a designated S3 bucket. You can look up API activity related to creating, deleting and modifying your S3 resources using the CloudTrail Console, including access to 7 days of historical data. You can also create Amazon CloudWatch Alarms to look for specific API activities and receive email notifications when they occur.
Effective today we are now logging actions on S3 buckets to CloudTrail in all AWS Regions. If you have already enabled CloudTrail, you do not need to take any further action in order to take advantage of this new feature. If you are not using CloudTrail, you can turn it on with a couple of clicks (read my introductory post – AWS CloudTrail – Capture API Activity) to learn more.
You can use the log files in many different ways. For example, you can use them as supporting evidence if you need to demonstrate compliance with internal or external policies. Let’s say that you store some important files in an S3 bucket. You can set up a CloudWatch Alarm that will fire if someone else in your organization makes changes to the bucket’s access control policy. This will allow you to verify that the change is in compliance with your policies and to take immediate corrective action if necessary.
You can also monitor creation and deletion of buckets, updates to life cycle policies, and changes to the cross-region replication settings.
— Jeff;
New – CloudTrail Integration with CloudWatch Logs; 2 Partner Solutions
As you may know, AWS CloudTrail records API activity in your AWS account and delivers a log file with the recorded API activity to a designated S3 bucket (see my post, AWS CloudTrail – Capture AWS API Activity, for more info). Earlier this year we announced CloudWatch Logs and gave you the ability to store and monitor OS and application log files. As I told you at the time, CloudWatch Logs gives you the ability to monitor for specific phrases, values or patterns.
CloudTrail, Meet CloudWatch
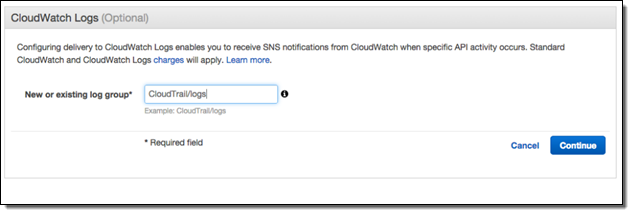
Today, we are announcing CloudTrail integration with CloudWatch Logs. This integration enables you to receive SNS notifications from CloudWatch, triggered by specific API activity captured by CloudTrail.
With SNS notifications, you can take immediate action when a pattern of interest is detected. You can contact the affected user to learn more, automatically create a trouble ticket, or initiate other troubleshooting operations. For example, you can create a CloudWatch Logs metric filter that watches for API calls related to a VPC, then create a CloudWatch metric and CloudWatch alarm and receive SNS notifications when the metric count exceeds the threshold values you specify.
Once you turn on this integration from the CloudTrail console, CloudTrail will deliver log files containing API activity to the CloudWatch log group that you specify:
As with any AWS feature, you can turn on this integration using the AWS Command Line Interface (CLI) or one of the AWS SDKs. CloudTrail will continue to deposit log files in the designated S3 bucket even after you enable this new integration feature.
Setting Metrics, Filters, and Alarms
Now that I have turned on the integration, I need to create CloudWatch metric filters, metrics and alarms to receive SNS notifications and take immediate action. Suppose I want to receive an SNS notification whenever an authorization failure occurs for your AWS account. We can set this up in three steps!
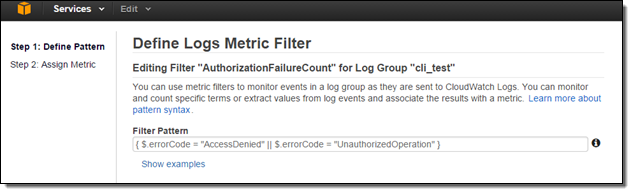
Since, CloudTrail provides an error code in its payload whenever an API call fails due to improper or insufficient permission, I can scan the CloudTrail events for the strings “AccessDenied” and “UnauthorizedOperation” using a Metric Filter:
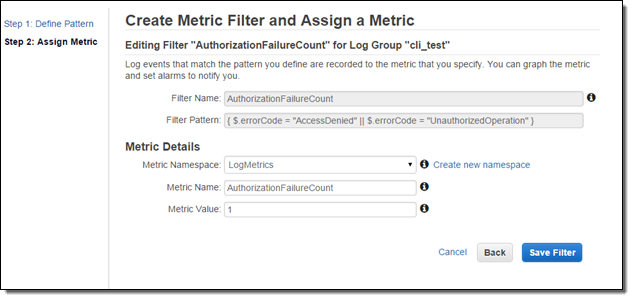
Now I need to set the filter up so that it generates a CloudWatch metric named “AuthorizationFailureCount” in the “LogMetrics” namespace. Each occurrence of “AccessDenied” or “UnauthorizedOperation” will increase the value (count) of the metric by 1:
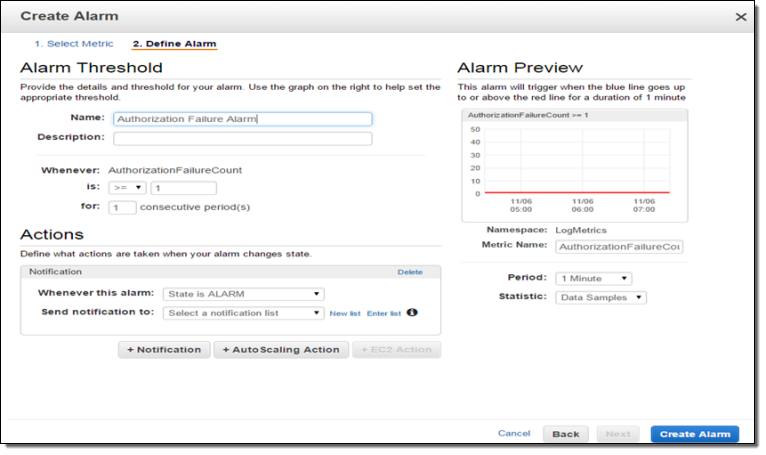
Now I can create a CloudWatch alarm and set up a threshold. Since I want to now about every authorization failure, I will set the alarm threshold so that the alarm will fire if one or more failures occur per minute. You can, of course, customize this as needed.
I can test this by creating an email subscription to my SNS topic and then initiating an operation that results in a failed authorization. The notification text will read as follows:
You are receiving this email because your Amazon CloudWatch Alarm “AuthorizationFailureCount” in the US – N. Virginia region has entered the ALARM state, because “Threshold Crossed: 1 datapoint (3.0) was greater than the threshold (1.0).” at “Wednesday 05 November, 2014 19:12:58 UTC
As you can see, the process of connecting CloudTrail to CloudWatch and setting up SNS notifications takes just a few minutes. The CloudTrail team is very interested in your feedback on this new feature. They are particularly interested in learning more about specific APIs and API activities you would like to monitor. Please visit the CloudTrail Forum and leave some feedback for them!
Pricing and Availability
This integration is currently available in the Regions where CloudWatch Logs are supported: US East (Northern Virginia),US West (Oregon), and Europe (Ireland). You will incur standard CloudWatch logs and CloudWatch charges.
Support from Partners
AWS Partners CloudNexa and Graylog2 have announced tools that analyze CloudTrail log files.
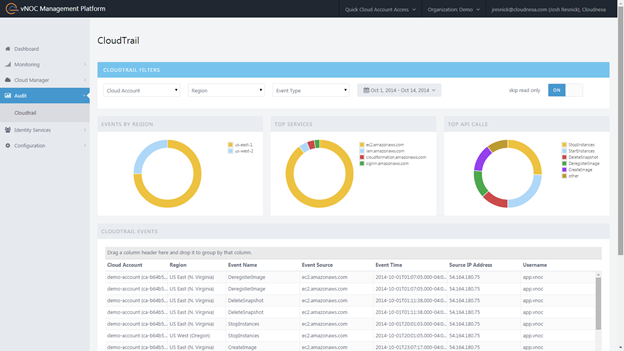
CloudNexa (a premier consulting partner and AWS reseller) provides Cloud Management as a Service. They are providing their new CloudTrail functionality at no charge at part of their vNOC Platform. You can use this tool to view CloudTrail events by region or to look at the most popular API Calls and most frequently used services. You can also filter out irrelevant events and quickly drill down to those that are of interest to you. Here’s a snapshot of the VNOC dashboard:
To learn more, visit their site or watch their one minute video.
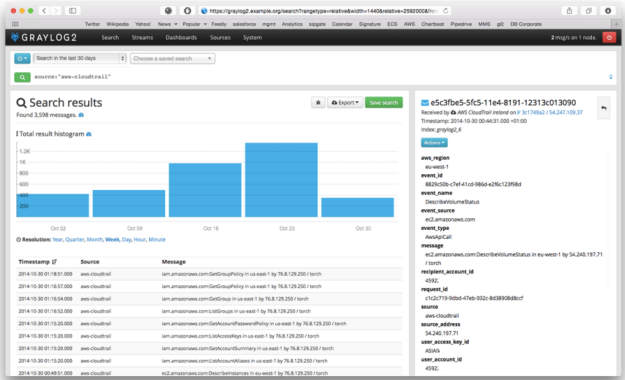
Graylog2 is an open source solution that allows you to combine log files from CloudTrail with your operating system or application logs. Once these events are ingested, Graylog2 enables you to perform quick searches on vast amounts of data, correlate events from multiple sources and create your dashboards on the data.
To learn more, visit their site or watch their one minute video.
— Jeff;
CloudTrail Expands Again – More Regions, More Services, Cool Partners
AWS CloudTrail records the API calls made in your AWS account and publishes the resulting log files to an Amazon S3 bucket in JSON format, with optional notification to an Amazon SNS topic each time a file is published.
Today I’m writing to provide you with more information on new releases from CloudTrail and to share some really cool tools and use cases that have been implemented by some of the CloudTrail Partners.
Regional Expansion
Effective immediately, CloudTrail is now available in three more AWS Regions. Here is the complete list:
 US East (Northern Virginia)
- US West (Northern California)
- US West (Oregon)
- Asia Pacific (Sydney)
- EU (Ireland)
- Asia Pacific (Tokyo) – New!
- Asia Pacific (Singapore) – New!
- South America (So Paulo) – New!
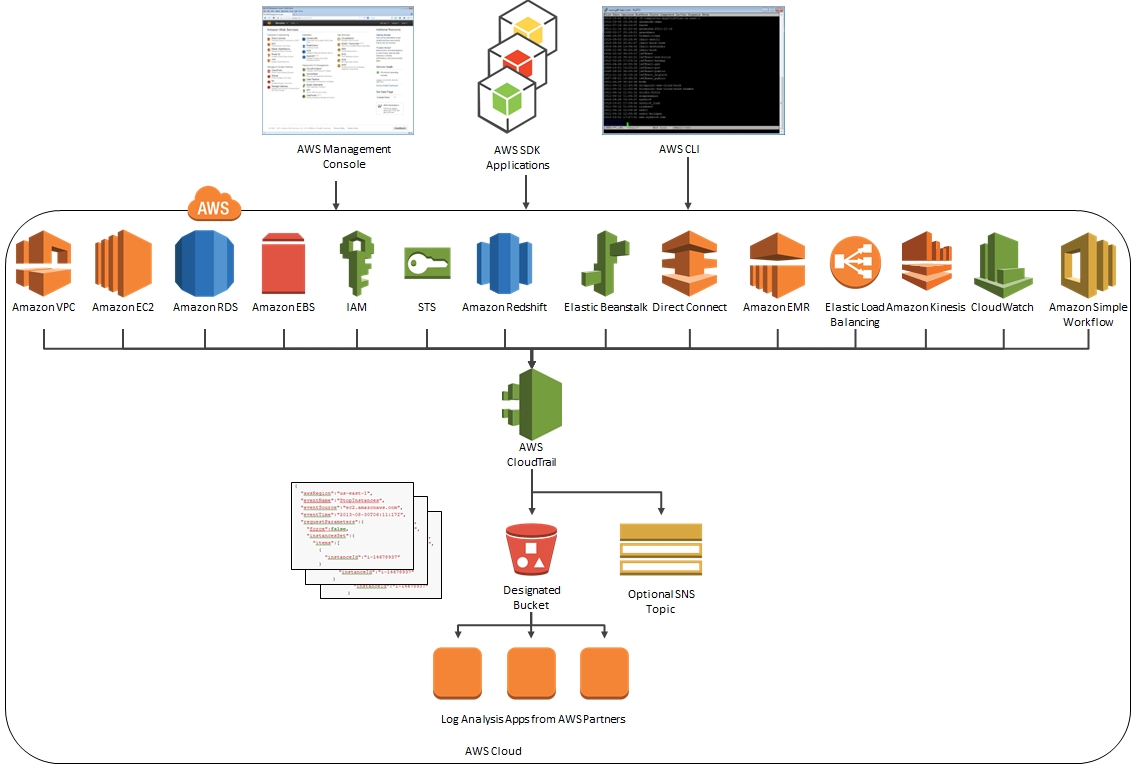
The Big Picture, Once More
Here’s the latest and greatest version of the diagram that I first presented when we launched CloudTrail:
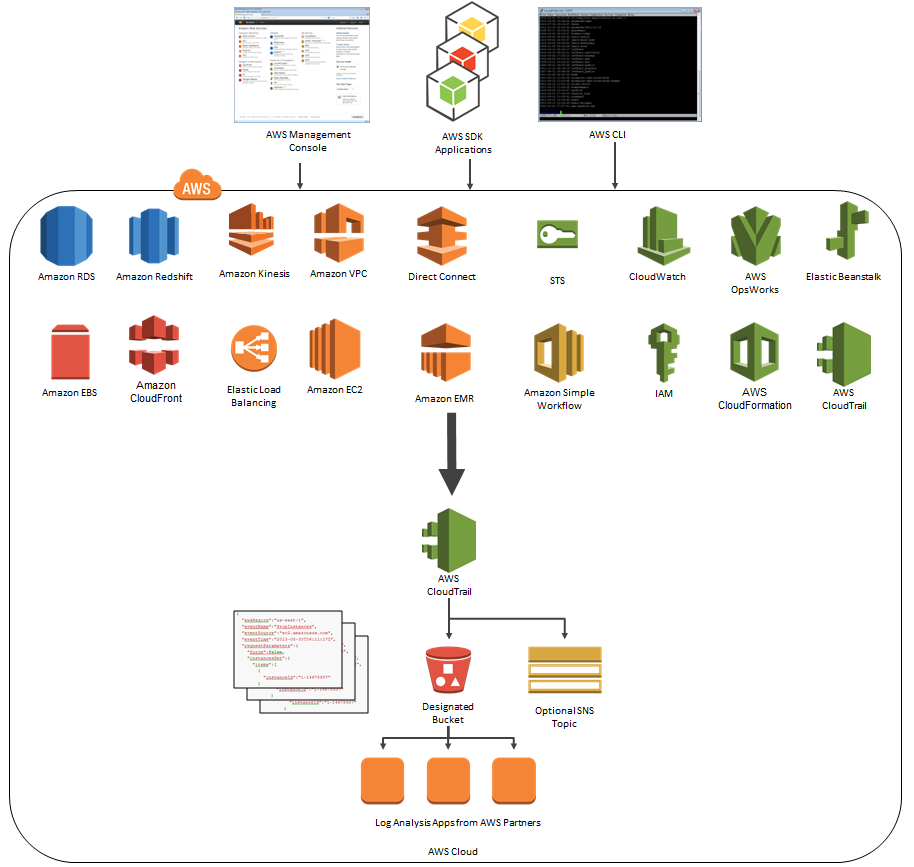
As you can see, CloudTrail can now record API calls made by eighteen AWS services! Earlier this month, we quietly added support for Amazon CloudFront and AWS CloudTrail.
Logentries and CloudTrail
 Logentries is designed to make business insights from machine-generated log data easily accessible to development, IT, and business operations teams of all sizes. The Logentries architecture is designed to manage and provide insights into huge amounts of data across their diverse, global user community. You can sign up for a free Logentries trial and be up and running within minutes.
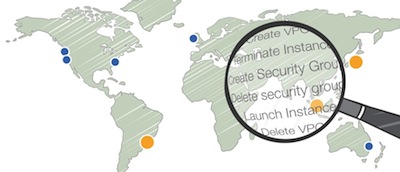
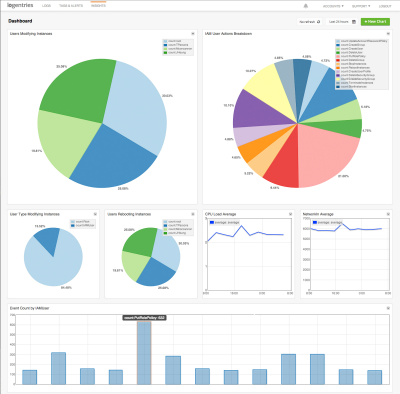
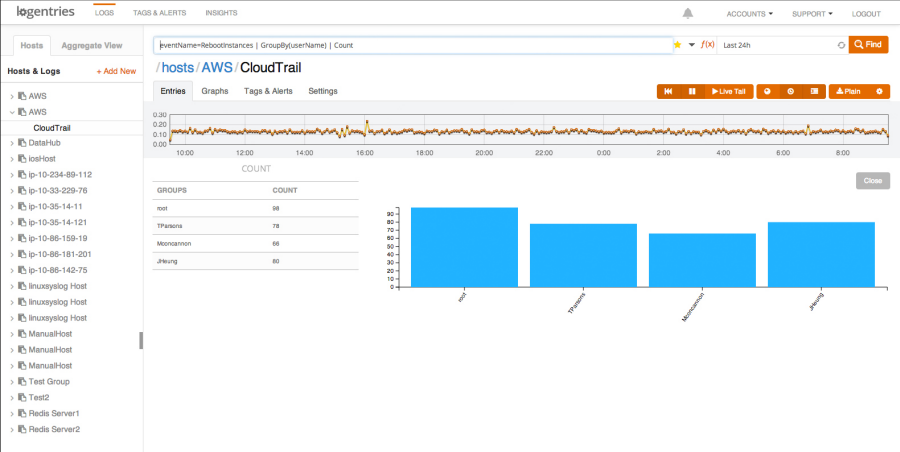
The Logentries team shared a cool, security-oriented use case that is made possible by their integration with AWS CloudTrail (read the Logentries CloudTrail Integration Documentation to learn more). Logentries provides pre-defined queries for important events so that you do not have to write complex queries. Additionally, Logentries provides out of the box tagging and alerting to highlight and notify you when an important security event takes place. For example, you can get notified via email or iPhone alert or you can have a message sent to a third-party service or API such as Pagerduty, Hipchat, or Campfire when any of the following occur:
- EC2 Security Group created, deleted, or edited
- New IAM user is created
- User’s IAM permissions are changed
Here is a screenshot of the alerts that Logentries provides out of the box:
And here’s a short video of Logentries in action:
Datadog and CloudTrail
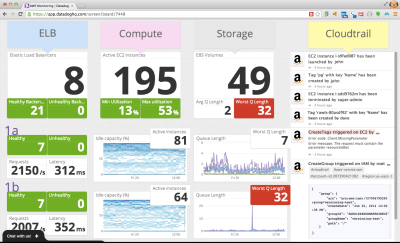 Datadog is a cloud monitoring service for IT, operations and development teams who run applications at scale. Datadog allows users to quickly troubleshoot availability and performance issues by automatically correlating change events and performance metrics from AWS CloudTrail, AWS Cloudwatch and many other sources.
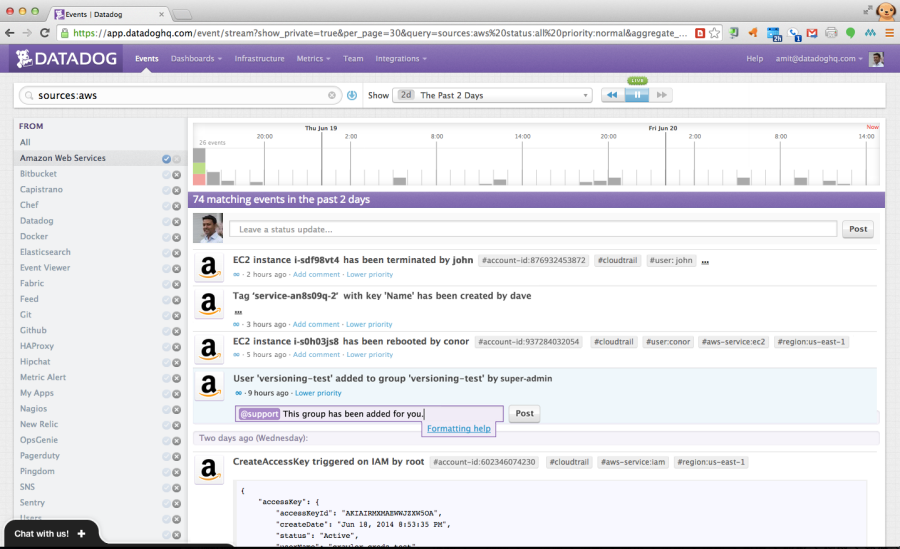
Datadog can overlay CloudTrail logs with metric collected from other systems to show how the metrics respond to AWS events. This allows you to investigate and understand cause and effect relationships.
Datadog can quickly find specific CloudTrail events and put them in context for you. You can collaborate with teammates using threaded discussions that are linked to CloudTrail logs:
— Jeff;
AWS CloudTrail Expands Again – More Locations and Services
AWS CloudTrail records the API calls made in your AWS account and publishes the resulting log files to an Amazon S3 bucket in JSON format, with optional notification to an Amazon SNS topic each time a file is published.
Earlier this month we expanded CloudTrail’s service coverage with the addition of support for seven more services. Today we adding support for the Simple Workflow Service and are also making CloudTrail available in three additional AWS Regions:
- US West (Northern California)
- Asia Pacific (Sydney)
- EU (Ireland)
Note: If you have configured CloudTrail to store log files generated in multiple AWS Regions in the same S3 bucket, you will have to update the bucket’s policy statement so that it can accept logs from the new Regions. To do this, visit the Amazon S3 Bucket Policy section in the CloudTrail documentation. If CloudTrail creates the bucket on your behalf, it will also apply a policy that allows access from all of the Regions that exist at the time.
The Big Picture
Here’s the latest and greatest version of the diagram that I first presented when we launched CloudTrail:
CloudTrail Webinar With Splunk
 At 10:00 AM PT on May 20, AWS and Splunk will present the Stronger Security and Compliance on AWS with Log Collection and Analysis webinar. In the webinar you will learn how CloudTrail collects and stores your AWS log files so that software from Splunk can be used as a Big Data Security Information and Event Management (SIEM) system. You will hear how AWS log files are made available for many security use cases, including incident investigations, security and compliance reporting, and threat detection/alerting. FINRA (a joint Splunk/AWS customer) will explain how they leverage Splunk on AWS to support their cloud efforts.
— Jeff;
AWS May Webinars – Focus on Security
We have received a lot of great feedback on the partner webinars that we held in April. In conjunction with our partners, we will be holding two more webinars this month. The webinars are free, but space is limited and preregistration is advisable.
 In May we are turning our focus to the all-important topic of security, and what it means in the cloud. When I first started talking about cloud computing, audiences would listen intently, and then ask “But what about security?” This question told me two things. First, it told me that the questioner saw some real potential in the cloud and might be able to use it on some mission-critical applications. Second, that it was very important that we share as much as possible about the security principles and practices within and around AWS. We built and maintain AWS Security Center and have published multiple editions of the Overview of Security Processes.
In our never-ending quest to keep you as fully informed as possible about this important topic, we have worked with two APN Technology Partners to bring you some new and exciting information.
May 20 – Log Collection and Analysis (Splunk and CloudTrail)
At 10:00 AM PT on May 20, AWS and Splunk will present the Stronger Security and Compliance on AWS with Log Collection and Analysis webinar. In the webinar you will learn how CloudTrail collects and stores your AWS log files so that software from Splunk can be used as a Big Data Security Information and Event Management (SIEM) system. You will hear how AWS log files are made available for many security use cases, including incident investigations, security and compliance reporting, and threat detection/alerting. FINRA (a joint Splunk/AWS customer) will explain how they leverage Splunk on AWS to support their cloud efforts.
May 28 – Federated Single Sign-On (Ping Identity and IAM)
At 10:00 AM PT on May 28, AWS and Ping Identity will present the Get Closer to the Cloud with Federated Single Sign-On webinar.
In the webinar you will learn how the Ping Identity platform offers federated single sign-on (SSO) to quickly and securely manage authentication of partners and customers through seamless integration with the AWS Identity and Access Management service. You will also hear from Ping Identity partner and Amazon Web Services Customer, Geezeo. They will share best practices based on their experience.
Again, these webinars are free but I strongly suggest that you register ahead of time for best results!
— Jeff;
AWS CloudTrail Update – Seven New Services & Support From CloudCheckr
AWS CloudTrail records the API calls made in your AWS account and publishes the resulting log files to an Amazon S3 bucket in JSON format, with optional notification to an Amazon SNS topic each time a file is published.
Our customers use the log files generated CloudTrail in many different ways. Popular use cases include operational troubleshooting, analysis of security incidents, and archival for compliance purposes. If you need to meet the requirements posed by ISO 27001, PCI DSS, or FedRAMP, be sure to read our new white paper, Security at Scale: Logging in AWS, to learn more.
Over the course of the last month or so, we have expanded CloudTrail with support for additional AWS services. I would also like to tell you about the work that AWS partner CloudCheckr has done to support CloudTrail.
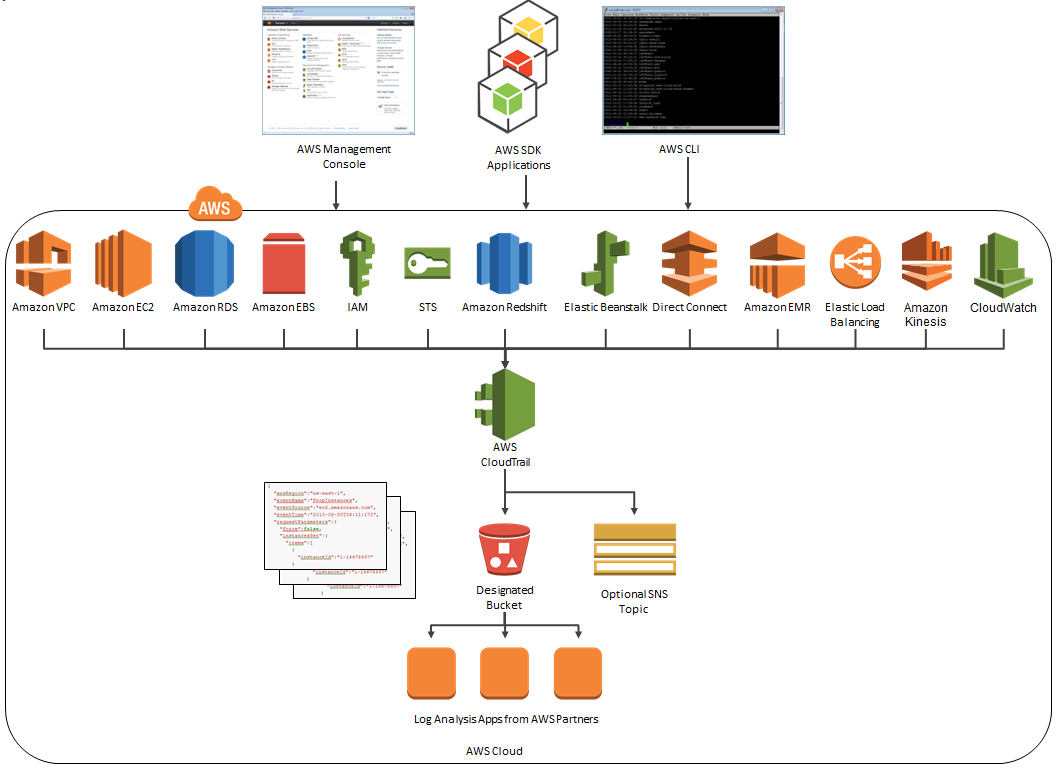
New Services
At launch time, CloudTrail supported eight AWS services. We have added support for seven additional services over the past month or so. Here’s the full list:
- Amazon EC2
- Elastic Block Store (EBS)
- Virtual Private Cloud (VPC)
- Relational Database Service (RDS)
- Identity and Access Management (IAM)
- Security Token Service (STS)
- Redshift
- CloudTrail
- Elastic Beanstalk – New!
- Direct Connect – New!
- CloudFormation – New!
- Elastic MapReduce – New!
- Elastic Load Balancing – New!
- Kinesis – New!
- CloudWatch – New!
Here’s an updated version of the diagram that I published when we launched CloudTrail:
News From CloudCheckr
CloudCheckr (an AWS Partner) integrates with CloudTrail to provide visibility and actionable information for your AWS resources. You can use CloudCheckr to analyze, search, and understand changes to AWS resources and the API activity recorded by CloudTrail.
Let’s say that an AWS administrator needs to verify that a particular AWS account is not being accessed from outside a set of dedicated IP addresses. They can open the CloudTrail Events report, select the month of April, and group the results by IP address. This will display the following report:
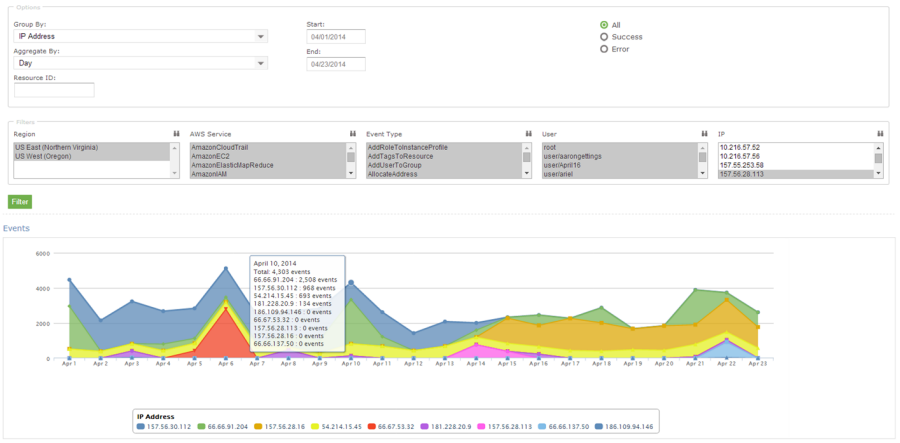
As you can see, the administrator can use the report to identify all the IP addresses that are being used to access the AWS account. If any of the IP addresses were not on the list, the administrator could dig in further to determine the IAM user name being used, the calls being made, and so forth.
CloudCheckr is available in Freemium and Pro versions. You can try CloudCheckr Pro for 14 days at no charge. At the end of the evaluation period you can upgrade to the Pro version or stay with CloudCheckr Freemium.
— Jeff;
