AWS Partner Network (APN) Blog
Enhancing Fact-Based Decision Making Using Tech Mahindra’s SMART Observability Tool on AWS
By Kannan Ganesan, Solution Architect – Tech Mahindra
By Midhun N S, Technical Lead – Tech Mahindra
By Naveen Kumar Singh, Product Manager – Tech Mahindra
By Nitin Chahar, Sr. Partner Solutions Architect – AWS
 |
| Tech Mahindra |
 |
As companies adopt a cloud-first strategy, ITOps and DevOps require a single view of application services and infrastructure so they can be equipped with the right observability solution to ensure stable cloud and container infrastructure for modern apps.
Observability lets you determine what’s important by watching how the system performs over time, and ask new questions using metrics, logs, or traces. This provides greater control over complex systems with rich contextual information, letting you understand why a system is or is not meeting your service-level objectives (SLOs).
Observability is informed by key business drivers, rather than focusing only on component-level insights related to faults, configuration, accounting, performance, and security.
Building a custom observability solution, on the other hand, requires a skilled team and considerable development time.
Tech Mahindra, an AWS Premier Tier Services Partner, has identified a few gaps that lead to complexities in performance monitoring and management. The result is the need for a tool that covers assumptions, hypotheses, and discoveries to address these gaps and enhance fact-based decision making.
Tech Mahindra’s smart monitoring and resolution tool is called SMART and is built on top of Amazon Web Services (AWS) observability and telemetry tools. It introduces pre-configured dashboards for common use cases, and also provides professional services engagement for any custom feature requirement.
In this post, we will look at SMART version 1.0 and how it helps enhance a fact-based cloud monitoring approach for infrastructure and application monitoring.
SMART is integrated with Amazon CloudWatch, AWS X-Ray, Amazon OpenSearch Service, and more. It uses metrics, traces, and logs to provide a single pane of glass view into systems running enterprise applications. Thus, it helps enhance application monitoring and assist in root cause analysis.
Getting Started with SMART
The SMART observability tool has three primary layers:
- Outer layer: SMART dashboards on Amazon Managed Grafana.
- Middle layer: AWS services for instrumenting applications and infrastructure services.
- Inner layer: Monitored services, webservers, and applications.
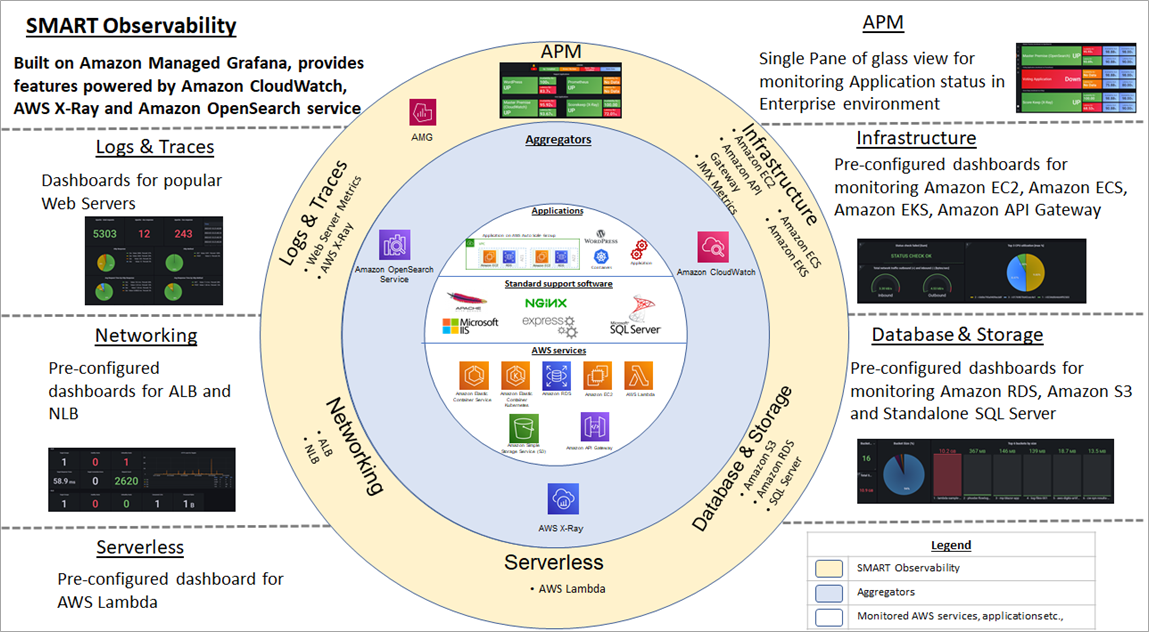
Figure 1 – SMART observability tool overview.
This solution is available as a Terraform file with JSON templates once the client signs up for SMART. Customers can deploy the same in Amazon Managed Grafana by using multiple options.
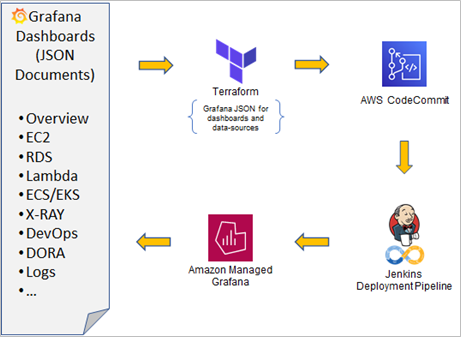
Figure 2 – Sample SMART deployment approach.
Below, Figure 3 highlights the overview of roles and responsibilities of deploying SMART. Tech Mahindra will provide the packaged JSON files, which customers can install through a pipeline into Amazon Managed Grafana while ensuring all prerequisites are configured and available, user roles and access rights are set up, and SSO/SAML configuration are met.
Amazon Managed Grafana data sources need to be configured based on the data sources and services being used. Refer to the corresponding data source documentation for more details:
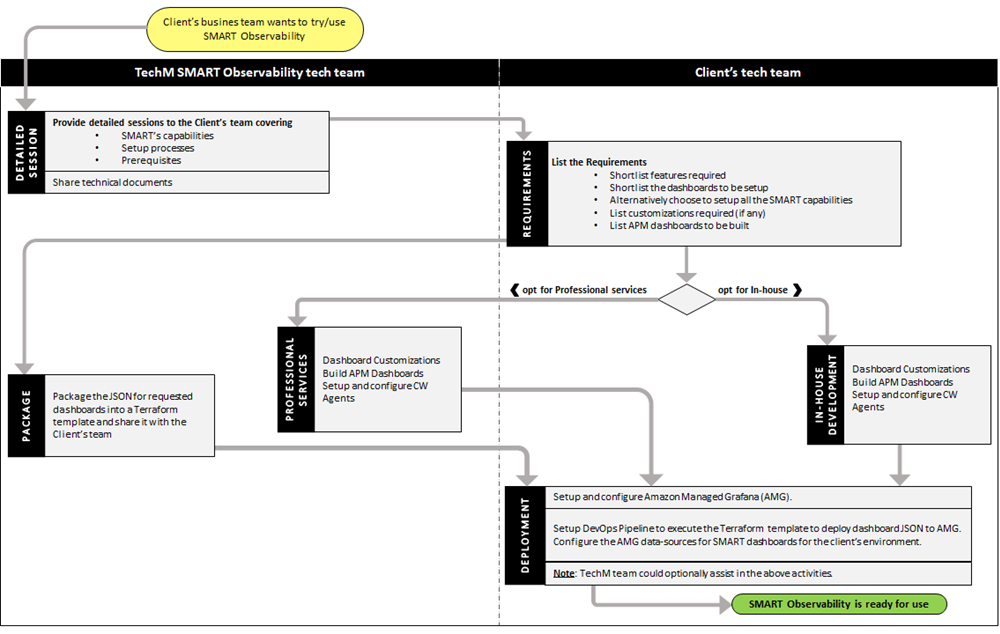
Figure 3 – Roles and responsibilities for SMART deployment.
Solution Overview
The SMART observability tool’s landing dashboard serves as the starting point for users to explore and access the tool’s features.

Figure 4 – SMART landing dashboard.
The landing dashboard has three main sections:
- Application monitoring: Shows status of instrumented applications in an enterprise environment.
- Summary: Quick summary of commonly used AWS services.
- Menu: For navigating the dashboards organized by categories
To help with ease of maintenance, dashboards are organized in a folder structure grouped by categories which support the notion of a single-pane view of related dashboards.
Core features of SMART are organized around the application monitoring and pre-configured dashboards, which include infrastructure monitoring (compute, database, webserver).
SMART dashboards have been designed for optimal monitoring as an out-of-the-box feature. However, there is a custom option available for customers to build their dashboards or tweak them suited to their needs. For example, users can add additional metrics, change panel styles, and update dashboard layouts.
Application Monitoring
To measure the health of applications in an enterprise environment, SMART displays dashboards based on functional grouping. In the current version of SMART 1.0, service-level indicators (SLIs) are computed by querying the underlying metrics sources for Amazon CloudWatch, AWS X-Ray, Amazon OpenSearch Service, and open-source Prometheus.
These SLIs reveal the performance of the application and help to improve the reliability of the system, while also improving it as it grows over time. This can be extended to any number of applications in the account.
The status and key site reliability engineering (SRE) metrics available in a single pane of glass in an account help an SRE to make a call on the application health and decisions on new feature additions, rollbacks, and identify performance bottlenecks.
Approach to Monitoring
This section describes the health monitoring approach adapted by SMART and how CloudWatch, AWS X-Ray, Amazon OpenSearch Service, and Prometheus are used for monitoring.
Application Status
Application health status is determined based on the count of heartbeats and requests with HTTP 5xx errors within a time interval selected on Grafana in SMART. The display status of application is shown with color coding as indicated below.
| Status | Color | Description |
| Up | Green | Application is healthy within the monitored time-window. Heartbeats are active and no HTTP 5xx errors (server errors) detected. |
| Server errors | Amber | HTTP 5xx errors detected within the monitored time-window, while heartbeats are active. |
| Down | Red | Application is considered unhealthy/down when no heartbeats are detected. |
Note that the monitored time window is the time interval selected on Grafana. A time interval of one minute with auto refresh is ideally suited for health monitoring.
Availability SLI
For SMART 1.0, availability SLI is defined as (SLI = Good-Requests ÷ Valid-Requests). This is achieved by using requests with HTTP 2xx responses (excluding heartbeats) as Good-Requests while all requests excluding heartbeats are considered as Valid-Requests.
Latency SLI
For SMART 1.0, following the same SLI definition as above, requests with HTTP 2xx responses (excluding heartbeats) of less than a predefined response time are considered Good-Requests. All requests excluding heartbeats are considered as Valid-Requests.
Leveraging AWS Data Sources for Monitoring
AWS provides Amazon CloudWatch, AWS X-Ray, and Amazon OpenSearch Service for instrumenting applications. SMART leverages these data sources as out-of-the-box features to derive application status and compute availability and latency SLIs for enterprise applications to provide a single plane of glass view.
In addition, SMART uses Prometheus to provide the breadth of data sources. It also provides use of other data sources such as Amazon Managed Prometheus, Amazon Athena, Amazon Timestream, and Amazon Redshift as customizable options.
- Amazon CloudWatch: SMART uses CloudWatch logs to capture webserver logs, and then uses metric filters to derive metrics out of webserver logs. These metrics are used to derive application status and compute availability and latency SLIs.
- AWS X-Ray: SMART leverages the AWS X-Ray traces from instrumented applications to derive application status and compute availability and latency SLIs.
- Amazon OpenSearch Service: SMART leverages the logs captured in OpenSearch domain through Filebeat and Logstash to derive application status and compute availability and latency SLIs.
- Prometheus: SMART leverages Blackbox exporter in conjunction with open-source Prometheus for HTTP-based monitoring to derive application status and compute availability and latency SLIs. From Amazon Managed Grafana, the Prometheus data source is used to query the status.
Preconfigured Dashboards
The SMART observability tool provides curated dashboards organized by categories (as in the table below) to facilitate simplified visualization of metrics from related services.
| Dashboards | Description |
| Infrastructure | Single pane of glass view to monitor modern compute services like Amazon EC2, Amazon ECS, and API management services like Amazon API Gateway. |
| Database and Storage | Single pane of glass view for monitoring relational database and object storage services like Amazon RDS and Amazon S3. |
| Serverless | For monitoring serverless services such as AWS Lambda. |
| Networking | For monitoring networking services like Application Load Balancer and Network Load Balancer. |
| Webserver Metrics | Specialized dashboards for monitoring popular webservers through metrics derived from the webserver access logs. This includes NGINX, Apache, IIS, Node Express, and Tomcat. |
| Traces | Dashboard for AWS X-Ray service. |
| Java Applications (Containers | Dashboard for monitoring JVM parameters like memory, Garbage Collector, and threads for Java applications running on Amazon ECS and Amazon EKS. |
| SQL Server Database | Dashboard for monitoring self-managed SQL Server hosted on premises or on other cloud platforms. Leverages CloudWatch agent to collect SQL Server performance counters and push them to Amazon CloudWatch as custom metrics. |
Infrastructure
The “Infrastructure” home dashboard provides useful metrics for the compute service Amazon Elastic Compute Cloud (Amazon EC2) and the API management service Amazon API Gateway to help operations teams detect faults and act on it.
For instance, in an enterprise environment with a dozen EC2 instances, the “Top 3 CPU Utilization Panel” helps identify an EC2 instance consuming too much processing power, which may be due to application request overload or an application malfunction. Similarly, the API Gateway 5xx error count going high is an indication of issues in downstream services requiring attention.
Infrastructure includes detailed dashboards for compute services like EC2, Amazon Elastic Container Service (Amazon ECS) and Amazon Elastic Kubernetes Service (Amazon EKS). These dashboards are based on standard CloudWatch metrics and grouped for easier visualization. The EC2 dashboard also includes custom metrics obtained from CloudWatch agent.
To keep track of Java applications running on Amazon ECS and EKS in an enterprise framework, SMART provides a JMX metrics dashboard to get insights into Java Virtual Machine (JVM) threads, Garbage Collector, and memory.
Database and Storage
The intention of the “Database and Storage” category is to provide a single pane of glass view for object storages and relational databases. Presently, this includes Amazon Simple Storage Service (Amazon S3) and Amazon Relational Database Service (Amazon RDS). Key metrics displayed on the home page provide operations teams with hints about ongoing issues requiring attention.
For example, the dashboard includes “Top 6 buckets by size” which indicates if a specific bucket is growing. That, in turn, could be an alarm to SRE if an application has stopped processing files from that bucket and resulting in the ever-growing bucket size.
Similarly, the dashboard provides key RDS metrics which could help identify persistent high database connections indicating a malfunction in application or a possible surge in users.
Standalone SQL Server
This dashboard is unique to SMART and is targeted at the widely-used SQL Server database hosted and managed by users in hybrid cloud or on-premises Windows Server.
This leverages CloudWatch agent for gathering SQL Server performance data through Windows OS performance counters and sending it to Amazon CloudWatch, which is then displayed on a SQL Server dashboard. This dashboard is a value add for AWS customers with self-managed SQL Servers on premises, on EC2 instances, or on other cloud environments.
Webserver Dashboards
In the present world of web applications, webservers are one of the most commonly used software systems to host and serve web applications. Webservers typically support access logs which are used to capture request-responses and is a rich source of information to troubleshoot issues.
SMART leverages these access logs to derive useful metrics for popular webservers as listed below:
- NGINX
- Apache (httpd)
- IIS
- Node Express
- Tomcat
Below are some of the metrics derived through the webserver access logs:
- Request count: Total requests, 4xx response, 5xx response
- 5xx log count time-series plot (based on CloudWatch metrics filter)
- Total log count time-series plot (based on CloudWatch metrics filter)
- Request count by HTTP status
- Request count by HTTP method
- Request count by user agent
- Request count by remote IP
- Latest 20 logs
- Latest 20 4xx logs
- Latest 20 5xx logs
These help operators gain insights ranging from application health (5xx errors) to the request distributions by browsers and clients. It also helps to analyze issues with server errors and latencies.
AWS X-Ray Dashboard
AWS X-Ray is a distributed tracing system to help understand service performance and troubleshoot the root cause of performance issues and errors. This dashboard provides a single-pane view showing trace statistics, service map, trace analytics (error root cause, fault root cause, response time root cause), and the traces for errors, faults, and response time all in one place.
Serverless and Networking
The “Serverless” category provides a dashboard for AWS Lambda that is based on CloudWatch metrics. Similarly, the “Networking” category provides dashboards for Application Load Balancer and Network Load Balancer, and these dashboards are based on CloudWatch metrics.
Example: Monitoring Through SMART
This section details an illustrative example application running on AWS monitored through the SMART observability tool.
The figure below shows common AWS resources grouped under Run, instrumented by AWS services under Ops, and monitored through SMART.
The Run group comprises AWS services such as Amazon EC2, Amazon RDS, AWS Lambda, Amazon S3, Application Load Balancer, Amazon API Gateway, Amazon ECS, and Amazon EKS. These resources are instrumented via one of more of the AWS services such as Amazon CloudWatch, AWS X-Ray, and Amazon OpenSearch Service.
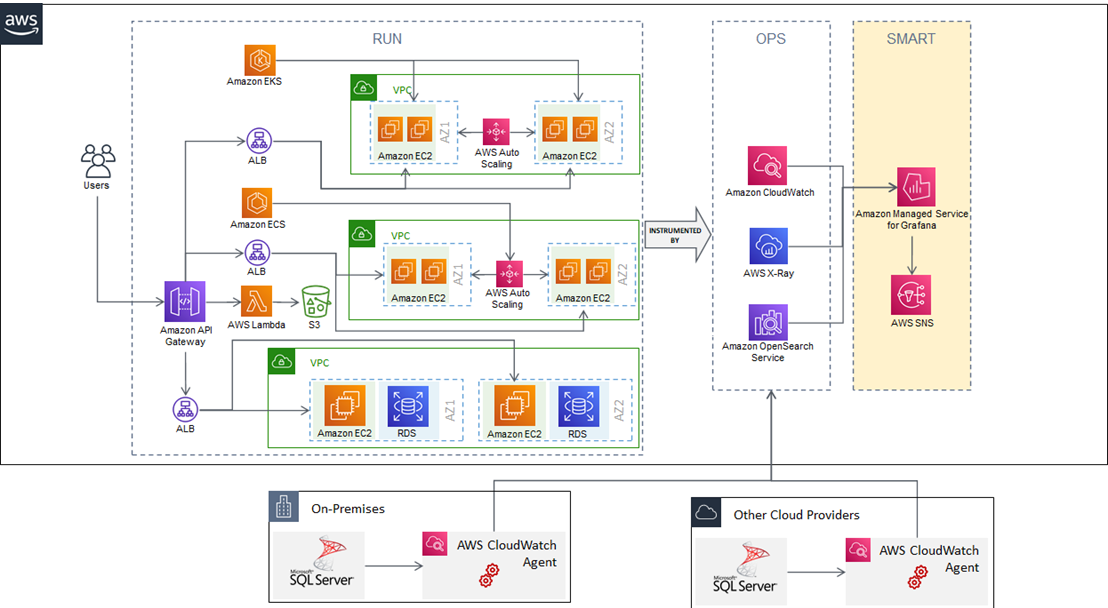
Figure 5 – Illustrative application to showcase monitoring through SMART.
The SMART dashboards on Amazon Managed Grafana rely on data sources to connect and query aggregating services such as CloudWatch, AWS X-Ray, and Amazon OpenSearch Service, and then to display relevant metrics on dashboards.
The diagram above also shows self-managed SQL Server hosted on premises and on another cloud. A CloudWatch agent pushes SQL Server performance counters as metrics into CloudWatch for visualization of self-managed SQL Servers.
Summary
Tech Mahindra’s SMART observability tool is built on top of AWS-native monitoring solutions and provides a single pane of glass view into systems running enterprise applications.
By using and analyzing metrics, traces, and logs, SMART helps organizations to perform root cause analysis. Thus, it can provide a gateway into the world of automation and artificial intelligence (AI)-driven troubleshooting.
SMART is an easily configurable tool with no lock-in period. It has been designed in a way that it doesn’t force enterprises to search for additional DevOps skills for implementing and using it.
Any specific feature additions or custom requirements that are not available in version 1.0 can be addressed through professional services engagement. To implement SMART for your AWS environment, contact your AWS representative or Tech Mahindra.
.

.
Tech Mahindra – AWS Partner Spotlight
Tech Mahindra is an AWS Premier Tier Services Partner and MSP that specializes in digital transformation, consulting, and business re-engineering solutions.