AWS Partner Network (APN) Blog
How Capgemini is Enabling Organizations and Employees to Return to the Office Using AWS Services
By Siji Kallarakal, AWS Solution Architect – Capgemini
By Prabhu Padayachi, Data Scientist – Capgemini
By Vivek Dashore, Data Architect – Capgemini
By Sriram Kuravi, Sr. Partner Management Solutions Architect – AWS
 |
| Capgemini |
 |
As the world continues to respond to COVID-19, Capgemini is working to find ways to prepare our communities for such pandemics in the future.
During this extraordinary time, digital solutions have played a crucial role in enabling employees to work remotely. When organizations begin stabilizing normal office operations, there will be a need to create a robust crisis response system. Key areas for businesses to focus on include workforce enablement, crisis management, and operations.
In the pandemic, many organizations are limiting the number of employees within their offices. A business must ensure its employees feel safe within company premises when they return to the office.
To achieve this, an organization must keep a track of employee movement and maintain social distancing policies while allocating workspaces. They should also take quick appropriate action when an infection is reported.
The prototype showcased in this post was built by Capgemini, an AWS Premier Consulting Partner and Managed Service Provider (MSP), and enables an organization to keep track of employee movements within the premises, predict employee sentiment, and help the facilities management team monitor and utilize resources efficiently.
In this post, we share the prototype’s architecture that leverages Amazon Web Services (AWS) machine learning services, Amazon Neptune graph database, and Amazon QuickSight business intelligence, along with native AWS services as building blocks.
Solution Overview
Parts of Capgemini’s prototype can be extended to organizations dealing with high footfalls such as recreation areas, movie theatres, and shopping malls.
Key benefits of the solution include:
- Optimal utilization of workplace, parking and lifts: A dashboard showing utilization of work facilities is available to the central admin team to help them detect crowding. In lifts, the solution leverages Radio Frequency ID (RFID) on employee swipe cards for tracking and to and detect crowding.
- Contact tracing: Identifies probable infections based on proximity data collected from RFID devices at various locations in the organization.
- Employee health and sentiment monitoring: Knowing people’s health status is paramount in pandemic times and can be declared on the company’s self-service app. The app also captures employee feedback and uses machine learning (ML) services to analyze sentiment.
- Common area crowding: In common areas like cafeterias, proximity detection and alerting users from the company’s self-service app using COVID Watch technology, to ensure employee safety.
Building the Prototype
The diagram below depicts the employee journey at work, and explores the data capture opportunities.
In an emergency, where companies need to build and deploy a solution within a brief period, cloud-based services from AWS helped Capgemini come up with a solution which would typically take months to build and launch.

Figure 1 – Employee journey.
Capgemini’s solution is driven by analyzing the data captured at multiple points:
- Start: The employee enters their health data into the company’s self-service app, which is fed to the solution.
- Reception entry: Once an employee reaches office and swipes their ID card, temperature details are captured in the system. If it’s over the threshold, an alert will be sent to the admin team as email and SMS.
- Lift lobby: When an employee enters the lift, employee RFID detail is captured and later coupled with lift usage details.
- Cubicle seating: Floor-plan data such as cubicle layout available in the facilities management application is leveraged for calculating capacity based on proximity calculations.
- Cafeteria access: When an employee enters or exists the cafeteria, the RFID detail is captured. The solution calculates time spent at the cafeteria and number of employees present in cafeteria at any instance of time.
- COVID Watch technology: Integration of an organization’s self-service app with COVID Watch technology (open source framework) enables the gathering of interaction details (time and distance) with other employees.
- Feedback survey: Employee satisfaction ratings are captured in a survey form. This is used to predict sentiment of employees who may not have filled out forms, or for those who are yet to start working from company premises, based on similar traits.
Architecture
Layers are outlined in Figure 2 to explain the data flow. Data sources include real-time data like temperature readings, and batch data related to employees and facilities, as well as employee swipe records at each gate, door, or lift.
These are captured in the data layer using appropriate storage services for streams, data lakes, and graph databases. In the business layer, cloud functions process business logic, while for the web frontend it uses API gateway. The presentation layer encompasses visualization coupled with graphs.

Figure 2 – Data flow through the layers.
The illustration below gives a technical architecture view of the AWS services used to materialize the prototype. The client accesses the application via web site hosted on Amazon Simple Storage Service (Amazon S3), and actions exposed on Amazon API Gateway.
The connections are through secure virtual private network (VPN) tunnel to transmit data securely to AWS.
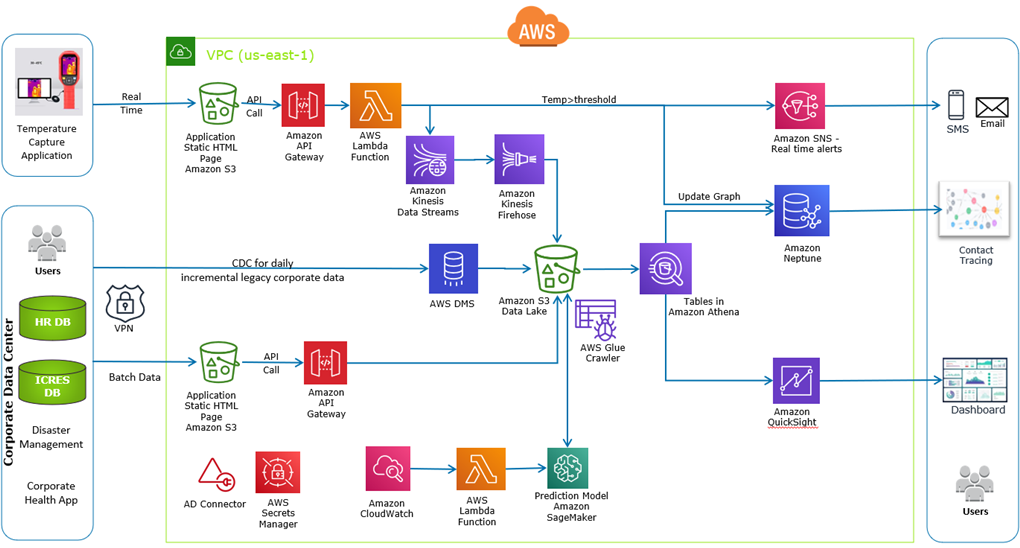
Figure 3 – Technical architecture diagram.
Building Blocks
#1 – Closely tracking employee interaction to isolate them in case of infection
Employee movements on company premises are captured by RFID devices when they swipe their ID cards. This information is ingested into Amazon S3, which is then fed to Amazon Neptune in batches to generate relationships between individuals who have been in proximity or interacted.
Employee contact tracing is computed based on the presumption that employees who swipe to enter the facility (office, cafeteria, lift) around the same time have been in proximity. This data is used to create relationships in the Amazon Neptune graph database, which is used to create the contact tracing when a suspected infection is detected.
Amazon S3 acts as the data lake for all ingested data files. The file metadata is created in AWS Glue Data Catalog by the AWS Glue crawlers that scan the files ingested in S3. Using Amazon Athena, the data files in Amazon S3 data lake are exposed as structured tables for consumption by downstream applications such as Amazon Neptune and Amazon QuickSight for further reporting and decision making.
When an employee swipes their ID card upon entering the office premises, their temperature is captured using a digital thermometer device and sent to AWS via a static web application hosted on Amazon S3. This triggers an API call in Amazon API Gateway that sends the employee ID and temperature data to an AWS Lambda function.
If the temperature is detected above a defined threshold value of 100°F, the AWS Lambda function invokes Amazon Simple Notification Service (SNS) alert and sends SMS/email to the admin team in real-time about an employee with fever.
In parallel, the AWS Lambda function also inserts this record in Amazon Kinesis Data Streams. This data record is picked up by an Amazon Kinesis Data Firehose delivery stream and sent to Amazon S3 in batches every five minutes. The function also updates a symptomatic flag in the Amazon Neptune graph relationship to enable the office admin team to quickly establish contact tracing.
The following sample code represents how the event is handled by AWS Lambda, which sends SMS and email alerts in real time when an individual with high temperature is detected:
#2 – Predicting employees’ readiness to return to office
To check the feasibility of employees’ willingness to come to the office for smooth operations, it’s important to conduct a survey. We can’t expect all employees to respond, however.
In such a scenario, businesses need to predict the survey responses for the employees who have not responded. Once the prototype’s machine learning model is trained and tuned, Amazon SageMaker makes it easy to deploy in production and generate predictions on new data.
AWS Database Migration Service (AWS DMS) is used to batch loads of employee details to Amazon S3 from on premises. This data consists of master data for employee and facilities swipe data records (cubicle, floor, cafeteria).
Where possible, change data capture (CDC) is used at the source to enable incremental data loads. AWS DMS was chosen over an extract, transform, load (ETL) tool, as it provides functionality of data migration along with CDC at a much lower cost.
The latest information about facility utilization (cubicle, transport, capacity) is posted by the admin team from a static web application hosted on Amazon S3. This data is also written to S3.
Employee survey data captured as a part of employee feedback is also ingested in S3. This critical data is used for creating a trained ML model using Amazon SageMaker for predicting the happiness score of employees.
Amazon CloudWatch is scheduled to trigger an AWS Lambda function daily to call the Amazon SageMaker endpoint. The predictions are then written back to Amazon S3.
The following sample code represents logic for sentiment analysis and infection prediction:
Finally, deploy the model to Amazon SageMaker to make it functional:
#3 – Optimizing facility utilization while maintaining social distancing
Due to social distancing norms within an organization’s premises, there’s a need to detect and minimize crowding in employee interaction zones such as workspaces, cafeterias, and lifts.
This can be achieved by analyzing the data collected by various applications like swipe records and floor capacity. Capgemini’s prototype has several dashboards built with Amazon QuickSight for providing insights on space utilization and capacity management, helping the office admin to take quick decisions in maintaining social distancing norms.
To enable the admin team to see the complete picture through a single pane, the prototype encompasses analytics dashboards in Amazon QuickSight, which is scalable and provides a serverless business intelligence service on the cloud compared to traditional BI tools.
Amazon QuickSight enables users to access dashboards from any device, and can be seamlessly embedded into applications, portals, and websites.
The Capgemini prototype contains these reports:
- Utilization of resources such as lifts and workspaces: The visual below gives a peek on lift utilization in peak hours, and based on traffic and waiting time. With respect to workspace utilization, this is to aid office admins in allocating cubicles to avoid crowding hotspots.
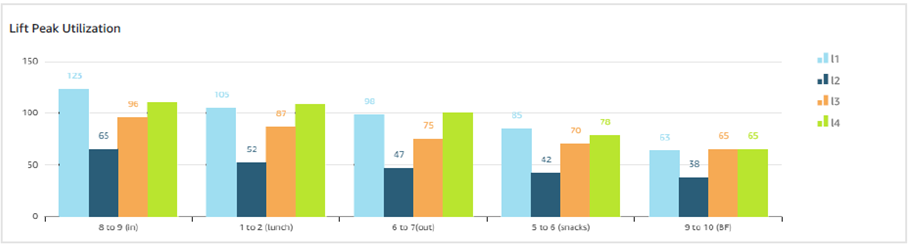
Figure 4 – Lift utilization.
- Canteen utilization: This chart shows the canteen utilization compared to the capacity at different time ranges (breakfast, lunch, dinner). If the utilization rate is low, the capacity plan can be altered. If the utilization is at peak capacity, management needs to consider increasing capacity, or schedule time slots for employee groups.
. - Infection prediction: This chart shows employee-wide status of infected, quarantined, and safe.
. - Zone-wise employee: This visual gives easy access to management about employee count per block in the office premises. If employee count is higher for a zone, a decision can be made to change seat arrangement, for example.
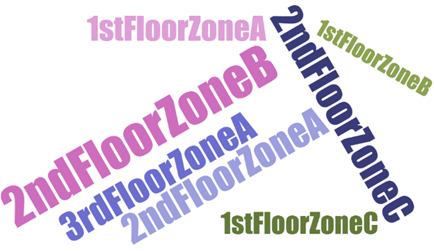
Figure 5 – Zone-wise employee distribution.
- Contact tracing: The graph below helps the admin team quickly identify employees who have been in close proximity to the infected employee, and act instantly.
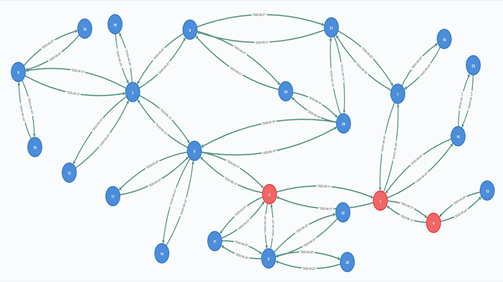
Figure 6 – Contact tracing using graphs.
The above visual represents the interactions between different individuals, wherein red nodes represent an infected person, and blue ones are uninfected. This contact tracing representation helps the admin to identify quickly and alert individuals who have interacted with infected person.
Ensuring Security
The Capgemini prototype implements the following features out of the box:
- All data resides in Amazon S3 and is encrypted at rest using SSE-S3.
- Integration with on-premises Active Directory for authorized access.
- Designed on industry standards compliant AWS services.
- Hosted within secure Amazon Virtual Private Cloud (VPC).
- Connection to AWS VPC through secure VPN tunnel.
- Services assume AWS Identity and Access Management (IAM) roles ensuring least privilege policies, to provide Role Based Access Control (RBAC).
- AWS Secrets Manager is leveraged to store Keys.
Designing for Reliability
The prototype was designed with AWS-native managed services providing high availability, durability, and reliability:
- Leverages serverless AWS technologies such as Amazon Athena, AWS Lambda, Amazon Neptune, and Amazon QuickSight.
- All data, both real-time and batch, are stored in Amazon S3, which provides 99.999999999% durability. This data was exposed as Amazon Athena tables based on AWS Glue Data Catalog.
- Temperature data streams storage on Amazon Kinesis for real-time service that’s scalable and durable.
- Using Amazon SageMaker, the machine learning model can be deployed on an auto-scaling cluster of Amazon Elastic Compute Cloud (Amazon EC2) instances that are spread across multiple AWS Availability Zones to deliver high performance and high availability.
Summary
The pandemic has been challenging for organizations in so many ways. The need to provide a safe and productive environment for employees when they return to work on premises has become even more important.
The Capgemini prototype outlined in this post enables organizations to quickly onboard employees while following necessary pandemic protocols. Moreover, it enables businesses to track and take correction active immediately.
We have shown how organizations can build a solution quickly that enables it to be fully functional, while also prioritizing employee safety.
.

.
Capgemini – AWS Partner Spotlight
Capgemini is an AWS Premier Consulting Partner and MSP. With a multicultural team of 220,000 people in 40+ countries, Capgemini has more than 12,000 AWS accreditations and over 2,700 active AWS Certifications.
Contact Capgemini | Partner Overview
*Already worked with Capgemini? Rate the Partner
*To review an AWS Partner, you must be a customer that has worked with them directly on a project.