AWS Partner Network (APN) Blog
Calculating SaaS Cost Per Tenant: A PoC Implementation in an AWS Kubernetes Environment
By Dhiman Halder, Solution Architect at Slalom Consulting
By Mahesh Pakala, Solutions Architect at AWS
 In our Slalom Orange County market, we recently came across an interesting Software-as-a-Service (SaaS) related problem. One of our customers is running their multi-tenanted SaaS application on a Kubernetes cluster deployed on Amazon Web Services (AWS).
They wanted to understand which tenants were consuming and contributing to what portion of their AWS bill, and how best to distribute this cost across the tenant base.
To better understand the value and importance of cost per tenant, please refer to the Calculating Tenant Costs in a SaaS Environment blog post, as well as the AWS re:Invent session that outlines the basic approach and challenges associated with capturing this information.
In this post, we will lay out the challenges and an approach, through a proof of concept (PoC), of calculating the cost per tenant in a Kubernetes environment running on AWS.
This PoC doesn’t implement all of the moving parts of a best practices tenant isolation model. Rather, the focus is less on illustrating SaaS best practices and more on how we could apportion tenant consumption and cost in a Kubernetes environment on AWS. Please refer to AWS SaaS Factory resources to learn more about SaaS best practices.
Slalom is an AWS Partner Network (APN) Premier Consulting Partner with multiple AWS Competency and AWS Service Delivery designations. Slalom is also a member of the AWS Well-Architected Partner Program.
Challenges of Calculating Cost Per Tenant
In a SaaS environment, the compute, storage, and bandwidth resources are often shared among tenants. For example, an Amazon Elastic Compute Cloud (Amazon EC2) instance may be running containers that process requests for multiple tenants. The question is, how do we apportion this running cost across these tenants?
Having a shared infrastructure makes it challenging to deduce per tenant cost. Going back to the example of the Amazon EC2 instance, we can easily get the running cost for the instance per month either from the AWS bill or the AWS Cost Explorer API. That does not, however, tell us anything further on how to distribute that cost across the tenants sharing the Amazon EC2 instance.
A SaaS application running on a Kubernetes cluster on AWS adds a layer of further complexity as far as calculating the per tenant cost. Kubernetes is great at abstracting away the underlying pool of hardware. It almost gives us an illusion of having access to a single large compute resource.
A Kubernetes cluster may be comprised of just one or hundreds of servers, called nodes. When we deploy a containerized application (called pods) to a Kubernetes cluster, we rarely need to worry about individual nodes anymore, or which pod ends up running on which particular node.
Rather, we let Kubernetes do the heavy lifting of finding under-utilized nodes that have capacity to spin up new pods. A pod is a fundamental unit of deployment in Kubernetes; for simplicity, think of them as containers if you want.
Furthermore, if due to hardware failure one or more nodes were to go down, Kubernetes almost immediately would detect the failure, identify the pods on the failed nodes, and spin them back up automatically in the other remaining nodes—provided there is capacity.
In Kubernetes, there is rarely much value in thinking about individual nodes. Pods may occupy any suitable node that has capacity, pods belonging to the same application may span multiple nodes at the same time, they may get moved across nodes when necessary, or their numbers may grow and shrink based on demand.
Besides, seemingly identical pods created from the very same container image may be consuming entirely different amount of hardware resources in terms of CPU, memory, storage, and bandwidth based on the volume of requests they are currently processing.
The above factors lead us to the fundamental problem of Kubernetes cost allocation in general, which is the lack of visibility into how the usage of the Kubernetes cluster resources like that of a pod relates to the cost of the underlying infrastructure.
The Prototype
To demonstrate an approach of computing cost per tenant, we developed a working prototype that mimics the customer’s environment and technology stack closely.
On the very left of the diagram in Figure 1, you can see a three-tier web service that was developed with Spring Boot and MySQL. This application was containerized and deployed to a multi-node Kubernetes cluster, as depicted on the right side of the diagram.
With Kubernetes, there are at least two distinct ways of achieving multi-tenancy within the cluster.
In the first approach, we can run containerized applications that are intrinsically tenant aware. The containers have the ability to process requests across the entire tenant base—a shared model that is referred to as the “Pooled” model. In the other model, we run separate container instances for each and every tenant, and separate resources are provisioned per tenant. This is called the “Siloed” model.
The Siloed model is better suited to applications that by themselves are not built tenant aware, but can still be containerized and offered as a SaaS product by utilizing Kubernetes constructs like namespaces, network isolation policies, ConfigMaps, and secrets in combination.
Note that there are sometimes other reasons why someone might adopt a Siloed model, such as compliance, greater sense of security, and tenant-specific customizations. We employed the latter approach to our prototype for tenant isolation because that mimicked our customer’s situation closely. However, the cost per tenant calculation methodology described in the rest of this post applies equally to the former approach.

Figure 1 – Deployment architecture of the prototype.
As you can see on the right side of the diagram in Figure 1, our sample prototype application was containerized and deployed multiple times once for each tenant and isolated under different Kubernetes namespace using network isolation policies.
The tenant-specific pods were shared across the underlying fleet of Amazon EC2 instances that act as the Kubernetes nodes of the cluster, and any tenant-specific configuration got injected through Kubernetes ConfigMaps, Secrets, or Environment variables.
Every tenant is allocated independent Elastic Load Balancing (ELB), Amazon CloudFront distribution, and Amazon Simple Storage Service (Amazon S3) buckets for storage. The incoming requests for each tenant would get routed to the correct tenant pods within the tenant namespace via each individual ELB.
As you can see at the very bottom of the diagram, we provisioned one shared Amazon RDS for MySQL instance and created separate databases with identical schemas—one for each tenant to act as the backing store for each application instance.
In this ecosystem, from a tenancy standpoint, Amazon EC2, Amazon Elastic Block Store (Amazon EBS), and Amazon Relational Database Service (Amazon RDS) are pooled (shared) AWS resources, while ELB, CloudFront, and Amazon S3 buckets are tenant-specific siloed resources.
Key Metrics
Next, we wanted to identify the key metrics that influenced the AWS cost, and those we could harvest to enable us to calculate per tenant cost. One core shared resource in the architecture is the fleet of Amazon EC2 instances that serve as the Kubernetes cluster nodes.
Tenant pods deployed to the cluster from the same container image may be consuming very different amounts of server resources in terms of CPU and memory purely based on the volume of requests processed by tenant specific pods.
To apportion tenant-wise consumption and cost, we wanted to measure the following for each tenant:
- Number of API requests processed and execution time. The more requests processed for a tenant indicated more consumption and more cost.
- CPU usage across the pods at the Kubernetes namespace level. Note that the application gets deployed once for each tenant under a different namespace.
- Memory usage across the pods at the Kubernetes namespace level.
In addition, we also wanted to track the following metrics for each tenant:
- Data transfer out from ELB and CloudFront for the tenant.
- Data storage in Amazon S3 and MySQL database.
- Number of database calls made.
Metric Sources
To capture the identified metrics, we resorted to the following sources:
- Number of API and database requests: The application code written in Java was instrumented at the API layer and the data access layer to log every web service API invocation and database invocation, along with details like the timestamp, tenant identifier, metric name and execution time.

Figure 2 – The prototype application was instrumented to log API and database invocations.
- CPU and memory usage: This was collected for each tenant namespace from the Hawkular metrics monitoring tool also running on the same Kubernetes cluster.
. - Data transfer out: Each tenant was provisioned a separate ELB and CloudFront distribution. Data transfer out in bytes for the ELB and CloudFront distributions were parsed from their individual access logs stored in tenant specific Amazon S3 buckets.
. - Data storage in Amazon S3: CloudWatch metrics for reporting the storage of S3 buckets in bytes.
. - Data storage in MySQL database: SQL query to report the physical size of the MySQL database schema in bytes for each tenant.
Solution Architecture
In Figure 3 below, you can see the solution architecture for calculating the identified metrics around consumption of the AWS resources used by our sample prototype running on the Kubernetes cluster.
This application uses some of the AWS serverless services like AWS Lambda, Amazon Kinesis, and Amazon S3. Using serverless not only freed us from managing servers or worrying about fault-tolerance, it let us focus on developing the core business logic instead.
Since we planned on ingesting a variety of streaming and batched data from different metric sources, an event based serverless data processing pipeline utilizing Kinesis and Lambda functions made a lot of sense.

Figure 3 – Solution architecture for capturing the identified metrics.
As depicted in the diagram, we setup an Amazon Kinesis Data Stream (KDS) called ‘kinesis-log-stream’ to receive raw metrics-related data from the sources identified above.
We wrote a few Lambda functions to accomplish tasks: parse ELB logs, CloudFront access logs, query Amazon CloudWatch, query databases, process the KDS, and save all the metrics data gathered to a relational database. The details are as follows:
- The source application would be instrumented to send API and database invocation logs to the KDS named ‘kinesis-log-stream’.
. - Each tenant is provisioned an independent ELB and CloudFront distribution. Access logs are enabled for each of these ELB and CloudFront distributions to capture detailed information regarding the requests and responses. The access logs get saved into different Amazon S3 buckets, and a set of Lambda functions called the ‘cf_log_collector’ (for processing CloudFront logs) and ‘elb_log_collector’ (for processing ELB logs) are deployed to process the access logs every time a new log file gets saved to the S3 buckets.
.
The pair of Lambda functions are deployed once for every tenant. Each access log is processed to fetch the number of bytes sent out from the ELB or CloudFront distribution, and the results of the processing are saved as CSV files to an S3 bucket called the ‘metrics-bucket’. As a future improvement, we plan to switch to a single CloudFront distribution and single ELB for the entire solution and use Kubernetes Ingress controller paired with ingress rules to route traffic to the correct tenant deployments.
. - The Hawkular metrics monitoring tool running on the Kubernetes cluster exposes an API that gets queried to fetch the CPU and memory usage for pods for each tenant namespace within the Kubernetes cluster. A CloudWatch event based cron job runs every five minutes and triggers a Lambda function ‘hawkular collector’.
.
The Lambda function invokes the Hawkular endpoint and gathers the CPU and memory metrics for every tenant. The same Lambda also runs a SQL query to obtain the physical size of the MySQL database schema in bytes used by each tenant. Both the results are pushed to the KDS named ‘kinesis-log-stream’.
. - Each tenant is provisioned a separate Amazon S3 bucket to store tenant-specific data like media assets. A CloudWatch event-based cron job runs once every night and triggers a Lambda function named ‘s3_metric_collector’ to ascertain the storage of S3 buckets in bytes for each tenant. The results are sent to the ‘kinesis-log-stream’.
.
A lambda function called ‘kinesis logger’ reads batches of records off the ‘kinesis-log-stream’ and saves them to the ‘metrics-bucket’ as csv files.
. - We provisioned an Amazon RDS for MySQL instance within a virtual private cloud (VPC) private subnet and created a ‘metricsdb’ database schema in it. A rate-limited Lambda function called ‘save_metrics’ was developed to process each file from the ‘metrics-bucket’ S3 bucket and write the metric records to a ‘metrics’ table within the ‘metricsdb’ database.
.
While this proof of concept was built with MySQL, it may not be the best fit for production use. A fixed schema makes the solution harder to evolve, so a less schema-heavy alternative could be a better fit. Or, another cost-efficient alternative could be Amazon Redshift.
. - The ‘metrics’ table has four columns: timestamp of the data capture, tenant identifier, name of the metric, and number of units consumed. The ‘save_metrics’ Lambda processes all raw metrics data gathered in the ‘metrics-bucket’ S3 bucket and persists them to the ‘metrics’ table. A metric is any of the eight described in the Metric Sources section of this post.
.
The unit of measurement for a metric is determined by its type. For example, if the metric is ‘s3_storage’, the units represent the amount of storage consumed in bytes. If it’s a ‘cpu’ metric, it represents the cumulative number of millicores of CPU units consumed by the Kubernetes pods for a particular tenant. If it’s ‘api_invocation’ or ‘db_invocation’, it represents the execution time of the request in milliseconds.

Figure 4 – Sample columns from the ‘metrics’ table in the ‘metricsdb’.
- Now that all of the metrics-related data is captured within the ‘metrics’ table, we are at a point where we can ascertain the consumption of metrics across the tenants by using simple SQL queries. We can easily establish the percentage consumption by each tenant and metric type within a given date range: For example:
.
Tenant X consumed 20 percent of the CPU, 60 percent of memory, and 40 percent of API invocations, while Tenant Y consumed 80 percent of CPU, 40 percent of memory, and 60% of API invocations.
. - The ‘bytes_sent’ metrics harvested from the ELB and CloudFront access logs are aggregated before they get pushed to the metrics database. However, there’s opportunity to aggregate the rest of the metrics and do calculation based off aggregated values instead of using raw granular events, since the solution will not scale well and is not very efficient. We parked it as a future improvement.
. - Finally, an HTML-based admin portal is exposed as an Amazon S3 website. It can call a Lambda function called ‘fetch_consumption’ via an API exposed using the Amazon API Gateway.
.
The Lambda function queries the AWS Cost Explorer API for billing information within a given date range, calculates per tenant cost as per the logic described in the ‘Calculation’ section of this post, and then sends the result back to the user interface to be displayed to the end user.

Figure 5 – Admin portal to display consumption and cost per tenant.
Calculation
We wanted to map the individual AWS resources to the metrics and assign weights if multiple metrics influenced the cost of a particular AWS resource. For example, we can consider that Amazon EC2 cost is influenced by multiple metrics such as count of API invocation, CPU, and memory usage by the pods.
Since there are three different metrics that influence this particular cost, we assign weights to each of them to ascertain their degree of influence. To place a higher weight on the volume of API requests processed, lesser weight on the CPU usage, and the least weight on memory usage, we start with a weight distribution ratio of 100:75:25 for API invocation, CPU, and memory usage, respectively.
To calculate per tenant cost, we used the AWS Cost Explorer API to fetch AWS billing data. We retrieve the AWS resource cost for each AWS service that is being utilized by the prototype application. Using cost allocation tags, we filter for only the AWS resources provisioned for our ecosystem within the AWS account.
Now, armed with the metrics consumption data for tenants from the ‘metrics’ table in Figure 4, the weights assigned for each metric that influence the cost of AWS resources in the ‘metric_weight’ table, and the actual AWS bill for each AWS resource from the AWS Cost Explorer API, we can deduce the apportioned cost per tenant for each of the AWS pooled resources.
Calculating Cost Per Tenant of Shared Resources
The total cost per tenant is derived by adding the cost per tenant of each shared resources and the cost per tenant of individual resources. In this section, we take an example of one shared resource say the Amazon EC2 instance and go through the calculation of the same.
- First, let’s assume the AWS bill for the Amazon EC2 instances running the Kubernetes cluster for a particular time period is $20.70.
. - Let’s also assume we have two tenants in our system tenant1 and tenant2.
. - Depicted below in Figure 6 is an aggregated and filtered view of the ‘metrics’ table. The rows in the table are filtered for metrics that only influence the Amazon EC2 cost and are within the given time period. The filtered rows are then aggregated for each metric and tenant.
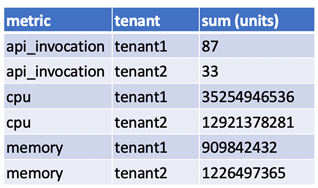
Figure 6 – Filtered and aggregated view of ‘metrics’ table.
- From the information in this table, we can derive the percentage distribution of each metric for every tenant as shown below.

Figure 7 – Percentage distribution of metric by tenant.
- Using the ‘metric_weight’ lookup table and the percentage distribution data in Figure 7, we may calculate the cost per tenant for Amazon EC2 is as described below.
Algorithm
let s = 0
for each metric in the percent distribution dataset for a given tenant
…….s = s + (percent distribution * corresponding weight from the metrics_weight table)
cost for tenant for given AWS resource = AWS bill for resource * s
Repeat above function for each tenant. Here’s an illustration of calculating tenant-wise cost for Amazon EC2 instances shared by tenant1 and tenant2.
Using the above formula, tenant1 apportioned cost for Amazon EC2 is:
20.70 * (72.50% * 0.5 + 73.18% * 0.375 + 42.59% * 0.125) = 14.29
Similarly, tenant2 apportioned cost for Amazon EC2 is:
20.70 * (27.50% * 0.5 + 26.82% * 0.375 + 57.41% * 0.125) = 6.41
Now, we can use the above algorithm to calculate the cost per tenant for each of the other shared AWS resources, such as Amazon EBS and Amazon RDS, on our case.
Calculating Cost Per Tenant of Individual Resources
In this architecture, each tenant is provisioned a separate ELB, CloudFront distribution, and Amazon S3 bucket. These resources are not shared across tenants and may be termed as ‘siloes’. We can easily obtain their individual costs from the AWS Cost Explorer API.
As an example, here’s an illustration of cost per tenant for siloed resources and two hypothetical tenants:

Figure 8 – This is the ‘metrics_weight’ table.
Total Cost
The total cost per tenant value is derived from adding all the siloed and apportioned pool cost per tenant.
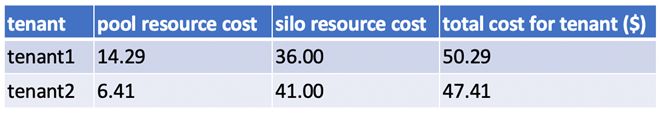
Figure 9 – Total cost per tenant.
Conclusion
In this post, we laid out the challenges and an approach for calculating cost per tenant in a Kubernetes environment. We identified and utilized a few key metrics that we could use to ascertain consumption per tenant.
It’s worth mentioning that this was a very specific implementation that targeted a specific customer need. There are often many variations of how multi-tenancy is implemented, and each of these bring with a unique set of challenges for tracking tenant cost. It’s especially difficult in an environment where more of the infrastructural elements are shared by tenants. If you wanted to implement a similar solution, you would most likely tweak your approach based on your set of requirements and target environment.
In any case, you have to tie the consumption of each of the identified metrics with the underlying AWS resources. If there are multiple metrics that influence the cost of a particular AWS resource, you can use weights like we did to factor in their relative degree of influence. For each shared AWS resource, you may distribute the cost per tenant using the ratio of their consumption.
To obtain the total cost per tenant you add the cost per shared resources with the cost for individual resources consumed by the tenant.
At Slalom Orange County, once we started seeing some results from the proof of concept we realized it wasn’t really necessary to factor in each and every AWS service for the calculation. We do not need an exact number but rather an approximate ballpark value. By limiting our focus to only the key AWS services that influence the majority of the total cost, we can simplify our solution to a great extent.
We identified a few areas for improving the solution. It’s best to move away from a fixed schema-based data store like MySQL. We plan to switch to a single CloudFront distribution and single ELB by using Kubernetes Ingress controller with ingress rules. An ELB per tenant-based approach, for example, will not scale well and would be cost prohibitive when there are large number of tenants. Resorting to a single shared ELB and CloudFront distribution will reduce cost and operational burden.
Finally, using raw fine-grained events for calculation is not very efficient. In our case, we plan to aggregate the metrics data at various stages to speed up the calculation process.
.
 |
Slalom – APN Partner Spotlight
Slalom is an AWS Premier Consulting Partner. They are a modern consulting firm focused on strategy, technology, and business transformation. Slalom’s teams are backed by regional innovation hubs, a global culture of collaboration, and partnerships with the world’s top technology providers.
Contact Slalom | Practice Overview
*Already worked with Slalom? Rate this Partner
*To review an APN Partner, you must be an AWS customer that has worked with them directly on a project.