AWS Big Data Blog
Building a Real World Evidence Platform on AWS
Deriving insights from large datasets is central to nearly every industry, and life sciences is no exception. To combat the rising cost of bringing drugs to market, pharmaceutical companies are looking for ways to optimize their drug development processes. They are turning to big data analytics to better quantify the effect that their drug compounds have on different populations and to look for new clinical indications for existing drugs.
A real world evidence (RWE) platform is loosely defined as an integrated set of services and products that life sciences companies use to securely acquire, store, and analyze large, often disparate datasets to gain insight into the functions of a specific drug or intervention. The petabyte-scale data generated from wearables, medical devices, genomics, clinical imaging, and claims (to name a few) allows pharmaceutical and other life sciences companies to build big data platforms to analyze these datasets. And many of them are doing it on AWS.
At the center of nearly every RWE platform is a data lake that houses different data types. It also stores the related metadata to identify where each piece of data came from, who owned it, etc. Analytics engines integrate the relevant streaming (e.g., wearables), structured (e.g., claims data), and unstructured (e.g., notes in electronic health records) data.
In this post, I highlight common architectural patterns that customers are using to maximize the value of real world evidence on AWS. The architecture presented here can be reproduced in multiple regions, so you can respect local data sovereignty requirements, when applicable, while conducting global studies. This post doesn’t cover all considerations for real world evidence (such as security and authentication), but instead focuses on the areas that are related to your data flow.
A data lake is your source of truth
The ability to integrate disparate data types is critical to maximizing the utility of RWE. Life sciences companies have to be able to store, search, and retrieve data of different types and sizes, including (but not limited to) the following:
- Streaming data from wearables and medical devices
- Structured data from genomics and claims data
- Unstructured data from notes in electronic health records
A common solution to integrate these data types is a data lake. Data lakes allow organizations to store all their data, regardless of data type, in a centralized repository. Because data can be stored as-is, there’s no need to convert it to a predefined schema. And you no longer need to know what questions you want to ask of your data beforehand. You can use data lakes for ad hoc analyses, so you can quickly explore and discover new insights without needing to structure the data first, as you would with a traditional data warehouse.
Although there are many uses for storing real world evidence data in a data lake, here are a few examples of the processes it can facilitate for pharma and biotech companies:
- Quickly access all data for a given subject, from clinical images to genomics to claims data.
- Associate incoming RWE data with existing data in your RWE data lake, such as by subject or study.
- Select specific windows in longitudinal studies (microbiome, metabolomics, etc.).
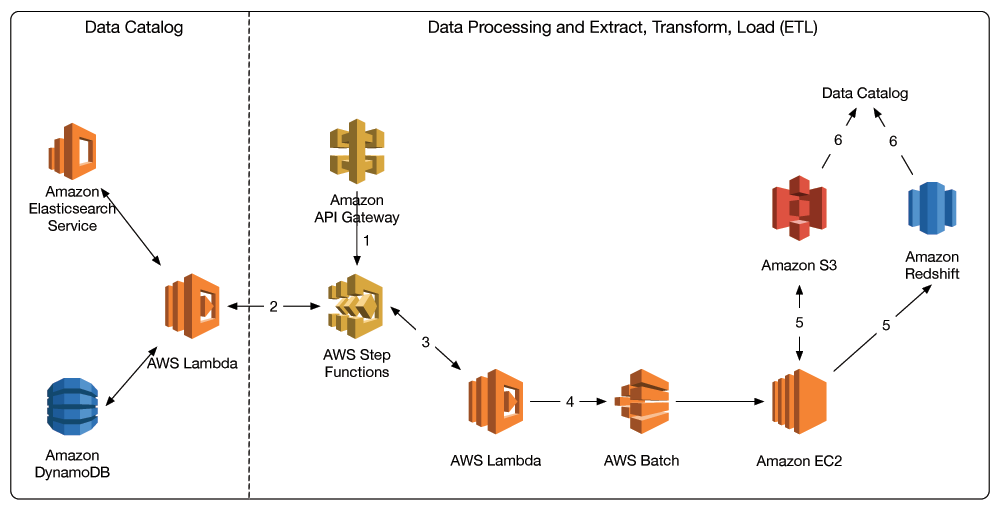
The following diagram shows an architecture of the features within a data lake and several examples of how data enters a data lake:

This architecture, which is entirely serverless and backed by Amazon S3, lets you scale your data lake to easily accommodate any data size for your RWE platform. Additionally, the components presented in this diagram can be secured via IAM controls and service policies. This enables you to secure and protect the sensitive information that often resides within an RWE platform. Amazon S3 is the canonical source for objects in your RWE data lake. You track and search metadata that is associated with these objects in a data catalog built on Amazon OpenSearch Service and Amazon DynamoDB.
Let’s dive deeper into what this architecture does and how data makes it into the data lake:
- Streaming (e.g., wearables), structured, and unstructured data is acquired from myriad devices and sources. Depending on the data size, you might use AWS IoT (streaming), AWS Storage Gateway (mid-size/continual batch), and AWS Snowball (large legacy datasets, such as imaging). AWS IoT writes to Amazon Kinesis Firehose, which transforms the telemetry data in-flight to land both transformed and raw data in Amazon S3.
- When data lands in Amazon S3 buckets, an AWS Lambda function is invoked (either by trigger or manually).
- This Lambda function writes to a data catalog that is fronted by Amazon API Gateway. The data catalog contains metadata about all the object data in Amazon S3, as well as data that resides in databases, such as Amazon Redshift.
- An AWS Lambda function on the other side of API Gateway writes the appropriate metadata about the objects, such as the study that the data was generated from, into Amazon OpenSearch Service and/or Amazon DynamoDB, which I refer to as the data catalog.
The data catalog mentioned in steps 3 and 4 is central to your data management. In most analyses, the first step is to build a data manifest of where the data-of-interest lies, which is discussed in later sections.
Normalizing data for real world evidence
As I previously mentioned, data can enter your real world evidence data lake in many different formats. In many cases, you might need to normalize this data into a specific format to ease downstream analysis. For example, you might have to integrate many different electronic health records that are stored in different formats. You also might have to transform genomics data, often represented as a variant call format (VCF) file, into a format that’s easier for big data technologies like Apache Parquet to query. While you can certainly analyze this data in the format in which it entered, it might be better for querying after it’s transformed into a different format, or into a different data store.
In the architecture shown in the following diagram, AWS Step Functions orchestrates the data normalization (extract, transform, load—or ETL) process. Step Functions is a serverless workflow service that ensures that your long-running ETL jobs execute in order and complete successfully. At a high level, you first query the data catalog to get a manifest of the data to be normalized. Normalization occurs on Amazon EC2 instances, and the results are then stored back in Amazon S3 or in databases such as Amazon Redshift for future analysis. Locations of these results data are also logged in the data catalog for future querying.
Here is an example Step Functions state machine for this process:
The following is the accompanying JSON that produces it:
And here is the overall architecture:
Here are the steps in more detail:
- Either a user or an application submits a POST request through Amazon API Gateway to process or transform a set of data. This request contains the query parameters that correspond to generating the data manifest. It is passed into an AWS Step Functions state machine, which orchestrates the ETL process.
- A Lambda function queries the data catalog and builds a manifest that contains the location of the data of interest.
- The manifest is passed to downstream Lambda functions in the state machine that orchestrate the batch workflow to process the data that’s specified in the manifest.
- These Lambda functions submit jobs to AWS Batch to execute batch jobs on Amazon EC2.
- Amazon EC2 processes the data (e.g., data normalization) and stores results back in Amazon S3 and/or Amazon Redshift.
- Results data is then logged in the data catalog, using the process shown in the data acquisition diagram.
Analyzing and visualizing data in real world evidence
Ultimately, the value in real world evidence platforms is the value you derive from the wide variety of data that feeds into it. Big data analytics, such as Spark on EMR, machine learning with the Deep Learning AMIs, and healthcare data warehouses, are all fundamental to maximizing the value of RWE.
Given the wide array of questions you can answer, you want your architecture to be as flexible as possible. Your organization also might use business intelligence (BI) tools. Again, as with the data normalization tier, you can use Step Functions to orchestrate your workflow. You first build the data manifest and then submit each portion of your desired analysis to the relevant data location and compute options, such as Amazon EMR or Amazon Redshift. Your organization’s BI tool of choice, such as Amazon QuickSight or one offered by our AWS Big Data Competency partners, can extract and visualize the results.
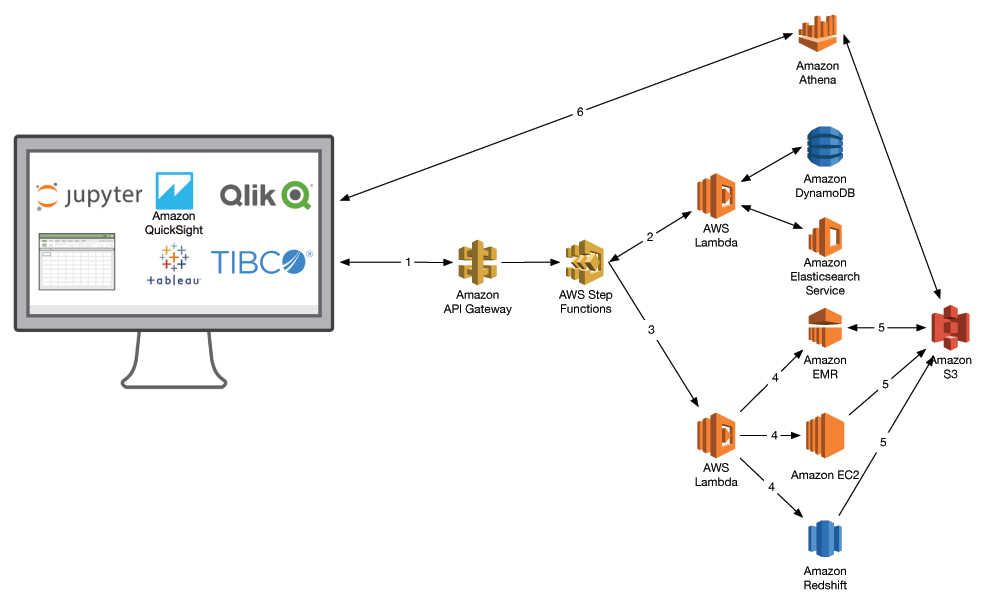
Here is the workflow in more detail:
- A user initiates a query on a dataset. In the context of RWE, this is largely analyzing a cohort in the context of a specific indication (drug response, etc.).
- AWS Step Functions invokes a Lambda function to query the data catalog and build a manifest of data.
- The manifest is passed to subsequent Lambda functions, which orchestrate the data analysis through different AWS services.
- These analyses can include Amazon EMR for population-scale genomics, Amazon EC2 for HPC and machine learning, and Amazon Redshift for your healthcare data warehouse.
- Results from each analysis are staged back in Amazon S3 and logged in the data catalog.
- BI tools like Amazon QuickSight or Tableau, or data analysis workbooks like Jupyter can query Amazon S3 to visualize results, such as through Amazon Athena.
A practical example
Imagine that you are at a pharmaceutical company that is developing a drug to address a neurological condition. You have longitudinal data in the form of brain scans and have noticed that the drug compound under development seems to benefit a specific subpopulation of individuals. As a result, you determine to sequence the genomes of all the responders and non-responders to look for specific biomarkers that could indicate response levels. Success would result in a companion diagnostic that you could use alongside your drug to increase its overall efficacy by delivering it only to the responding population.
Let’s briefly look at how this study might play out in the steps of data acquisition, normalization, and analysis described earlier.
Data acquisition
Data from longitudinal brain imaging studies can be moved to AWS using AWS Snowball. Genomics data coming off your genome sequencers would land in Amazon S3 via AWS Storage Gateway and/or AWS Direct Connect. These datasets are stored in your data catalog where you track items such as date generated, anonymized subject ID, etc.
Data processing
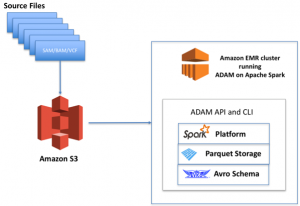
Genomes are transformed from raw reads (e.g., FASTQ) to a human readable format (VCF) that identifies variations in a genome. These VCF files are subsequently extracted, transformed, and loaded into a format that is amenable to big data analytics, such as Parquet.
Data analysis
You build a data manifest of your brain scans in Amazon S3. You use the deep learning AMI and P2 instance family to build machine learning models to identify images that represent different stages in your disorder-of-interest. You then run association analyses that combine your genomics data with your brain imaging models and drug response data to identify what genomic variants associate with improved treatment outcomes. You can manage these analyses via Jupyter notebooks, or you can connect with your BI tool of choice to visualize your results.
It will always be day one for RWE
By implementing real world evidence platforms on AWS, you can quickly integrate and interrogate disparate healthcare data to advance human health. By designing your RWE platform to be flexible, you can readily incorporate new big data technologies as they become relevant to your needs. This enables you to innovate and discover at a quicker rate.
To read more about real world evidence on AWS, and how AWS Partner Network (APN) Premier Consulting Partner Deloitte has architected their ConvergeHEALTH platform on AWS, check out this guest post on the APN Blog!
Please leave any questions and comments below.
Additional Reading
The healthcare ecosystem has chosen a variety of tools and techniques for working with big data, but one tool that comes up again and again in many of the architectures we design and review is Spark on Amazon EMR. Will spark power the data behind precision medicine?
About the Author
 Dr. Aaron Friedman is a Healthcare and Life Sciences Partner Solutions Architect at Amazon Web Services. He works with ISVs and SIs to architect healthcare solutions on AWS, and bring the best possible experience to their customers. His passion is working at the intersection of science, big data, and software. In his spare time, he’s exploring the outdoors, learning a new thing to cook, or spending time with his wife and his dog, Macaroon.