Category: AWS X-Ray
Latency Distribution Graph in AWS X-Ray
We’re continuing to iterate on the AWS X-Ray service based on customer feedback and today we’re excited to release a set of tools to help you quickly dive deep on latencies in your applications. Visual Node and Edge latency distribution graphs are shown in a handy new “Service Details” side bar in your X-Ray Service Map.

The X-Ray service graph gives you a visual representation of services and their interactions over a period of time that you select. The nodes represent services and the edges between the nodes represent calls between the services. The nodes and edges each have a set of statistics associated with them. While the visualizations provided in the service map are useful for estimating the average latency in an application they don’t help you to dive deep on specific issues. Most of the time issues occur at statistical outliers. To alleviate this X-Ray computes histograms like the one above help you solve those 99th percentile bugs.
To see a Response Distribution for a Node just click on it in the service graph. You can also click on the edges between the nodes to see the Response Distribution from the viewpoint of the calling service.

The team had a few interesting problems to solve while building out this feature and I wanted to share a bit of that with you now! Given the large number of traces an app can produce it’s not a great idea (for your browser) to plot every single trace client side. Instead most plotting libraries, when dealing with many points, use approximations and bucketing to get a network and performance friendly histogram. If you’ve used monitoring software in the past you’ve probably seen as you zoom in on the data you get higher fidelity. The interesting thing about the latencies coming in from X-Ray is that they vary by several orders of magnitude.

If the latencies were distributed between strictly 0s and 1s you could easily just create 10 buckets of 100 milliseconds. If your apps are anything like mine there’s a lot of interesting stuff happening in the outliers, so it’s beneficial to have more fidelity at 1% and 99% than it is at 50%. The problem with fixed bucket sizes is that they’re not necessarily giving you an accurate summary of data. So X-Ray, for now, uses dynamic bucket sizing based on the t-digests algorithm by Ted Dunning and Otmar Ertl. One of the distinct advantages of this algorithm over other approximation algorithms is its accuracy and precision at extremes (where most errors typically are).
An additional advantage of X-Ray over other monitoring software is the ability to measure two perspectives of latency simultaneously. Developers almost always have some view into the server side latency from their application logs but with X-Ray you can examine latency from the view of each of the clients, services, and microservices that you’re interacting with. You can even dive deeper by adding additional restrictions and queries on your selection. You can identify the specific users and clients that are having issues at that 99th percentile.
This info has already been available in API calls to GetServiceGraph as ResponseTimeHistogram but now we’re exposing it in the console as well to make it easier for customers to consume. For more information check out the documentation here.
– Randall
AWS Lambda Support for AWS X-Ray
Today we’re announcing general availability of AWS Lambda support for AWS X-Ray. As you may already know from Jeff’s GA POST, X-Ray is an AWS service for analyzing the execution and performance behavior of distributed applications. Traditional debugging methods don’t work so well for microservice based applications, in which there are multiple, independent components running on different services. X-Ray allows you to rapidly diagnose errors, slowdowns, and timeouts by breaking down the latency in your applications. I’ll demonstrate how you can use X-Ray in your own applications in just a moment by walking us through building and analyzing a simple Lambda based application.
If you just want to get started right away you can easily turn on X-Ray for your existing Lambda functions by navigating to your function’s configuration page and enabling tracing:

Or in the AWS Command Line Interface (CLI) by updating the functions’s tracing-config (Be sure to pass in a --function-name as well):
$ aws lambda update-function-configuration --tracing-config '{"Mode": "Active"}'
When tracing mode is active Lambda will attempt to trace your function (unless explicitly told not to trace by an upstream service). Otherwise, your function will only be traced if it is explicitly told to do so by an upstream service. Once tracing is enabled, you’ll start generating traces and you’ll get a visual representation of the resources in your application and the connections (edges) between them. One thing to note is that the X-Ray daemon does consume some of your Lambda function’s resources. If you’re getting close to your memory limit Lambda will try to kill the X-Ray daemon to avoid throwing an out-of-memory error.
Let’s test this new integration out by building a quick application that uses a few different services.
As twenty-something with a smartphone I have a lot of
pictures
selfies (10000+!) and I thought it would be great to analyze all of them. We’ll write a simple Lambda function with the Java 8 runtime that responds to new images uploaded into an Amazon Simple Storage Service (S3) bucket. We’ll use Amazon Rekognition on the photos and store the detected labels in Amazon DynamoDB.

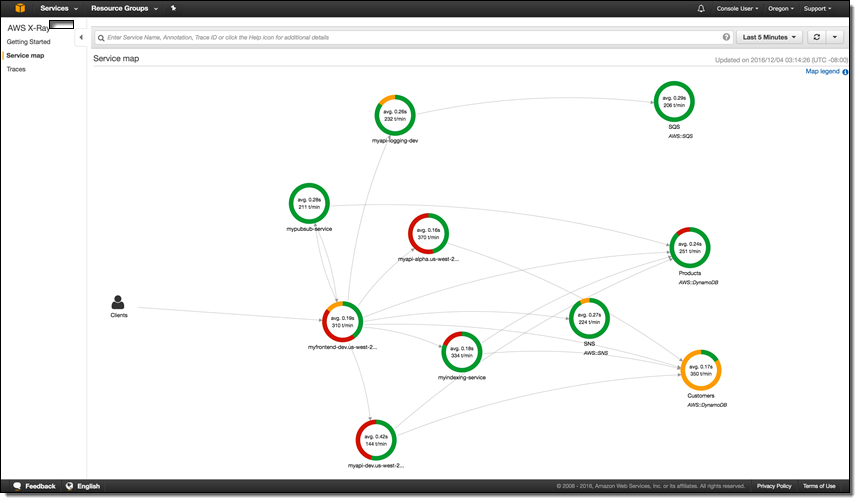
First, let’s define a few quick X-Ray vocabulary words: subsegments, segments, and traces. Got that? X-Ray is easy to understand if you remember that subsegments and segments make up traces which X-Ray processes to generate service graphs. Service graphs make a nice visual representation we can see above (with different colors indicating various request responses). The compute resources that run your applications send data about the work they’re doing in the form of segments. You can add additional annotations about that data and more granular timing of your code by creating subsgements. The path of a request through your application is tracked with a trace. A trace collects all the segments generated by a single request. That means you can easily trace Lambda events coming in from S3 all the way to DynamoDB and understand where errors and latencies are cropping up.
So, we’ll create an S3 bucket called selfies-bucket, a DynamoDB table called selfies-table, and a Lambda function. We’ll add a trigger to our Lambda function for the S3 bucket on ObjectCreated:All events. Our Lambda function code will be super simple and you can look at it in it’s entirety here. With no code changes we can enable X-Ray in our Java function by including the aws-xray-sdk and aws-xray-sdk-recorder-aws-sdk-instrumentor packages in our JAR.
Let’s trigger some photo uploads and get a look at the traces in X-Ray.

We’ve got some data! We can click on one of these individual traces for a lot of detailed information on our invocation.

In the first AWS::Lambda segment we see the dwell time of the function, how long it spent waiting to execute, followed by the number of execution attempts.
In the second AWS::Lambda::Function segment there are a few possible subsegments:
- The inititlization subsegment includes all of the time spent before your function handler starts executing
- The outbound service calls
- Any of your custom subsegments (these are really easy to add)
Hmm, it seems like there’s a bit of an issue on the DynamoDB side. We can even dive deeper and get the full exception stacktrace by clicking on the error icon. You can see we’ve been throttled by DynamoDB because we’re out of write capacity units. Luckily we can add more with just a few clicks or a quick API call. As we do that we’ll see more and more green on our service map!

The X-Ray SDKs make it super easy to emit data to X-Ray, but you don’t have to use them to talk to the X-Ray daemon. For Python, you can check out this library from rackspace called fleece. The X-Ray service is full of interesting stuff and the best place to learn more is by hopping over to the documentation. I’ve been using it for my @awscloudninja bot and it’s working great! Just keep in mind that this isn’t an official library and isn’t supported by AWS.
Personally, I’m really excited to use X-Ray in all of my upcoming projects because it really will save me some time and effort debugging and operating. I look forward to seeing what our customers can build with it as well. If you come up with any cool tricks or hacks please let me know!
– Randall
AWS X-Ray Update – General Availability, Including Lambda Integration
I first told you about AWS X-Ray at AWS re:Invent in my post, AWS X-Ray – See Inside Your Distributed Application. X-Ray allows you to trace requests made to your application as execution traverses Amazon EC2 instances, Amazon ECS containers, microservices, AWS database services, and AWS messaging services. It is designed for development and production use, and can handle simple three-tier applications as well as applications composed of thousands of microservices. As I showed you last year, X-Ray helps you to perform end-to-end tracing of requests, record a representative sample of the traces, see a map of the services and the trace data, and to analyze performance issues and errors. This helps you understand how your application and its underlying services are performing so you can identify and address the root cause of issues.
 You can take a look at the full X-Ray walk-through in my earlier post to learn more.
We launched X-Ray in preview form at re:Invent and invited interested developers and architects to start using it. Today we are making the service generally available, with support in the US East (Northern Virginia), US West (Northern California), US East (Ohio), US West (Oregon), EU (Ireland), EU (Frankfurt), South America (São Paulo), Asia Pacific (Tokyo), Asia Pacific (Seoul), Asia Pacific (Sydney), Asia Pacific (Sydney), and Asia Pacific (Mumbai) Regions.
New Lambda Integration (Preview)
During the preview period we fine-tuned the service and added AWS Lambda integration, which we are launching today in preview form. Now, Lambda developers can use X-Ray to gain visibility into their function executions and performance. Previously, Lambda customers who wanted to understand their application’s latency breakdown, diagnose slowdowns, or troubleshoot timeouts had to rely on custom logging and analysis.
In order to make use of this new integration, you simply ensure that the functions of interest have execution roles that gives the functions permission to write to X-Ray, and then enable tracing on a function-by-function basis (when you create new functions using the console, the proper permissions are assigned automatically). Then you use the X-Ray service map to see how your requests flow through your Lambda functions, EC2 instances, ECS containers, and so forth. You can identify the services and resources of interest, zoom in, examine detailed timing information, and then remedy the issue.
Each call to a Lambda function generates two or more nodes in the X-Ray map:
Lambda Service – This node represents the time spent within Lambda itself.
User Function – This node represents the execution time of the Lambda function.
Downstream Service Calls – These nodes represent any calls that the Lambda function makes to other services.
To learn more, read Using X-Ray with Lambda.
Now Available
We will begin to charge for the usage of X-Ray on May 1, 2017.
Pricing is based on the number of traces that you record, and the number that you analyze (each trace represent a request made to your application). You can record 100,000 traces and retrieve or scan 1,000,000 traces every month at no charge. Beyond that, you pay $5 for every million traces that you record and $0.50 for every million traces that you retrieve for analysis, with more info available on the AWS X-Ray Pricing page. You can visit the AWS Billing Console to see how many traces you have recorded or accessed (data collection began on March 1, 2017).
Check out AWS X-Ray and the new Lambda integration today and let me know what you think!
— Jeff;
AWS X-Ray – See Inside of Your Distributed Application
From what I can tell, Presidential Medal of Freedom recipient Grace Hopper was the first person to apply the term debugging to the process of identifying and removing errors from programs.
While I have never had to extract an actual bug from a computer, I did spend plenty of time debugging assembly language programs early in my career. Back then, debugging consisted of single-stepping through code, examining the contents of each processor register before and after each step in order to verify that your mental model was in accord with what was actually happening. It was fairly tedious, but it left little room for bugs to hide and rewarded you with an in-depth understanding of how your code worked. Later, single-stepping gave way to debug output (hello, stderr) and from there to log files and log analysis tools.
Over the last decade or two, as complex distributed systems have emerged, debugging has changed and has taken on a new meaning. With unit tests ensuring that individual functions and modules behave as expected, the challenge turns to looking at patterns of behavior at scale. The combination of cloud computing, microservices, and asynchronous, notification-based architectures has brought forth systems that have hundreds or thousands of moving parts. The challenge of identifying and addressing performance issues in these complex systems has only grown, as has the difficulty of aggregating individual, service-level observations into meaningful top-level results. There has been no easy way for developers to “follow-the-thread” as execution traverses EC2 instances, ECS containers, microservices, AWS database and messaging services.
Let’s fix this!
Introducing AWS X-Ray
Today I would like to tell you about AWS X-Ray. We have made it possible for you to trace requests from beginning to end across all of the touch-points that I just mentioned. It addresses the problems that come about when you want to understand and improve distributed systems at scale, and gives you the information and the insights that you need to have in order to do this.
X-Ray captures trace data from code running on EC2 instances (including ECS containers), AWS Elastic Beanstalk, Amazon API Gateway, and more. It implements follow-the-thread tracing by adding an HTTP header (including a unique ID) to requests that do not already have one, and passing the header along to additional tiers of request handlers. The data collected at each point is called a segment, and is stored as a chunk of JSON data. A segment represents a unit of work, and includes request and response timing, along with optional sub-segments that represent smaller work units (down to lines of code, if you supply the proper instrumentation). A statistically meaningful sample of the segments are routed to X-Ray (a daemon process handles this on EC2 instances and inside of containers) where it is assembled into traces (groups of segments that share a common ID). The traces are segments are further processed to create service graphs that visually depict the relationship of services to each other.
I spent a few minutes walking through the X-Ray console in order to see how all of this fits together. Along the way I made use of some sample apps that the console offered up for launch on my behalf:
Each sample app is launched by a AWS CloudFormation template. The apps make use of the newest AWS AWS SDKs; these SDKs are X-Ray aware and participate in the process of collecting and storing X-Ray segments. The Java, Node.js, and .NET SDKs now include support for X-Ray; we’ll be updating the others as soon as possible. AWS Lambda support is coming soon.
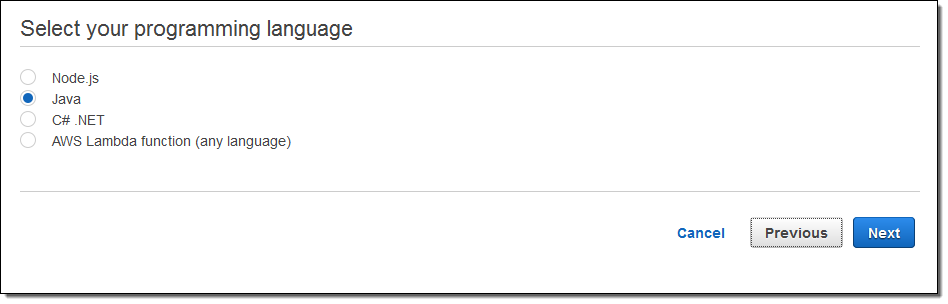
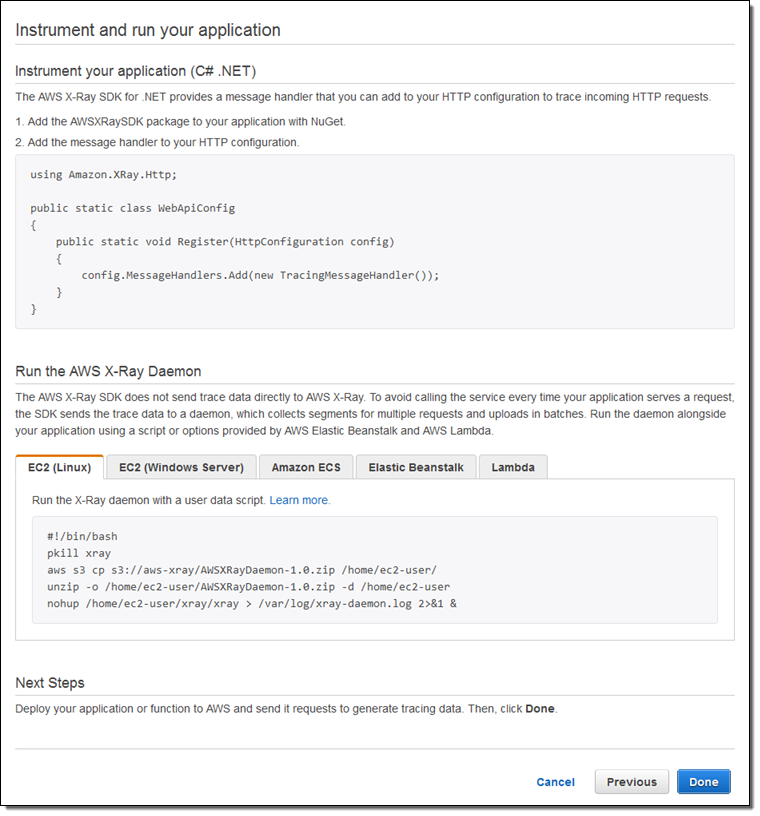
When you are ready to instrument and run your own applications, the X-Ray Console will show you what you have to do:
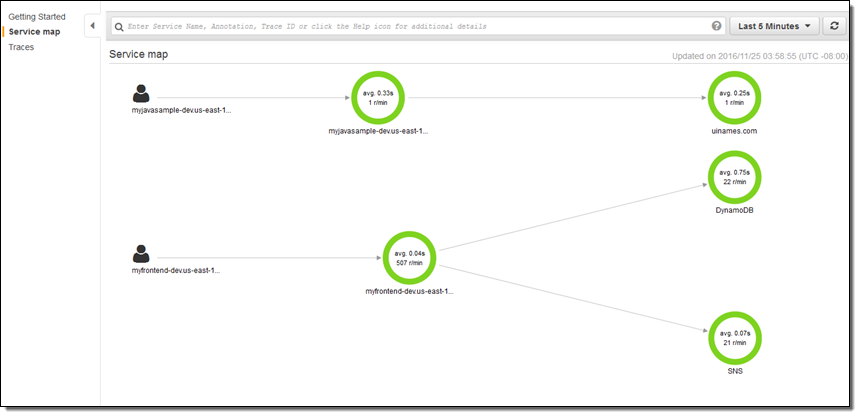
I launched a pair of apps, ran them for a bit, and then hopped over to the X-Ray Console to see what was happening. The Service Map gives me a top-level view:
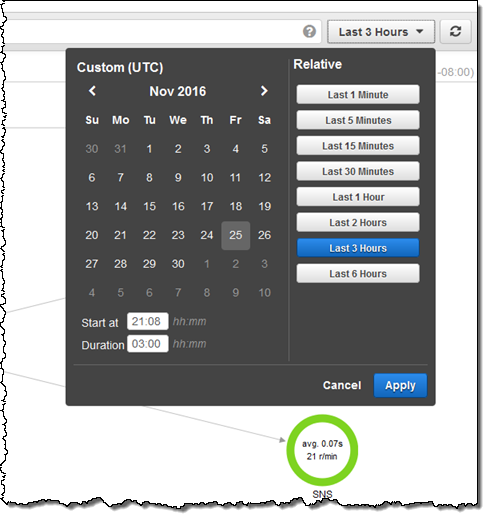
I can use the date/time range selector to indicate the time frame of interest:
I can click on any node in the graph in order to take a look at the traces behind it:
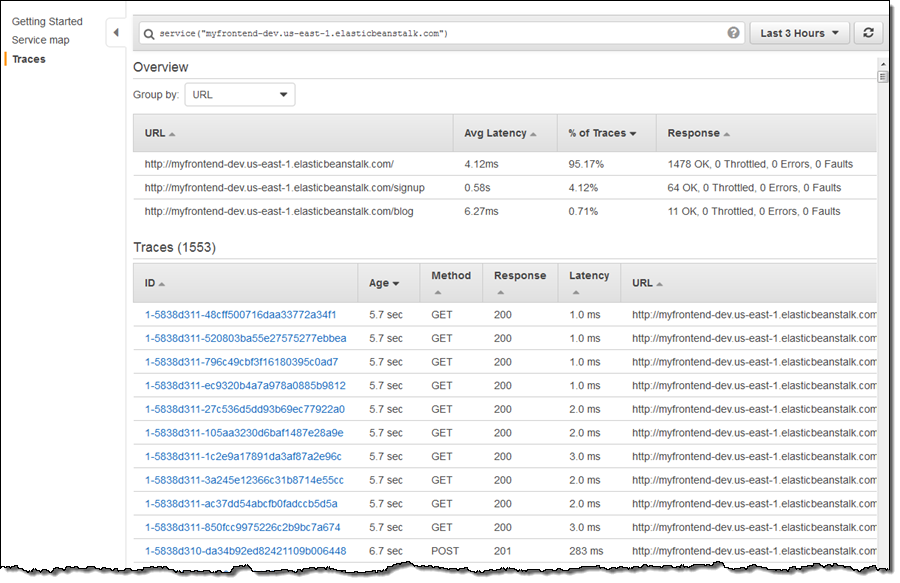
At the top of the page I can see that the signup operation, while infrequent (4.12% of the traces) has higher latency than the other two operations.First I sort by URL to group the signup operations together, and then I look at the segments that contribute to the particular trace. Here’s one that includes calls to DynamoDB and SNS:
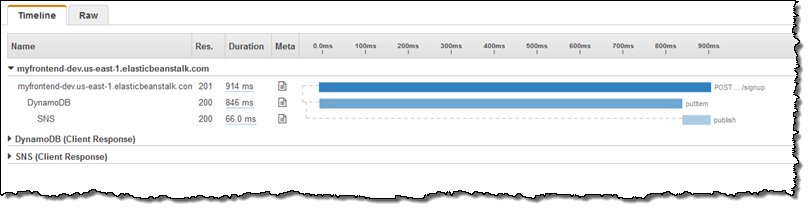
This shows me that, when invoked from the entry point of interest, the call to DynamoDB is taking a long time. Calls to DynamoDB run in single-digit milliseconds so I should take a closer look. I focus on the Meta column, click on the document icon, and then examine the Resources tab to see what’s going on:
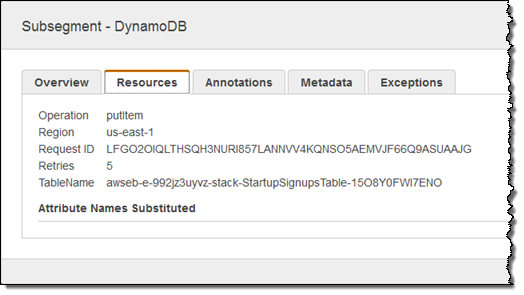
Looks like the client SDK is doing some retries, mostly likely because the table should be provisioned for additional read or write throughput.
The X-Ray UI is built around the concept of filter expressions. There are dedicated UI elements for a few key features, but the rest (as befits a developer-oriented tool) is powered by free-form filters that you simply enter in the text box at the top of the page. Here are a few very simple examples:
responsetime > 5– Response time more than 5 seconds.duration >= 5 AND duration <= 8– Duration between 5 and 8 seconds.service("dynamodb")– Requests that include a call to DynamoDB.
You can also filter by dates, trace IDs, HTTP methods & status codes, URLs, user agents, client IP addresses, and much more.
Everything that I have shown you (and a whole lot more) is also accessible from the X-Ray APIs and the AWS Command Line Interface (CLI). This should open the door to all sorts of high-level tools, visualizations, and partner opportunities. Leave me a comment and let me know what you build!
Available Now
AWS X-Ray is available in preview form now in all 12 public AWS Regions and you can start using it today!
If you’d like to learn more, we have a webinar on January 16th. You can register for it here.
— Jeff;