Category: AWS Lambda
Lambda@Edge – Intelligent Processing of HTTP Requests at the Edge
Late last year I announced a preview of Lambda@Edge and talked about how you could use it to intelligently process HTTP requests at locations that are close (latency-wise) to your customers. Developers who applied and gained access to the preview have been making good use of it, and have provided us with plenty of very helpful feedback. During the preview we added the ability to generate HTTP responses and support for CloudWatch Logs, and also updated our roadmap based on the feedback.
Now Generally Available
Today I am happy to announce that Lambda@Edge is now generally available! You can use it to:
- Inspect cookies and rewrite URLs to perform A/B testing.
- Send specific objects to your users based on the User-Agent header.
- Implement access control by looking for specific headers before passing requests to the origin.
- Add, drop, or modify headers to direct users to different cached objects.
- Generate new HTTP responses.
- Cleanly support legacy URLs.
- Modify or condense headers or URLs to improve cache utilization.
- Make HTTP requests to other Internet resources and use the results to customize responses.
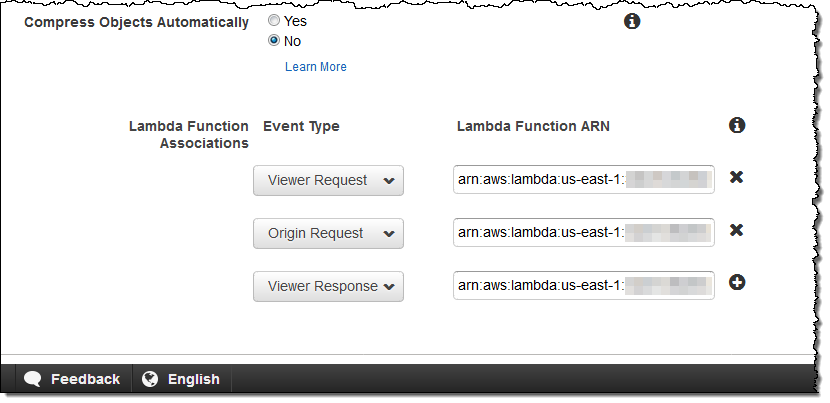
Lambda@Edge allows you to create web-based user experiences that are rich and personal. As is rapidly becoming the norm in today’s world, you don’t need to provision or manage any servers. You simply upload your code (Lambda functions written in Node.js) and pick one of the CloudFront behaviors that you have created for the distribution, along with the desired CloudFront event:
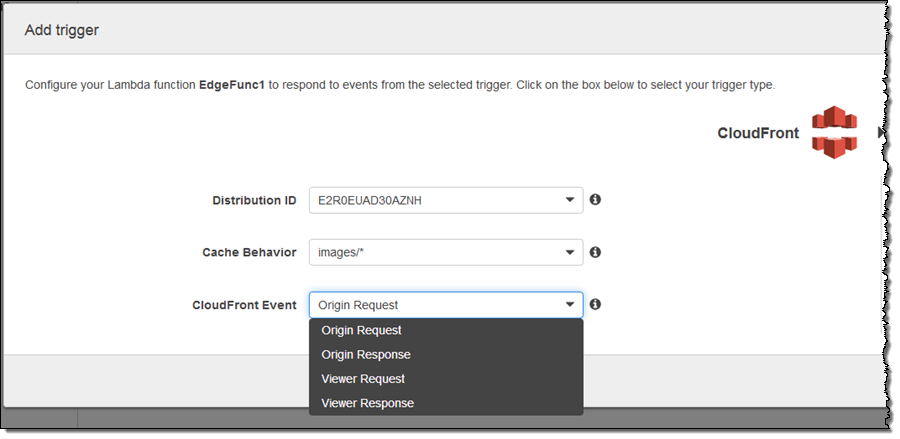
In this case, my function (the imaginatively named EdgeFunc1) would run in response to origin requests for image/* within the indicated distribution. As you can see, you can run code in response to four different CloudFront events:
 Viewer Request – This event is triggered when an event arrives from a viewer (an HTTP client, generally a web browser or a mobile app), and has access to the incoming HTTP request. As you know, each CloudFront edge location maintains a large cache of objects so that it can efficiently respond to repeated requests. This particular event is triggered regardless of whether the requested object is already cached.
Origin Request – This event is triggered when the edge location is about to make a request back to the origin, due to the fact that the requested object is not cached at the edge location. It has access to the request that will be made to the origin (often an S3 bucket or code running on an EC2 instance).
Origin Response – This event is triggered after the origin returns a response to a request. It has access to the response from the origin.
Viewer Response – This is event is triggered before the edge location returns a response to the viewer. It has access to the response.
Functions are globally replicated and requests are automatically routed to the optimal location for execution. You can write your code once and with no overt action on your part, have it be available at low latency to users all over the world.
Your code has full access to requests and responses, including headers, cookies, the HTTP method (GET, HEAD, and so forth), and the URI. Subject to a few restrictions, it can modify existing headers and insert new ones.
Lambda@Edge in Action
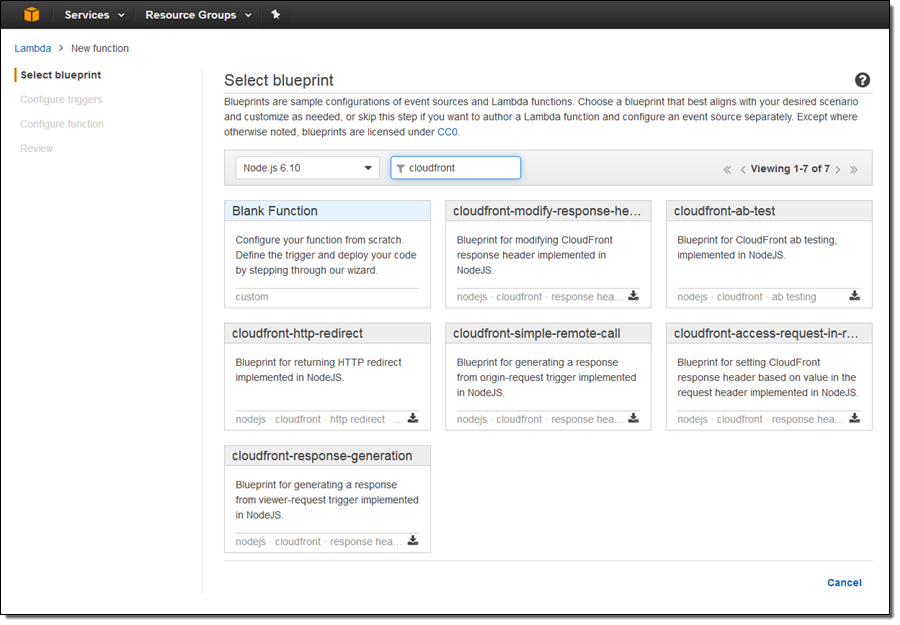
Let’s create a simple function that runs in response to the Viewer Request event. I open up the Lambda Console and create a new function. I choose the Node.js 6.10 runtime and search for cloudfront blueprints:
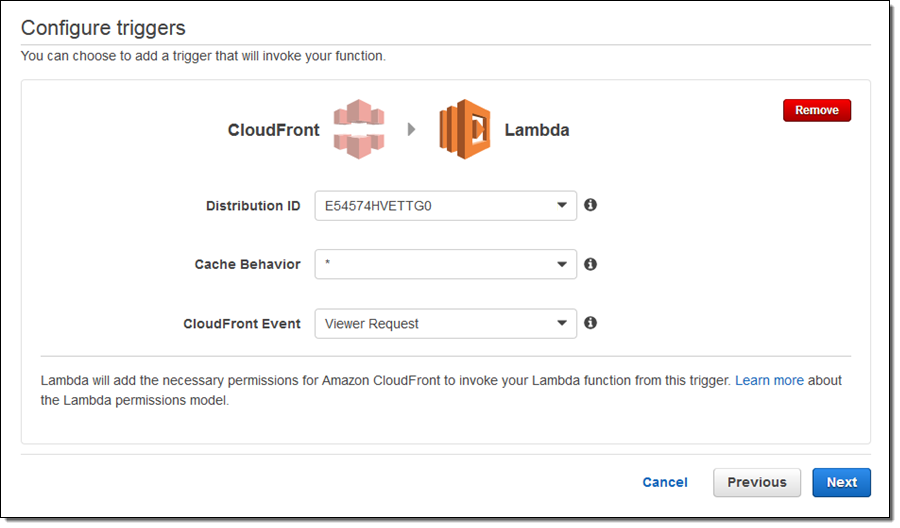
I choose cloudfront-response-generation and configure a trigger to invoke the function:
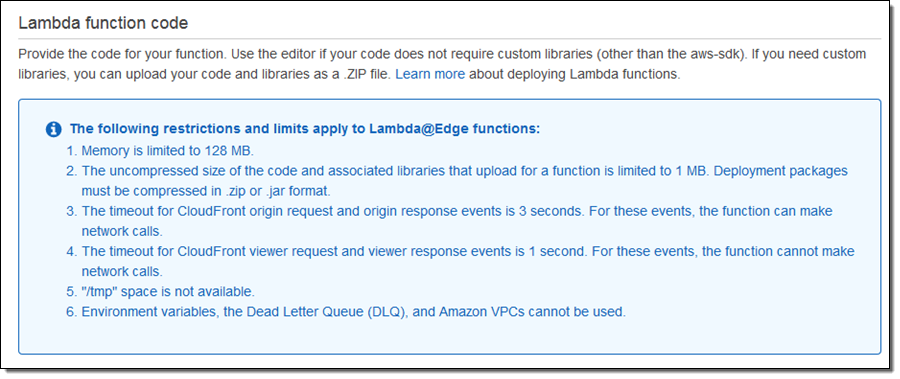
The Lambda Console provides me with some information about the operating environment for my function:
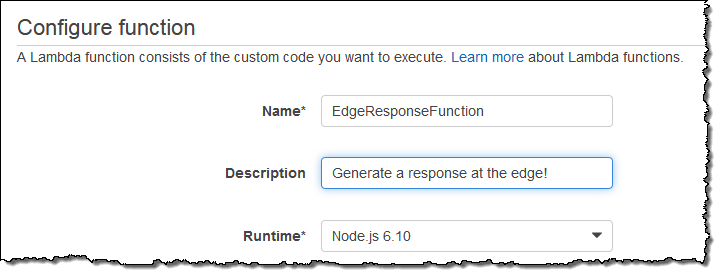
I enter a name and a description for my function, as usual:
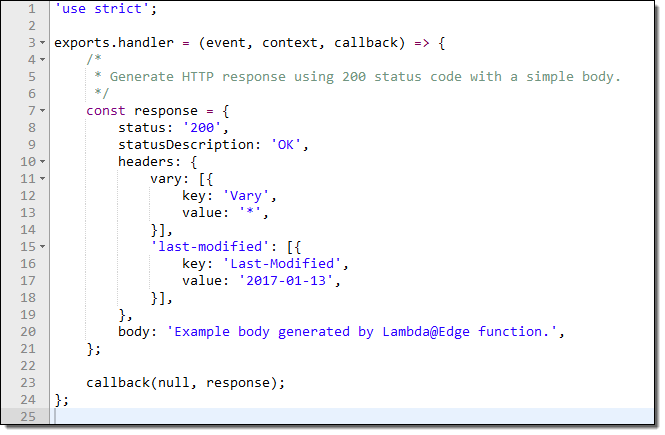
The blueprint includes a fully operational function. It generates a “200” HTTP response and a very simple body:
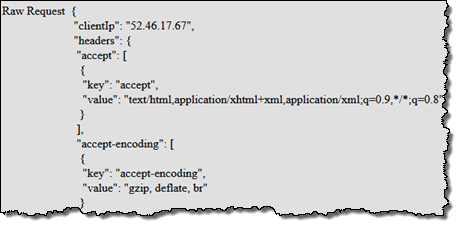
I used this as the starting point for my own code, which pulls some interesting values from the request and displays them in a table:
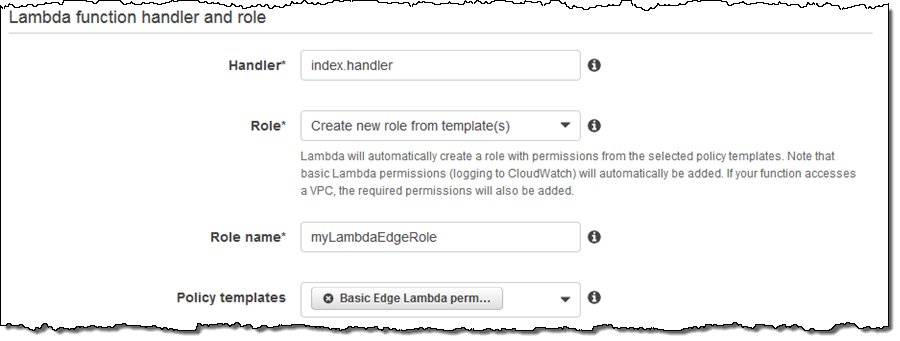
I configure my handler, and request the creation of a new IAM Role with Basic Edge Lambda permissions:
On the next page I confirm my settings (as I would do for a regular Lambda function), and click on Create function:
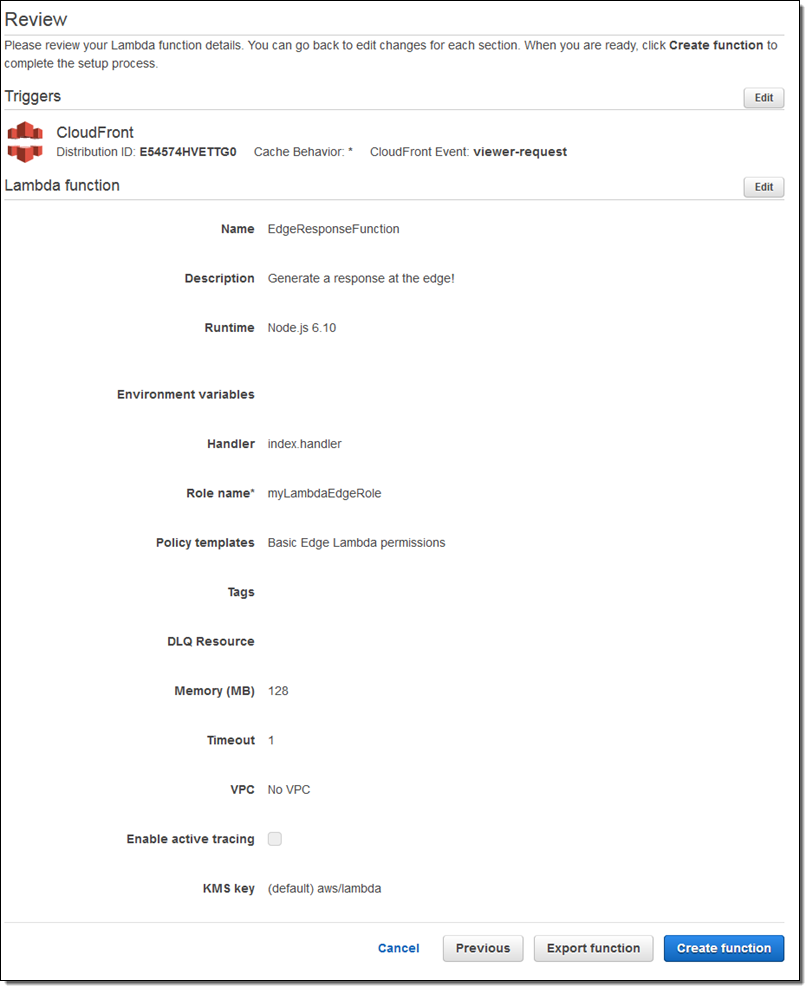
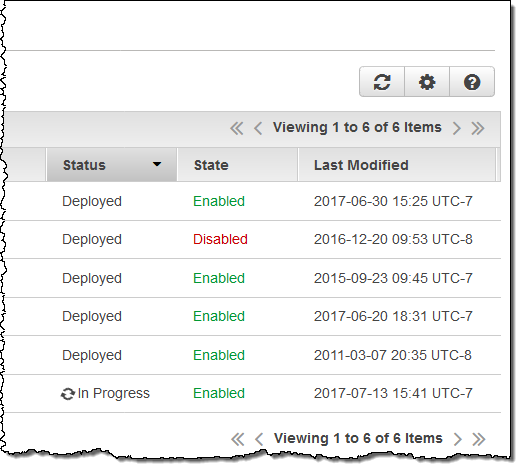
This creates the function, attaches the trigger to the distribution, and also initiates global replication of the function. The status of my distribution changes to In Progress for the duration of the replication (typically 5 to 8 minutes):
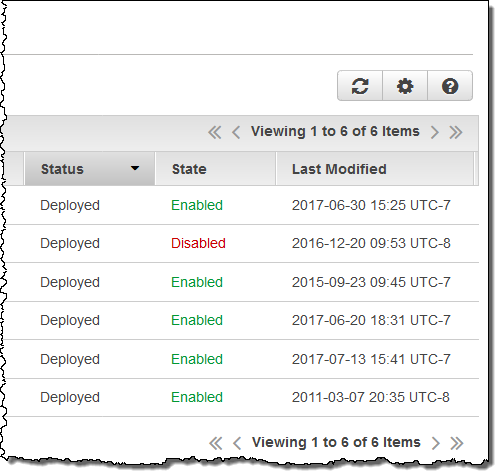
The status changes back to Deployed as soon as the replication completes:
Then I access the root of my distribution (https://dogy9dy9kvj6w.cloudfront.net/), the function runs, and this is what I see:
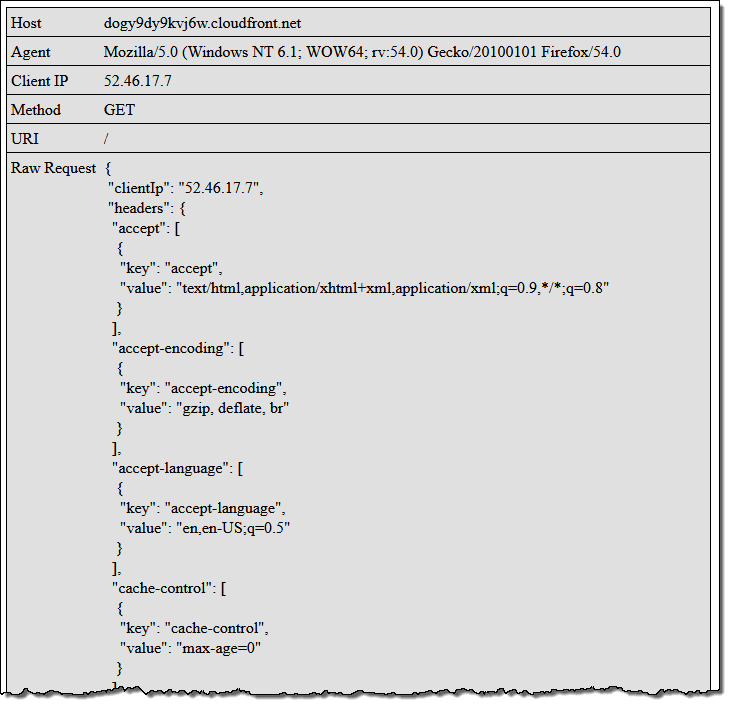 Feel free to click on the image (it is linked to the root of my distribution) to run my code!
As usual, this is a very simple example and I am sure that you can do a lot better. Here are a few ideas to get you started:
Site Management – You can take an entire dynamic website offline and replace critical pages with Lambda@Edge functions for maintenance or during a disaster recovery operation.
High Volume Content – You can create scoreboards, weather reports, or public safety pages and make them available at the edge, both quickly and cost-effectively.
Create something cool and share it in the comments or in a blog post, and I’ll take a look.
Things to Know
Here are a couple of things to keep in mind as you start to think about how to put Lambda@Edge to use in your application:
Timeouts – Functions that handle Origin Request and Origin Response events must complete within 3 seconds. Functions that handle Viewer Request and Viewer Response events must complete within 1 second.
Versioning – After you update your code in the Lambda Console, you must publish a new version and set up a fresh set of triggers for it, and then wait for the replication to complete. You must always refer to your code using a version number; $LATEST and aliases do not apply.
Headers – As you can see from my code, the HTTP request headers are accessible as an array. The headers fall in to four categories:
- Accessible – Can be read, written, deleted, or modified.
- Restricted – Must be passed on to the origin.
- Read-only – Can be read, but not modified in any way.
- Blacklisted – Not seen by code, and cannot be added.
Runtime Environment – The runtime environment provides each function with 128 MB of memory, but no builtin libraries or access to /tmp.
Web Service Access – Functions that handle Origin Request and Origin Response events must complete within 3 seconds can access the AWS APIs and fetch content via HTTP. These requests are always made synchronously with request to the original request or response.
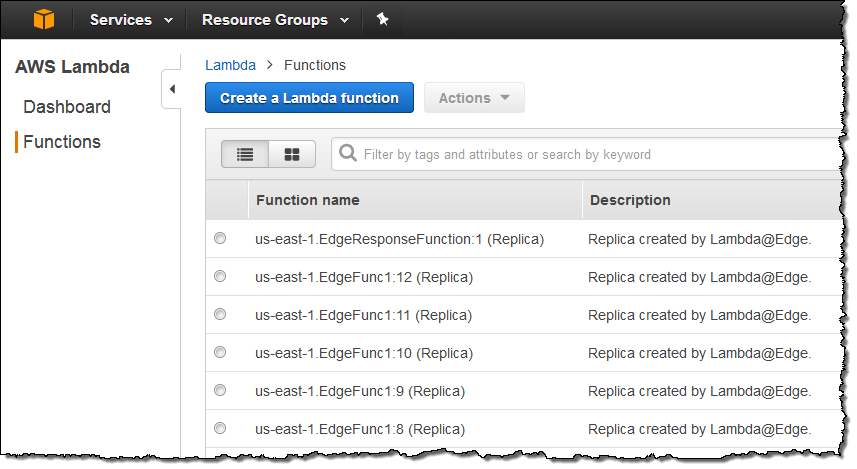
Function Replication – As I mentioned earlier, your functions will be globally replicated. The replicas are visible in the “other” regions from the Lambda Console:
CloudFront – Everything that you already know about CloudFront and CloudFront behaviors is relevant to Lambda@Edge. You can use multiple behaviors (each with up to four Lambda@Edge functions) from each behavior, customize header & cookie forwarding, and so forth. You can also make the association between events and functions (via ARNs that include function versions) while you are editing a behavior:
Available Now
Lambda@Edge is available now and you can start using it today. Pricing is based on the number of times that your functions are invoked and the amount of time that they run (see the Lambda@Edge Pricing page for more info).
— Jeff;
Box Platform on AWS Marketplace – Lambda Blueprints & Sample Code
Box is a cloud-based file sharing and content management system, with an API that recently became available in AWS Marketplace (Box Platform – Cloud Content Management APIs). With an array of features for collaboration and an emphasis on security, Box has found a home in many enterprises (see their success stories page for a list).
The Box API allows developers to build content experiences into web and mobile apps. Today I would like to tell you about some AWS Lambda blueprints and templates that will help you to build AWS applications that use this API to simplify user authentication and to add metadata to newly uploaded content. The templates are based on the Box Node Lambda Sample and should be a robust starting point for your own development.
Let’s take a look at the blueprints and then review some handy blog posts written by our friends at Box.
Box Blueprints for Lambda
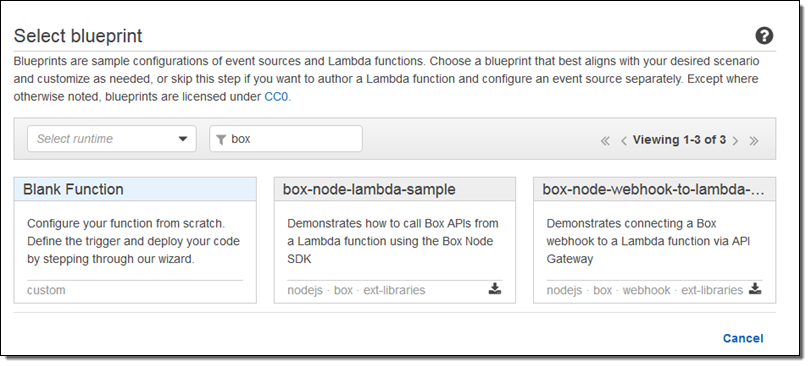
The blueprints show you how to call the Box APIS and to connect a Box webhook to a Lambda function via Amazon API Gateway. To find them, simply open up the Lambda Console and search for box:
The first blueprint uses security credentials stored in the BOX_CONFIG environment variable. You can set the variable from within the Lambda Console:
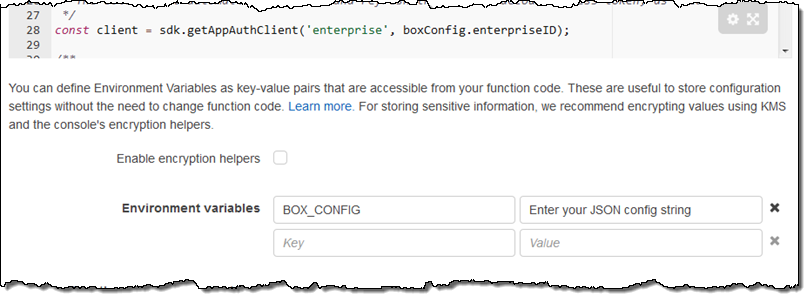
The code in this blueprint retrieves and logs the Box User object for the user identified by the credentials.
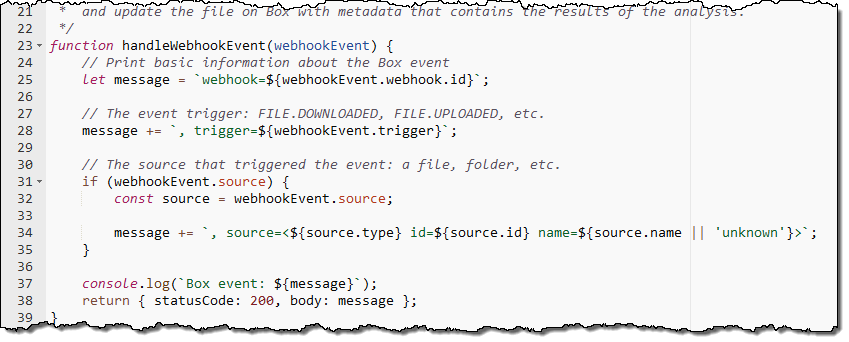
The second blueprint implements a Box webhook that sits behind an API Gateway endpoint. It accepts requests, validates them, and logs them to Amazon CloudWatch:
Handy Blog Posts
The developer relations team at Box has written some blog posts that show you how to use Box in conjunction with several AWS services:
Manage User Authentication with Box Platform using Amazon Cognito – This post shows you how to use Amazon Cognito to power a login page for your app users. Cognito will handle authentication and user pool management and the code outlined in the blog post will create an App User in Box the first time the user logs in. The code is available as box-node-cognito-lambdas-sample on GitHub.
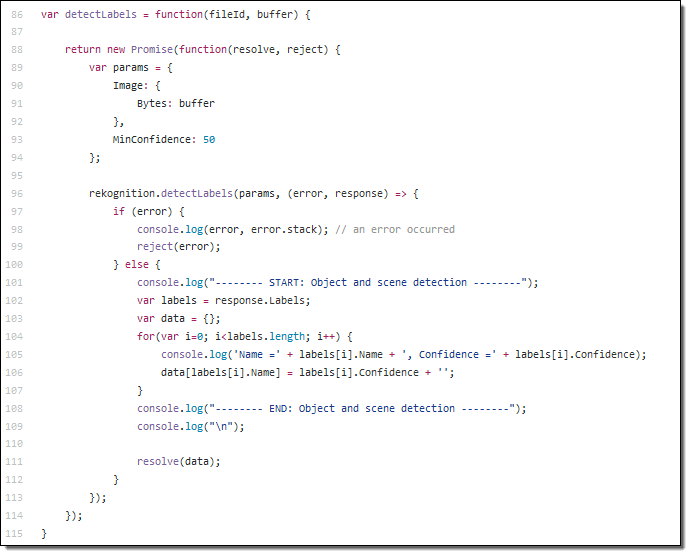
Add Deep Learning-based Image Recognition to your Box App with Amazon Rekognition – This post shows you how to build an image tagging application that is powered by Amazon Rekognition. Users take and upload photos, which are automatically labeled with metadata that that is stored in Amazon DynamoDB. The code is activated by a webhook when a file is uploaded. You can find the code in the box-node-rekognition-webhook on GitHub.
 Thanks to our friends at Box for taking the time to create these helpful developer resources!
— Jeff;
AWS Greengrass – Run AWS Lambda Functions on Connected Devices
![]() I first told you about AWS Greengrass in the post that I published during re:Invent (AWS Greengrass – Ubiquitous Real-World Computing). We launched a limited preview of Greengrass at that time and invited you to sign up if you were interested.
I first told you about AWS Greengrass in the post that I published during re:Invent (AWS Greengrass – Ubiquitous Real-World Computing). We launched a limited preview of Greengrass at that time and invited you to sign up if you were interested.
As I noted at the time, many AWS customers want to collect and process data out in the field, where connectivity is often slow and sometimes either intermittent or unreliable. Greengrass allows them to extend the AWS programming model to small, simple, field-based devices. It builds on AWS IoT and AWS Lambda, and supports access to the ever-increasing variety of services that are available in the AWS Cloud.
Greengrass gives you access to compute, messaging, data caching, and syncing services that run in the field, and that do not depend on constant, high-bandwidth connectivity to an AWS Region. You can write Lambda functions in Python 2.7 and deploy them to your Greengrass devices from the cloud while using device shadows to maintain state. Your devices and peripherals can talk to each other using local messaging that does not pass through the cloud.
Now Generally Available
Today we are making Greengrass generally available in the US East (Northern Virginia) and US West (Oregon) Regions. During the preview, AWS customers were able to get hands-on experience with Greengrass and to start building applications and businesses around it. I’ll share a few of these early successes later in this post.
The Greengrass Core code runs on each device. It allows you to deploy and run Lambda applications on the device, supports local MQTT messaging across a secure network, and also ensures that conversations between devices and the cloud are made across secure connections. The Greengrass Core also supports secure, over-the-air software updates, including Lambda functions. It includes a message broker, a Lambda runtime, a Thing Shadows implementation, and a deployment agent. Greengrass Core and (optionally) other devices make up a Greengrass Group. The group includes configuration data, the list of devices and the identity of the Greengrass Core, a list of Lambda functions, and a set of subscriptions that define where the messages should go. All of this information is copied to the Greengrass core devices during the deployment process.
Your Lambda functions can use APIs in three distinct SDKs:
AWS SDK for Python – This SDK allows your code to interact with Amazon Simple Storage Service (S3), Amazon DynamoDB, Amazon Simple Queue Service (SQS), and other AWS services.
AWS IoT Device SDK – This SDK (available for Node.js, Python, Java, and C++) helps you to connect your hardware devices to AWS IoT. The C++ SDK has a few extra features including access to the Greengrass Discovery Service and support for root CA downloads.
AWS Greengrass Core SDK – This SDK provides APIs that allow local invocation of other Lambda functions, publish messages, and work with thing shadows.
You can run the Greengrass Core on x86 and ARM devices that have version 4.4.11 (or newer) of the Linux kernel, with the OverlayFS and user namespace features enabled. While most deployments of Greengrass will be targeted at specialized, industrial-grade hardware, you can also run the Greengrass Core on a Raspberry Pi or an EC2 instance for development and test purposes.
For this post, I used a Raspberry Pi attached to a BrickPi, connected to my home network via WiFi:
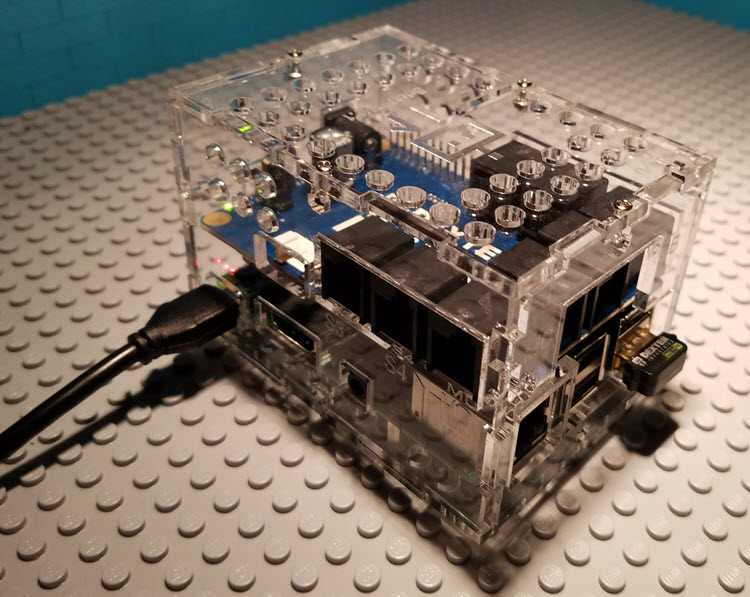
The Raspberry Pi, the BrickPi, the case, and all of the other parts are available in the BrickPi 3 Starter Kit. You will need some Linux command-line expertise and a decent amount of manual dexterity to put all of this together, but if I did it then you surely can.
Greengrass in Action
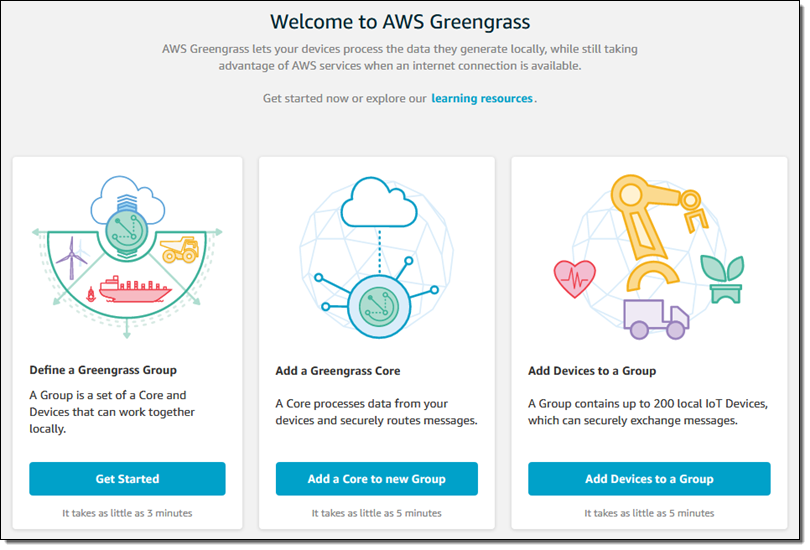
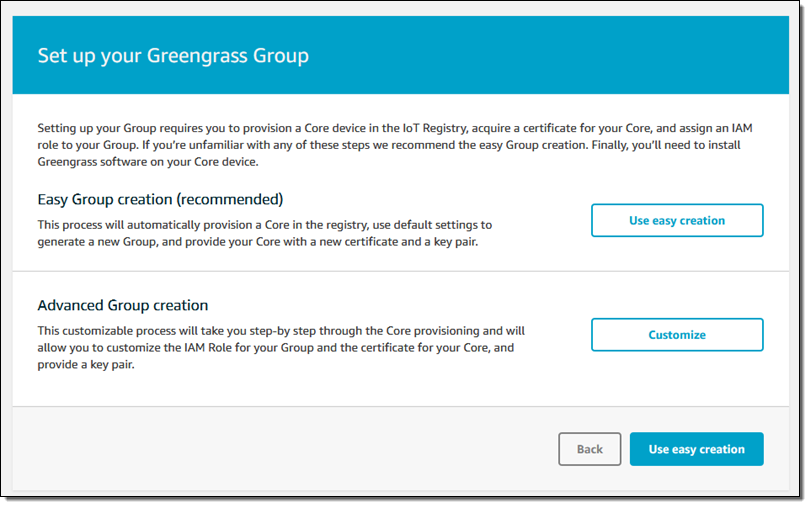
I can access Greengrass from the Console, API, or CLI. I’ll use the Console. The intro page of the Greengrass Console lets me define groups, add Greengrass Cores, and add devices to my groups:
I click on Get Started and then on Use easy creation:
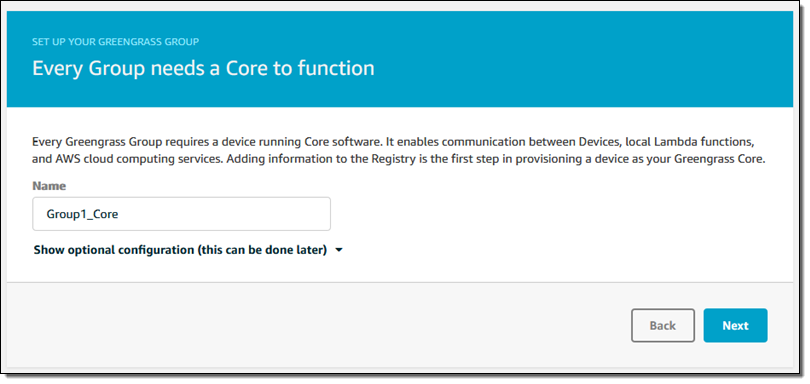
Then I name my group:

And name my first Greengrass Core:
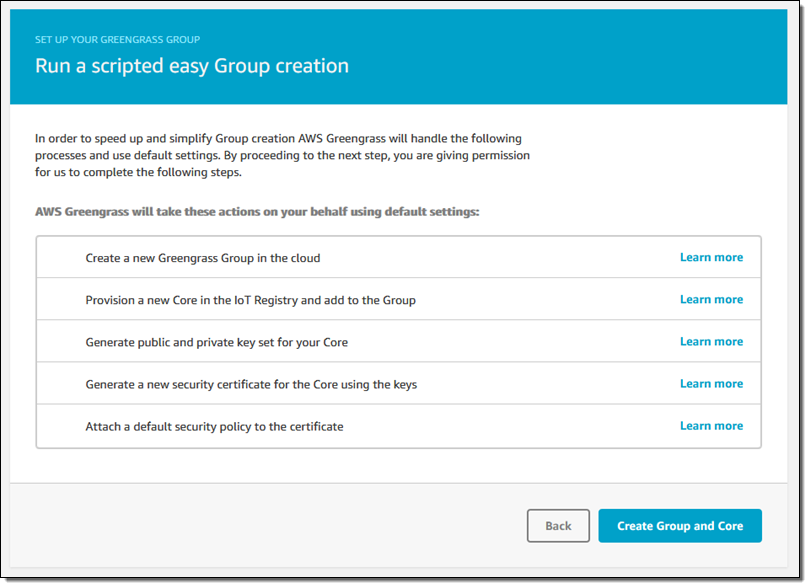
I’m ready to go, so I click on Create Group and Core:
This runs for a few seconds and then offers up my security resources (two keys and a certificate) for downloading, along with the Greengrass Core:
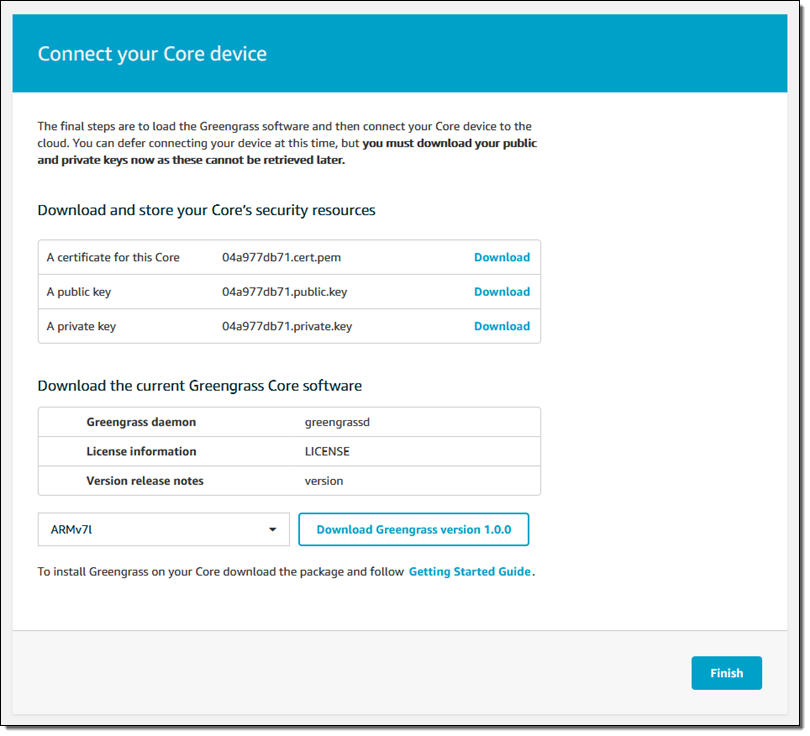
I download the security resources and put them in a safe place, and select and download the desired version of the Greengrass Core software (ARMv7l for my Raspberry Pi), and click on Finish.
Now I power up my Pi, and copy the security resources and the software to it (I put them in an S3 bucket and pulled them down with wget). Here’s my shell history at that point:
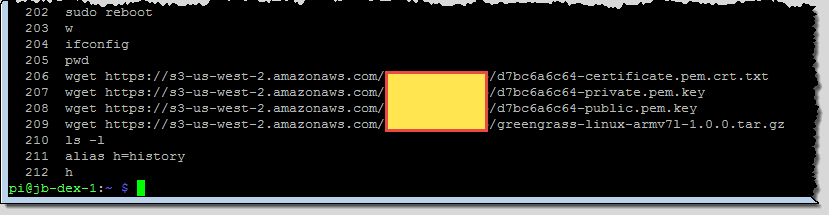
Important Update: As one of my sharp-eyed colleagues on the AWS Security team pointed out, this is not a good way to distribute the secrets to the devices. I could have used the AWS CLI to download them from a encrypted bucket, copied them via cut and paste, or used a USB key.
Following the directions in the user guide, I create a new user and group, run the rpi-update script, and install several packages including sqlite3 and openssl. After a couple of reboots, I am ready to proceed!
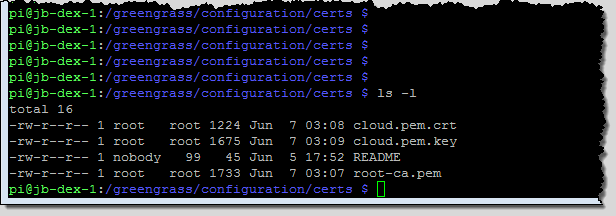
Next, still following the directions, I untar the Greengrass Core software and move the security resources to their final destination (/greengrass/configuration/certs), giving them generic names along the way. Here’s what the directory looks like:
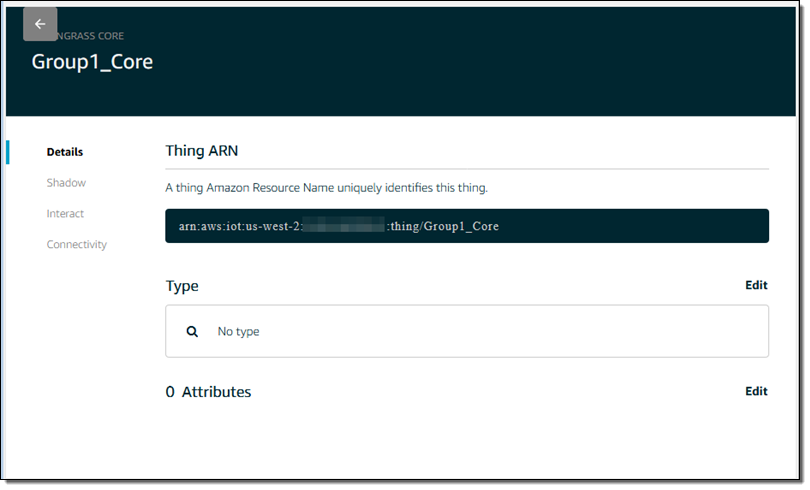
The next step is to associate the core with an AWS IoT thing. I return to the Console, click through the group and the Greengrass Core, and find the Thing ARN:
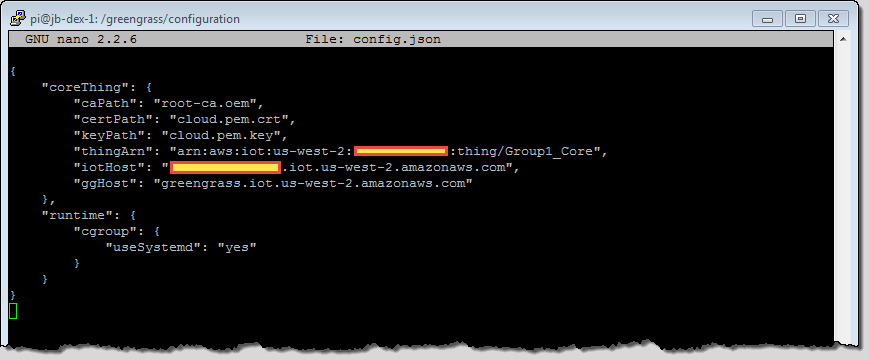
I insert the names of the certificates and the Thing ARN into the config.json file, and also fill in the missing sections of the iotHost and ggHost:
I start the Greengrass demon (this was my second attempt; I had a typo in one of my path names the first time around):
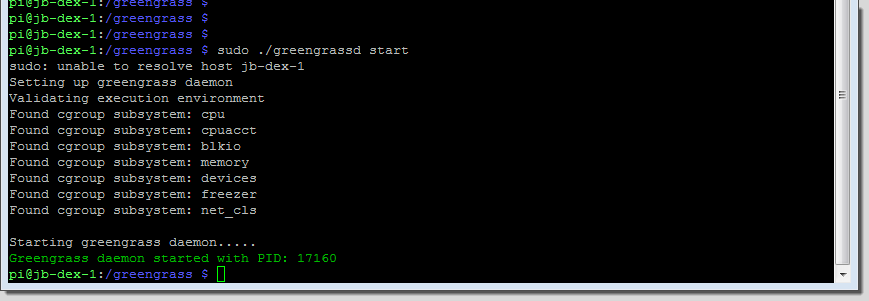
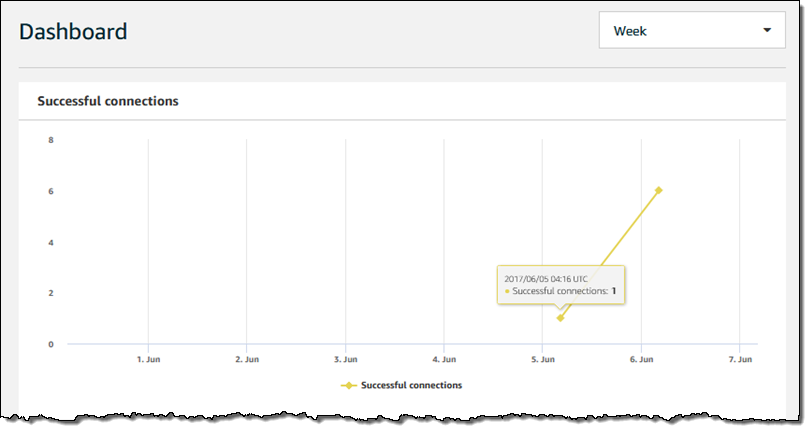
After all of this pleasant time at the command line (taking me back to my Unix v7 and BSD 4.2 days), it is time to go visual once again! I visit my AWS IoT dashboard and see that my Greengrass Core is making connections to IoT:
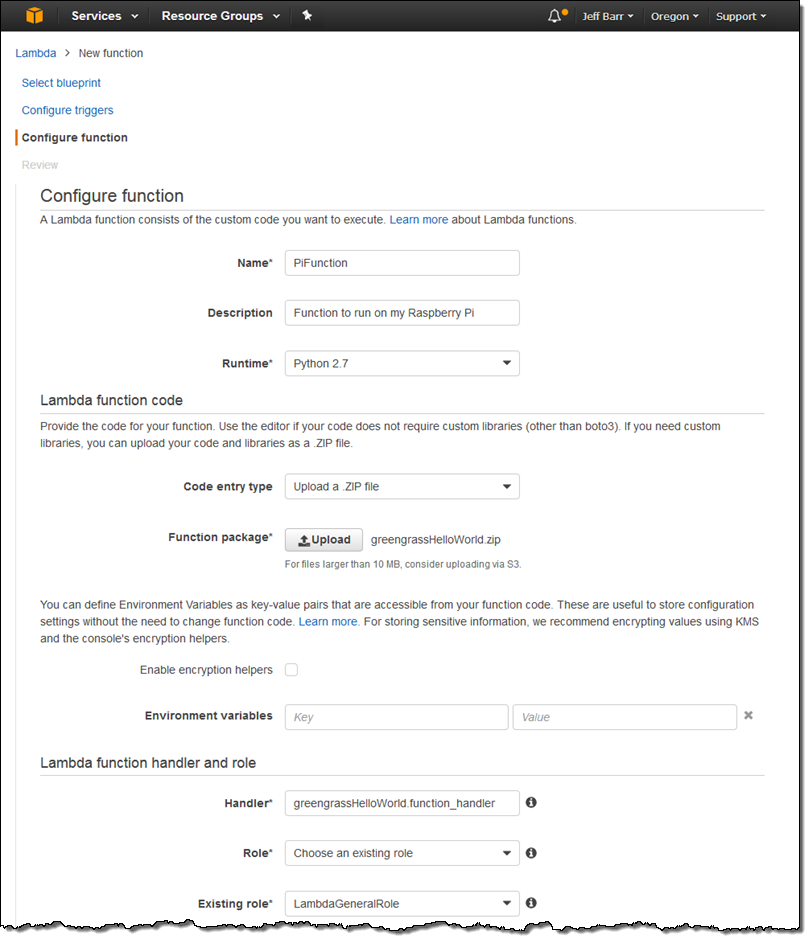
I go to the Lambda Console and create a Lambda function using the Python 2.7 runtime (the IAM role does not matter here):
I publish the function in the usual way and, hop over to the Greengrass Console, click on my group, and choose to add a Lambda function:
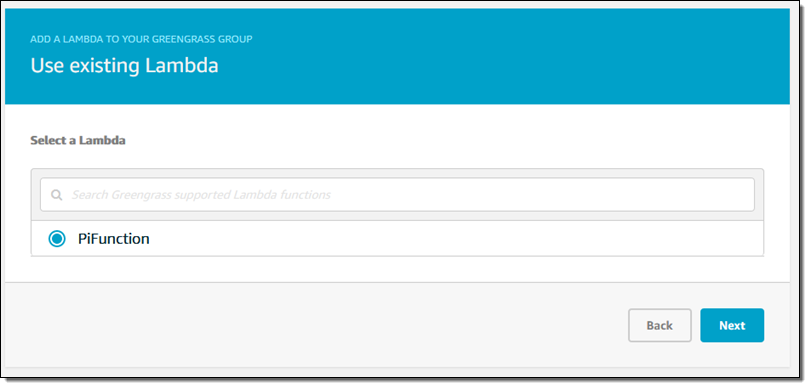
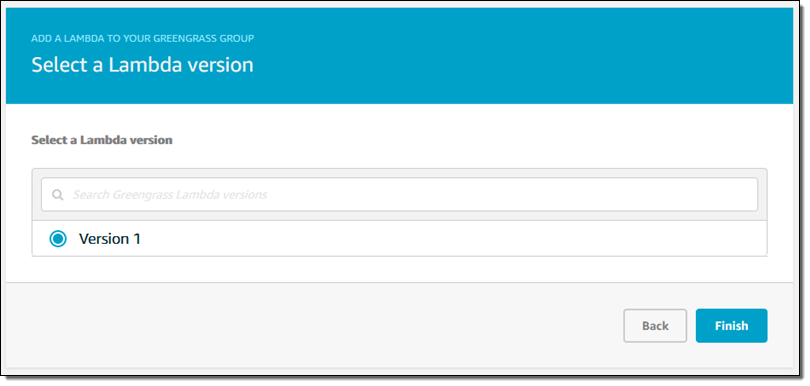
Then I choose the version to deploy:
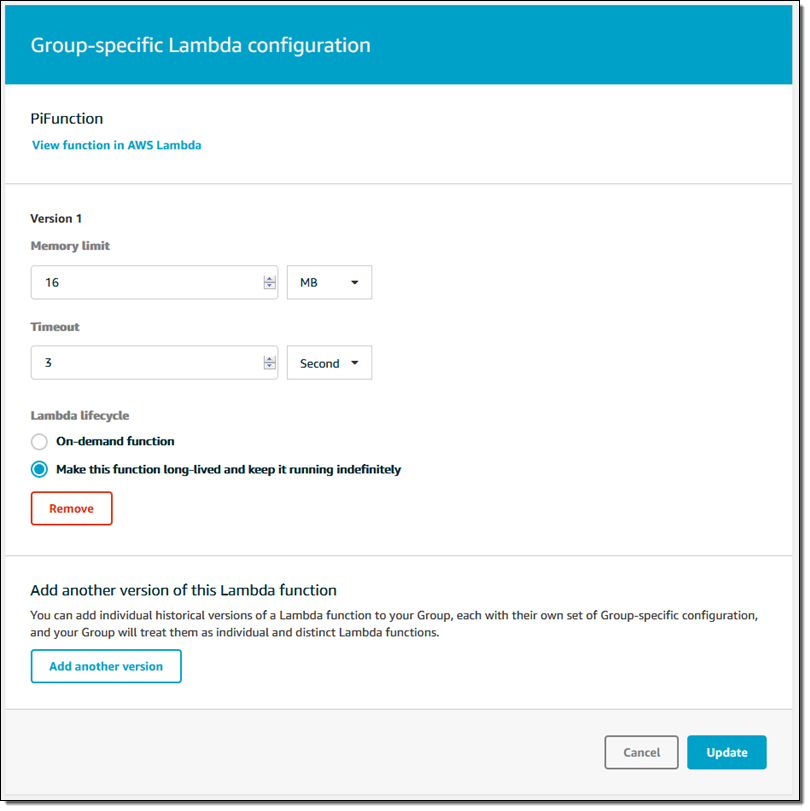
I also configure the function to be long-lived instead of on-demand:
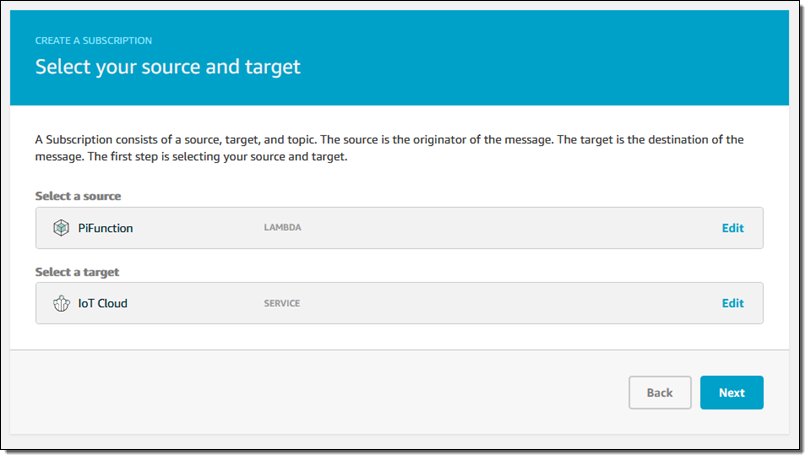
My code will publish messages to AWS IoT, so I create a subscription by specifying the source and destination:
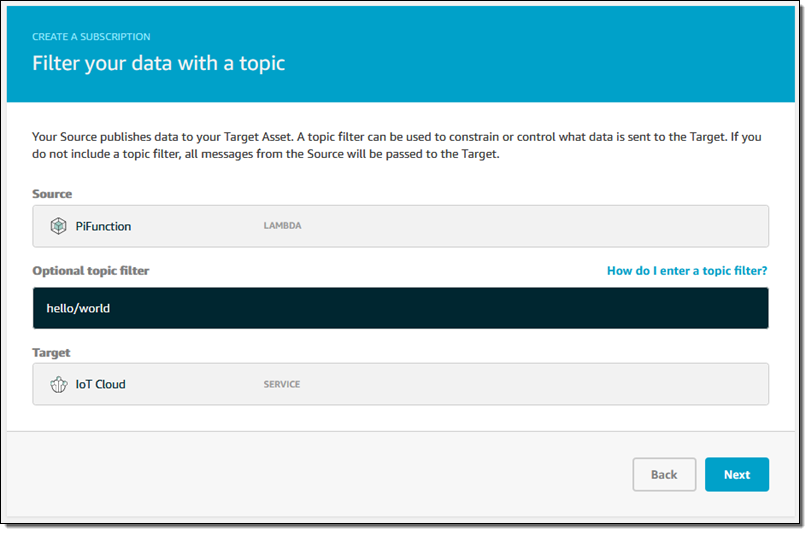
I set up a topic filter (hello/world) on the subscription as well:
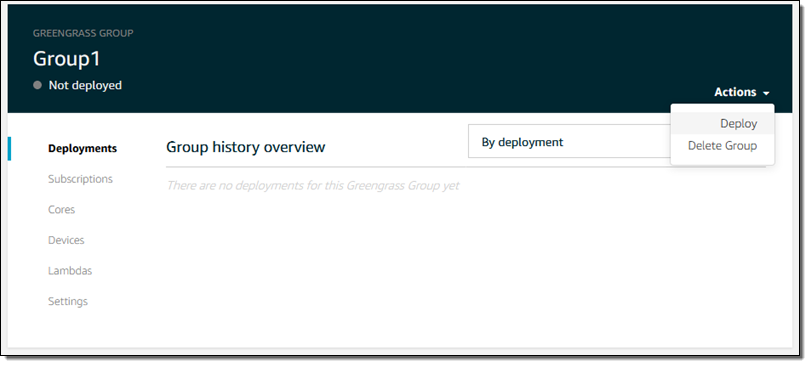
I confirm my settings and save my subscription and I am just about ready to deploy my code. I revisit my group, click on Deployments, and choose Deploy from the Actions menu:
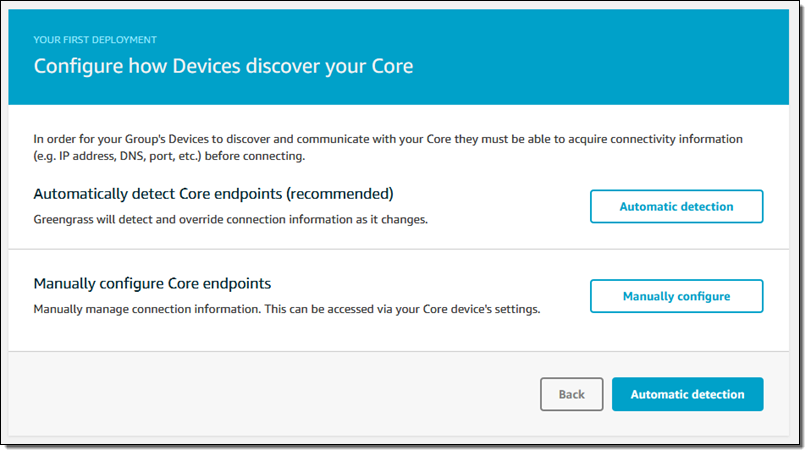
I choose Automatic detection to move forward:
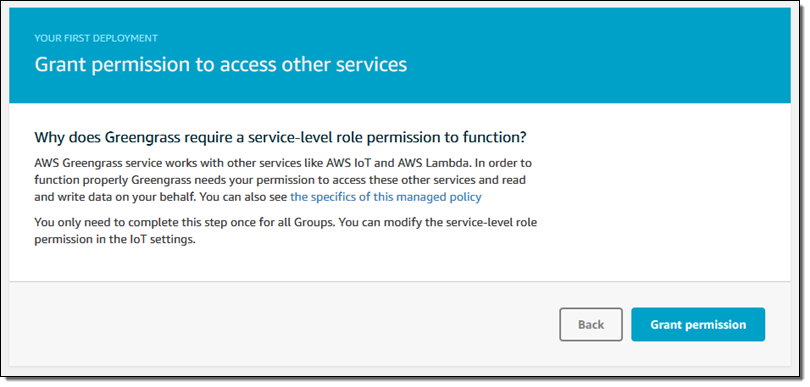
Since this is my first deployment, I need to create a service-level role that gives Greengrass permission to access other AWS services. I simply click on Grant permission:
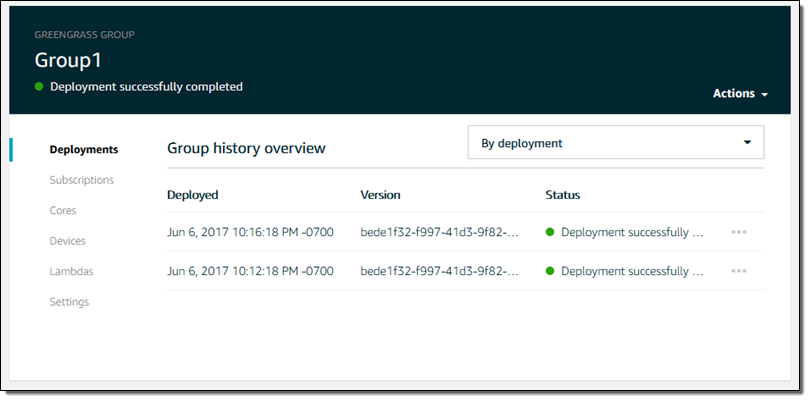
I can see the status of each deployment:
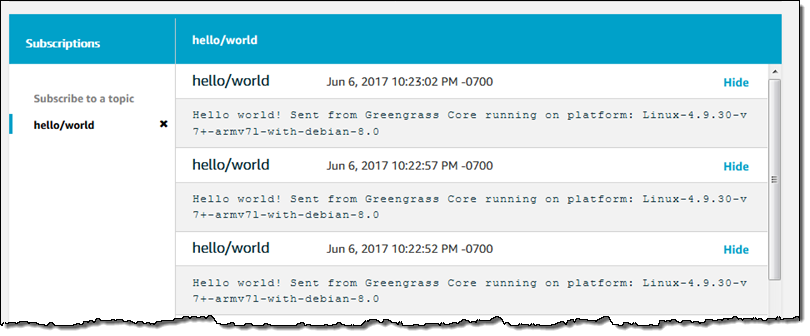
The code is now running on my Pi! It publishes messages to topic hello/world; I can see them by going to the IoT Console, clicking on Test, and subscribing to the topic:
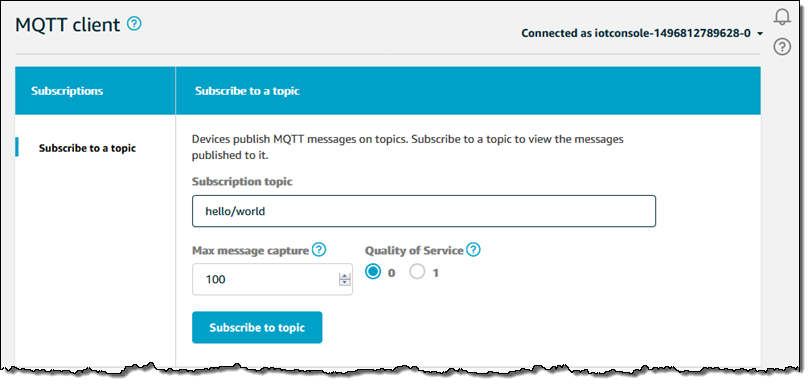
And here are the messages:
With all of the setup work taken care of, I can do iterative development by uploading, publishing, and deploying new versions of my code. I plan to use the BrickPi to control some LEGO Technic motors and to publish data collected from some sensors. Stay tuned for that post!
Greengrass Pricing
You can run the Greengrass Core on three devices free for one year as part of the AWS Free Tier. At the next level (3 to 10,000 devices) two options are available:
- Pay as You Go – $0.16 per month per device.
- Annual Commitment – $1.49 per year per device, a 17.5% savings.
If you want to run the Greengrass Core on more than 10,000 devices or make a longer commitment, please get in touch with us; details on all pricing models are on the Greengrass Pricing page.
— Jeff;
AWS Lambda Support for AWS X-Ray
Today we’re announcing general availability of AWS Lambda support for AWS X-Ray. As you may already know from Jeff’s GA POST, X-Ray is an AWS service for analyzing the execution and performance behavior of distributed applications. Traditional debugging methods don’t work so well for microservice based applications, in which there are multiple, independent components running on different services. X-Ray allows you to rapidly diagnose errors, slowdowns, and timeouts by breaking down the latency in your applications. I’ll demonstrate how you can use X-Ray in your own applications in just a moment by walking us through building and analyzing a simple Lambda based application.
If you just want to get started right away you can easily turn on X-Ray for your existing Lambda functions by navigating to your function’s configuration page and enabling tracing:

Or in the AWS Command Line Interface (CLI) by updating the functions’s tracing-config (Be sure to pass in a --function-name as well):
$ aws lambda update-function-configuration --tracing-config '{"Mode": "Active"}'
When tracing mode is active Lambda will attempt to trace your function (unless explicitly told not to trace by an upstream service). Otherwise, your function will only be traced if it is explicitly told to do so by an upstream service. Once tracing is enabled, you’ll start generating traces and you’ll get a visual representation of the resources in your application and the connections (edges) between them. One thing to note is that the X-Ray daemon does consume some of your Lambda function’s resources. If you’re getting close to your memory limit Lambda will try to kill the X-Ray daemon to avoid throwing an out-of-memory error.
Let’s test this new integration out by building a quick application that uses a few different services.
As twenty-something with a smartphone I have a lot of
pictures
selfies (10000+!) and I thought it would be great to analyze all of them. We’ll write a simple Lambda function with the Java 8 runtime that responds to new images uploaded into an Amazon Simple Storage Service (S3) bucket. We’ll use Amazon Rekognition on the photos and store the detected labels in Amazon DynamoDB.

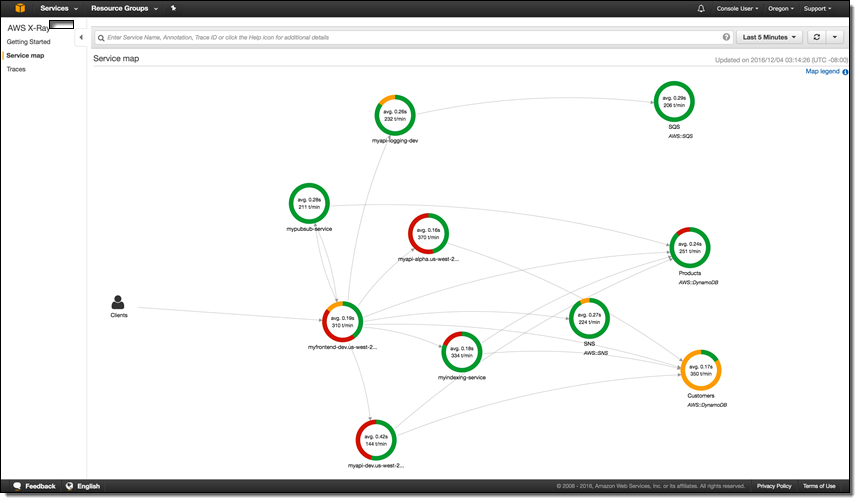
First, let’s define a few quick X-Ray vocabulary words: subsegments, segments, and traces. Got that? X-Ray is easy to understand if you remember that subsegments and segments make up traces which X-Ray processes to generate service graphs. Service graphs make a nice visual representation we can see above (with different colors indicating various request responses). The compute resources that run your applications send data about the work they’re doing in the form of segments. You can add additional annotations about that data and more granular timing of your code by creating subsgements. The path of a request through your application is tracked with a trace. A trace collects all the segments generated by a single request. That means you can easily trace Lambda events coming in from S3 all the way to DynamoDB and understand where errors and latencies are cropping up.
So, we’ll create an S3 bucket called selfies-bucket, a DynamoDB table called selfies-table, and a Lambda function. We’ll add a trigger to our Lambda function for the S3 bucket on ObjectCreated:All events. Our Lambda function code will be super simple and you can look at it in it’s entirety here. With no code changes we can enable X-Ray in our Java function by including the aws-xray-sdk and aws-xray-sdk-recorder-aws-sdk-instrumentor packages in our JAR.
Let’s trigger some photo uploads and get a look at the traces in X-Ray.

We’ve got some data! We can click on one of these individual traces for a lot of detailed information on our invocation.

In the first AWS::Lambda segment we see the dwell time of the function, how long it spent waiting to execute, followed by the number of execution attempts.
In the second AWS::Lambda::Function segment there are a few possible subsegments:
- The inititlization subsegment includes all of the time spent before your function handler starts executing
- The outbound service calls
- Any of your custom subsegments (these are really easy to add)
Hmm, it seems like there’s a bit of an issue on the DynamoDB side. We can even dive deeper and get the full exception stacktrace by clicking on the error icon. You can see we’ve been throttled by DynamoDB because we’re out of write capacity units. Luckily we can add more with just a few clicks or a quick API call. As we do that we’ll see more and more green on our service map!

The X-Ray SDKs make it super easy to emit data to X-Ray, but you don’t have to use them to talk to the X-Ray daemon. For Python, you can check out this library from rackspace called fleece. The X-Ray service is full of interesting stuff and the best place to learn more is by hopping over to the documentation. I’ve been using it for my @awscloudninja bot and it’s working great! Just keep in mind that this isn’t an official library and isn’t supported by AWS.
Personally, I’m really excited to use X-Ray in all of my upcoming projects because it really will save me some time and effort debugging and operating. I look forward to seeing what our customers can build with it as well. If you come up with any cool tricks or hacks please let me know!
– Randall
Announcing the AWS Chatbot Challenge – Create Conversational, Intelligent Chatbots using Amazon Lex and AWS Lambda
If you have been checking out the launches and announcements from the AWS 2017 San Francisco Summit, you may be aware that the Amazon Lex service is now Generally Available, and you can use the service today. Amazon Lex is a fully managed AI service that enables developers to build conversational interfaces into any application using voice and text. Lex uses the same deep learning technologies of Amazon Alexa-powered devices like Amazon Echo. With the release of Amazon Lex, developers can build highly engaging lifelike user experiences and natural language interactions within their own applications. Amazon Lex supports Slack, Facebook Messenger, and Twilio SMS enabling you to easily publish your voice or text chatbots using these popular chat services. There is no better time to try out the Amazon Lex service to add the gift of gab to your applications, and now you have a great reason to get started.
May I have a Drumroll please?
I am thrilled to announce the AWS Chatbot Challenge! The AWS Chatbot Challenge is your opportunity to build a unique chatbot that helps solves a problem or adds value for prospective users. The AWS Chatbot Challenge is brought to you by Amazon Web Services in partnership with Slack.
The Challenge
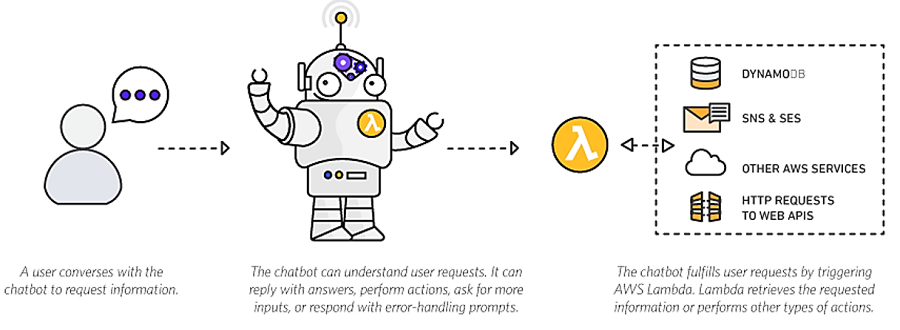
Your mission, if you choose to accept it, is to build a conversational, natural language chatbot using Amazon Lex and leverage Lex’s integration with AWS Lambda to execute logic or data processing on the backend. Your submission can be a new or existing bot, however, if your bot is an existing one it must have been updated to use Amazon Lex and AWS Lambda within the challenge submission period.
You are only limited by your own imagination when building your solution. Therefore, I will share some recommendations to help you to get your creative juices flowing when creating or deploying your bot. Some suggestions that can help you make your chatbot more distinctive are:
- Deploy your bot to Slack, Facebook Messenger, or Twilio SMS
- Take advantage of other AWS services when building your bot solution.
- Incorporate Text-To-speech capabilities using a service like Amazon Polly
- Utilize other third-party APIs, SDKs, and services
- Leverage Amazon Lex pre-built enterprise connectors and add services like Salesforce, HubSpot, Marketo, Microsoft Dynamics, Zendesk, and QuickBooks as data sources.
There are cost effective ways to build your bot using AWS Lambda. Lambda includes a free tier of one million requests and 400,000 GB-seconds of compute time per month. This free, per month usage, is for all customers and does not expire at the end of the 12 month Free Tier Term. Furthermore, new Amazon Lex customers can process up to 10,000 text requests and 5,000 speech requests per month free during the first year. You can find details here.
Remember, the AWS Free Tier includes services with a free tier available for 12 months following your AWS sign-up date, as well as additional service offers that do not automatically expire at the end of your 12 month term. You can review the details about the AWS Free Tier and related services by going to the AWS Free Tier Details page.
Can We Talk – How It Works
The AWS Chatbot Challenge is open to individuals, and teams of individuals, who have reached the age of majority in their eligible area of residence at the time of competition entry. Organizations that employ 50 or fewer people are also eligible to compete as long at the time of entry they are duly organized or incorporated and validly exist in an eligible area. Large organizations-employing more than 50-in eligible areas can participate but will only be eligible for a non-cash recognition prize.
Chatbot Submissions are judged using the following criteria:
- Customer Value: The problem or painpoint the bot solves and the extent it adds value for users
- Bot Quality: The unique way the bot solves users’ problems, and the originality, creativity, and differentiation of the bot solution
- Bot Implementation: Determination of how well the bot was built and executed by the developer. Also, consideration of bot functionality such as if the bot functions as intended and recognizes and responds to most common phrases asked of it
Prizes
The AWS Chatbot Challenge is awarding prizes for your hard work!
First Prize
- $5,000 USD
- $2,500 AWS Credits
- Two (2) tickets to AWS re:Invent
- 30 minute virtual meeting with the Amazon Lex team
- Winning submission featured on the AWS AI blog
- Cool swag
Second Prize
- $3,000 USD
- $1,500 AWS Credits
- One (1) ticket to AWS re:Invent
- 30 minute virtual meeting with the Amazon Lex team
- Winning submission featured on the AWS AI blog
- Cool swag
Third Prize
- $2,000 USD
- $1,000 AWS Credits
- 30 minute virtual meeting with the Amazon Lex team
- Winning submission featured on the AWS AI blog
- Cool swag
Challenge Timeline
- Submissions Start: April 19, 2017 at 12:00pm PDT
- Submissions End: July 18, 2017 at 5:00pm PDT
- Winners Announced: August 11, 2017 at 9:00am PDT
Up to the Challenge – Get Started
Are ready to get started on your chatbot and dive into the challenge? Here is how to get started:
Review the details on the challenge rules and eligibility
- Register for the AWS Chatbot Challenge
- Join the AWS Chatbot Slack Channel
- Create an account on AWS.
- Visit the Resources page for links to documentation and resources.
- Shoot your demo video that demonstrates your bot in action. Prepare a written summary of your bot and what it does.
- Provide a way to access your bot for judging and testing by including a link to your GitHub repo hosting the bot code and all deployment files and testing instructions needed for testing your bot.
- Submit your bot on AWSChatbot2017.Devpost.com before July 18, 2017 at 5 pm ET and share access to your bot, its Github repo and its deployment files.
Summary
With Amazon Lex you can build conversation into web and mobile applications, as well as use it to build chatbots that control IoT devices, provide customer support, give transaction updates or perform operations for DevOps workloads (ChatOps). Amazon Lex provides built-in integration with AWS Lambda, AWS Mobile Hub, and Amazon CloudWatch and allows for easy integrate with other AWS services so you can use the AWS platform for to build security, monitoring, user authentication, business logic, and storage into your chatbot or application. You can make additional enhancements to your voice or text chatbot by taking advantage of Amazon Lex’s support of chat services like Slack, Facebook Messenger, and Twilio SMS.
Dive into building chatbots and conversational interfaces with Amazon Lex and AWS Lambda with the AWS Chatbot Challenge for a chance to win some cool prizes. Some recent resources and online tech talks about creating bots with Amazon Lex and AWS Lambda that may help you in your bot building journey are:
- Announcing Amazon Lex – January 2017 AWS Online Tech Talks
- Introducing Amazon Lex: Service for Building Voice/Text Chatbots – March 2017 AWS Online Tech Talks
- Amazon Lex Documentation: Amazon Lex and AWS Lambda Blueprints
- AWS AI Blog: Building Better Bots Using Amazon Lex (Part 1)
- AWS AI Blog: Building Better Bots Using Amazon Lex (Part 2)
- Slack Blog: Your app can now use the same deep-learning technology inside Amazon’s Alexa: Announcing Amazon Lex support for Slack
- In Europe? Join the Slack Dev Roadshow to learn how to build chatbots in the workshops hosted by the Slack platform team
If you have questions about the AWS Chatbot Challenge you can email aws-chatbot-challenge-2017@amazon.com or post a question to the Discussion Board.
Good Luck and Happy Coding.
– Tara
AWS X-Ray Update – General Availability, Including Lambda Integration
I first told you about AWS X-Ray at AWS re:Invent in my post, AWS X-Ray – See Inside Your Distributed Application. X-Ray allows you to trace requests made to your application as execution traverses Amazon EC2 instances, Amazon ECS containers, microservices, AWS database services, and AWS messaging services. It is designed for development and production use, and can handle simple three-tier applications as well as applications composed of thousands of microservices. As I showed you last year, X-Ray helps you to perform end-to-end tracing of requests, record a representative sample of the traces, see a map of the services and the trace data, and to analyze performance issues and errors. This helps you understand how your application and its underlying services are performing so you can identify and address the root cause of issues.
 You can take a look at the full X-Ray walk-through in my earlier post to learn more.
We launched X-Ray in preview form at re:Invent and invited interested developers and architects to start using it. Today we are making the service generally available, with support in the US East (Northern Virginia), US West (Northern California), US East (Ohio), US West (Oregon), EU (Ireland), EU (Frankfurt), South America (São Paulo), Asia Pacific (Tokyo), Asia Pacific (Seoul), Asia Pacific (Sydney), Asia Pacific (Sydney), and Asia Pacific (Mumbai) Regions.
New Lambda Integration (Preview)
During the preview period we fine-tuned the service and added AWS Lambda integration, which we are launching today in preview form. Now, Lambda developers can use X-Ray to gain visibility into their function executions and performance. Previously, Lambda customers who wanted to understand their application’s latency breakdown, diagnose slowdowns, or troubleshoot timeouts had to rely on custom logging and analysis.
In order to make use of this new integration, you simply ensure that the functions of interest have execution roles that gives the functions permission to write to X-Ray, and then enable tracing on a function-by-function basis (when you create new functions using the console, the proper permissions are assigned automatically). Then you use the X-Ray service map to see how your requests flow through your Lambda functions, EC2 instances, ECS containers, and so forth. You can identify the services and resources of interest, zoom in, examine detailed timing information, and then remedy the issue.
Each call to a Lambda function generates two or more nodes in the X-Ray map:
Lambda Service – This node represents the time spent within Lambda itself.
User Function – This node represents the execution time of the Lambda function.
Downstream Service Calls – These nodes represent any calls that the Lambda function makes to other services.
To learn more, read Using X-Ray with Lambda.
Now Available
We will begin to charge for the usage of X-Ray on May 1, 2017.
Pricing is based on the number of traces that you record, and the number that you analyze (each trace represent a request made to your application). You can record 100,000 traces and retrieve or scan 1,000,000 traces every month at no charge. Beyond that, you pay $5 for every million traces that you record and $0.50 for every million traces that you retrieve for analysis, with more info available on the AWS X-Ray Pricing page. You can visit the AWS Billing Console to see how many traces you have recorded or accessed (data collection began on March 1, 2017).
Check out AWS X-Ray and the new Lambda integration today and let me know what you think!
— Jeff;
Is it on AWS? Domain Identification Using AWS Lambda
In the guest post below, my colleague Tim Bray explains how he built IsItOnAWS.com . Powered by the list of AWS IP address ranges and using a pair of AWS Lambda functions that Tim wrote, the site aims to tell you if your favorite website is running on AWS.
— Jeff;
Is it on AWS?
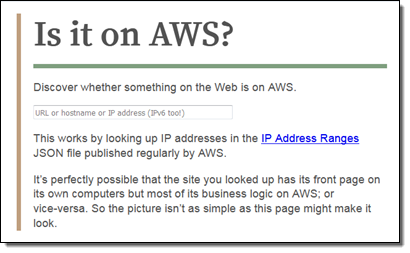
I did some recreational programming over Christmas and ended up with a little Lambda function that amused me and maybe it’ll amuse you too. It tells you whether or not a given domain name (or IP address) (even IPv6!) is in the published list of AWS IP address ranges. You can try it out over at IsItOnAWS.com. Part of the construction involves one Lambda function creating another.
That list of of ranges, given as IPv4 and IPv6 CIDRs wrapped in JSON, is here; the how-to documentation is here and there’s a Jeff Barr blog. Here are a few lines of the “IP-Ranges” JSON:
As soon as I saw it, I thought “I wonder if IsItOnAWS.com is available?” It was, and so I had to build this thing. I wanted it to be:
- Serverless (because that’s what the cool kids are doing),
- simple (because it’s a simple problem, look up a number in a range of numbers), and
- fast. Because well of course.
Database or Not?
 The construction seemed pretty obvious: Simplify the IP-Ranges into a table, then look up addresses in it. So, where to put the table? I thought about Amazon DynamoDB, but it’s not obvious how best to search on what in effect is a numeric range. I thought about SQL databases, where it is obvious, but note #2 above. I thought about Redis or some such, but then you have to provision instances, see #1 above. I actually ended up stuck for a few days scratching my head over this one.
Then a question occurred to me: How big is that list of ranges? It turns out to have less than a thousand entries. So who needs a database anyhow? Let’s just sort that JSON into an array and binary-search it. OK then, where does the array go? Amazon S3 would be easy, but hey, look at #3 above; S3’s fast, but why would I want it in the loop for every request? So I decided to just generate a little file containing the ranges as an array literal, and include it right into the IsItOnAWS Lambda function. Which meant I’d have to rebuild and upload the function every time the IP addresses change.
It turns out that if you care about those addresses, you can subscribe to an Amazon Simple Notification Service (SNS) topic that will notify you whenever it changes (in my recent experience, once or twice a week). And you can hook your subscription up to a Lambda function. With that, I felt I’d found all the pieces anyone could need. There are two Lambda functions: the first, newranges.js, gets the change notifications, generates the JavaScript form of the IP-Ranges data, and uploads a second Lambda function, isitonaws.js, which includes that JavaScript. Vigilant readers will have deduced this is all with the Node runtime.
The new-ranges function, your typical async/waterfall thing, is a little more complex than I’d expected going in.
Postmodern IP Addresses
Its first task is to fetch the IP-Ranges, a straightforward HTTP GET. Then you take that JSON and smooth it out to make it more searchable. Unsurprisingly, there are both IPv4 and IPv6 ranges, and to make things easy I wanted to mash ’em all together into a single array that I could search with simple string or numeric matching. And since IPv6 addresses are way too big for JavaScript numbers to hold, they needed to be strings.
It turns out the way the IPv4 space embeds into IPv6’s ("::ffff:0:0/96") is a little surprising. I’d always assumed it’d be like the BMP mapping into the low bits of Unicode. I idly wonder why it’s this way, but not enough to research it.
The code for crushing all those CIDRs together into a nice searchable array ended up being kind of brutish, but it gets the job done.
Building Lambda in Lambda
Next, we need to construct the lambda that’s going to actually handle the IsItOnAWS request. This has to be a Zipfile, and NPM has tools to make those. Then it was a matter of jamming the zipped bytes into S3 and uploading them to make the new Lambda function.
The sharp-eyed will note that once I’d created the zip, I could have just uploaded it to Lambda directly. I used the S3 interim step because I wanted to to be able to download the generated “ranges” data structure and actually look at it; at some point I may purify the flow.
The actual IsItOnAWS runtime is laughably simple, aside from a bit of work around hitting DNS to look up addresses for names, then mashing them into the same format we used for the ranges array. I didn’t do any HTML templating, just read it out of a file in the zip and replaced an invisible <div> with the results if there were any. Except for, I got to code up a binary search method, which only happens once a decade or so but makes me happy.
Putting the Pieces Together
Once I had all this code working, I wanted to connect it to the world, which meant using Amazon API Gateway. I’ve found this complex in the past, but this time around I plowed through Create an API with Lambda Proxy Integration through a Proxy Resource, and found it reasonably linear and surprise-free.
However, it’s mostly focused on constructing APIs (i.e. JSON in/out) as opposed to human experiences. It doesn’t actually say how to send HTML for a human to consume in a browser, but it’s not hard to figure out. Here’s how (from Node):
Once I had everything hooked up to API Gateway, the last step was pointing isitonaws.com at it. And that’s why I wrote this code in December-January, but am blogging at you now. Back then, Amazon Certificate Manager (ACM) certs couldn’t be used with API Gateway, and in 2017, life is just too short to go through the old-school ceremony for getting a cert approved and hooked up. ACM makes the cert process a real no-brainer. What with ACM and Let’s Encrypt loose in the wild, there’s really no excuse any more for having a non-HTTPS site. Both are excellent, but if you’re using AWS services like API Gateway and CloudFront like I am here, ACM is a smoother fit. Also it auto-renews, which you have to like.
So as of now, hooking up a domain name via HTTPS and CloudFront to your API Gateway API is dead easy; see Use Custom Domain Name as API Gateway API Host Name. Worked for me, first time, but something to watch out for (in March 2017, anyhow): When you get to the last step of connecting your ACM cert to your API, you get a little spinner that wiggles at you for several minutes while it hooks things up; this is apparently normal. Fortunately I got distracted and didn’t give up and refresh or cancel or anything, which might have screwed things up.
By the way, as a side-effect of using API Gateway, this is all running through CloudFront. So what with that, and not having a database, you’d expect it to be fast. And yep, it sure is, from here in Vancouver anyhow. Fast enough to not bother measuring.
I also subscribed my email to the “IP-Ranges changed” SNS topic, so every now and then I get an email telling me it’s changed, and I smile because I know that my Lambda wrote a new Lambda, all automatic, hands-off, clean, and fast.
— Tim Bray, Senior Principal Engineer
Announcing the AWS Health Tools Repository
Tipu Qureshi and Ram Atur join us today with really cool news about a Git repository for AWS Health / Personal Health Dashboard.
-Ana
Today, we’re happy to release the AWS Health Tools repository, a community-based source of tools to automate remediation actions and customize Health alerts.
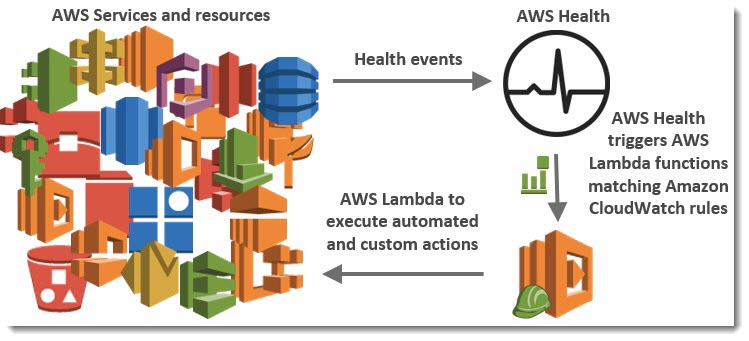
The AWS Health service provides personalized information about events that can affect your AWS infrastructure, guides you through scheduled changes, and accelerates the troubleshooting of issues that affect your AWS resources and accounts. The AWS Health API also powers the Personal Health Dashboard, which gives you a personalized view into the performance and availability of the AWS services underlying your AWS resources. You can use Amazon CloudWatch Events to detect and react to changes in the status of AWS Personal Health Dashboard (AWS Health) events.
AWS Health Tools takes advantage of the integration of AWS Health, Amazon CloudWatch Events and AWS Lambda to implement customized automation in response to events regarding your AWS infrastructure. As an example, you can use AWS Health Tools to pause your deployments that are part of AWS CodePipeline when a CloudWatch event is generated in response to an AWS Health issue.
The AWS Health Tools repository empowers customers to effectively utilize AWS Health events by tapping in to the collective ingenuity and expertise of the AWS community. The repository is free, public, and hosted on an independent platform. Furthermore, the repository contains full source code, allowing you to learn and contribute. We look forward to working together to leverage the combined wisdom and lessons learned by our experts and experts in the broader AWS user base.
Here’s a sample of the AWS Health tools that you now have access to:
- SMS Notifier – Send custom text or SMS notifications.
- SNS Topic Publisher – Publish to an SNS topic.
- Slack Notifier – Post to a Slack channel.
- Instance Store Degraded Drive – Stop or terminate an instance that has a degraded instance store drive.
- Disable AWS CodePipeline Stage Transition – Stop deployment when an issue arises.
To get started using these tools in your AWS account, see the readme file on GitHub. We encourage you to use this repository to share with the AWS community the AWS Health Tools you have written
-Tipu Qureshi and Ram Atur
AWS Lambda – A Look Back at 2016
2016 was an exciting year for AWS Lambda, Amazon API Gateway and serverless compute technology, to say the least. But just in case you have been hiding away and haven’t heard of serverless computing with AWS Lambda and Amazon API Gateway, let me introduce these great services to you. AWS Lambda lets you run code without provisioning or managing servers, making it a serverless compute service that is event-driven and allows developers to bring their functions to the cloud easily for virtually any type of application or backend. Amazon API Gateway helps you quickly build highly scalable, secure, and robust APIs at scale and provides the ability to maintain and monitor created APIs.
With the momentum of serverless in 2016, of course, the year had to end with a bang as the AWS team launched some powerful service features at re:Invent to make it even easier to build serverless solutions. These features include:
- AWS Greengrass: Run local compute, messaging & data caching for connected IoT devices using Lambda and AWS IoT; https://aws.amazon.com/blogs/aws/aws-greengrass-ubiquitous-real-world-computing/
- Lambda@Edge Preview: New Lambda feature that allows code to be run at global AWS edge locations and triggered in response to Amazon CloudFront requests to reduce network latency to end users; https://aws.amazon.com/blogs/aws/coming-soon-lambda-at-the-edge/
- AWS Batch Preview: Batch computing workload planning, scheduling, and execution across AWS compute services including upcoming Lambda integration as a batch Job; https://aws.amazon.com/blogs/aws/aws-batch-run-batch-computing-jobs-on-aws/
- AWS X-Ray: Analyze and debug distributed applications, such as those built using a microservices architecture, written in Java, Node.js, and .NET deployed on EC2, ECS, AWS Elastic Beanstalk, and upcoming AWS Lambda support; https://aws.amazon.com/blogs/aws/aws-x-ray-see-inside-of-your-distributed-application/
- Continuous Deployment for Serverless: AWS services to create a continuous deployment pipeline for your serverless applications; https://aws.amazon.com/blogs/compute/continuous-deployment-for-serverless-applications/
- Step Functions: Using visual workflows as a reliable way to organize the components of microservices and distributed applications; https://aws.amazon.com/blogs/aws/new-aws-step-functions-build-distributed-applications-using-visual-workflows/
- Snowball Edge: Petabyte-scale data transport appliance with on-board storage and Lambda-powered local processing: https://aws.amazon.com/blogs/aws/aws-snowball-edge-more-storage-local-endpoints-lambda-functions/
- Dead Letter Queues: Support for Lambda function failure notifications to queue or another notification system
- C# Support: C# code as a supported language for AWS Lambda
- API Gateway Monetization: Integration of API Gateway with AWS Marketplace
- API Gateway Developer Portal: Open source serverless web application to get started building your own developer portal
Since Jeff has already introduced most of the aforementioned new service features for building distributed applications and microservices like Step Functions, let’s walk-through the last four new features not yet discussed using a common serverless use case example: Real-time Stream Processing. In our walk-through of the stream processing use case, we will implement a Dead Letter Queue for notifications of errors that may come from the Lambda function processing a stream of data, we will take an existing Lambda function written in Node.js to process the stream and rewrite it using the C# language. We then will build an example of the monetization of a Lambda backed API using API Gateway’s integration with AWS Marketplace. This will be exciting, so let’s get started.
During the AWS Developer Days in San Francisco and Austin, I presented an example of leveraging AWS Lambda for real-time stream processing by building a demo showcasing a streaming solution with Twitter Streaming APIs. I will build upon this example to demonstrate the power of Dead Letter Queues (DLQ), C# Support, API Gateway Monetization features, and the open source template for API Gateway Developer Portal. In the demo, a console or web application streams tweets gathered from the Twitter Streaming API that has the keywords ‘awscloud’ and/or ‘serverless’. Those tweets are sent real-time to Amazon Kinesis Streams where Lambda detects the new records and processes the stream batch by writing the tweets to the NoSQL database, Amazon DynamoDB.
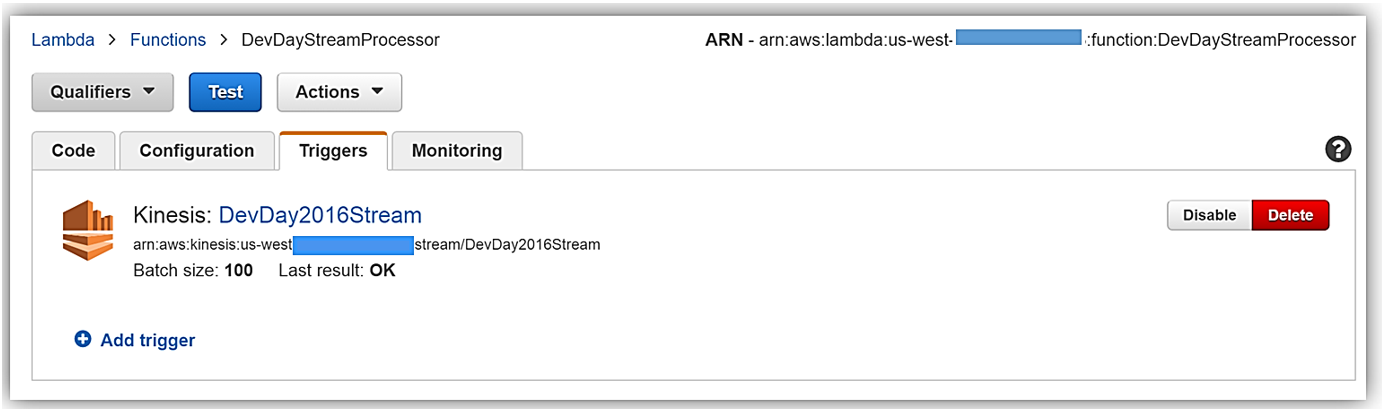
Now that we understand the real-time streaming process demo’s workflow, let’s take a deeper look at the Lambda function that processes the batch records from Kinesis. First, you will notice below that the Lambda function, DevDayStreamProcessor, has an event source or trigger that is a Kinesis stream named DevDay2016Stream with a Batch size of 100. Our Lambda function will poll the stream periodically for new records and automatically read and process batches of records, in this case, the tweets detected on the stream.
Now we will examine our Lambda function code which is written in Node.js 4.3. The section of the Lambda function shown below loops through the batch of tweet records from our Kinesis stream, parses each record, and writes desired tweet information into an array of JSON data. The array of the JSON tweet items is passed to the function, ddbItemsWrite which is outside of our Lambda handler.
'use strict';
console.log('Loading function');

var timestamp;
var twitterID;
var tweetData;
var ddbParams;
var itemNum = 0;
var dataItemsBatch = [];
var dbBatch = [];
var AWS = require('aws-sdk');
var ddbTable = 'TwitterStream';
var dynamoDBClient = new AWS.DynamoDB.DocumentClient();

exports.handler = (event, context, callback) => {
    var counter = 0;

    event.Records.forEach((record) => {
        // Kinesis data is base64 encoded so decode here
        console.log("Base 64 record: " + JSON.stringify(record, null, 2));
        const payload = new Buffer(record.kinesis.data, 'base64').toString('ascii');
        console.log('Decoded payload:', payload);

        var data = payload.replace(/[\u0000-\u0019]+/g," ");
        try
        {  tweetData = JSON.parse(data);   }
        catch(err)
        {  callback(err, err.stack);   }

        timestamp = "" + new Date().getTime();
        twitterID = tweetData.id.toString();
        itemNum = itemNum+1;

         var ddbItem = {
                PutRequest: {
                    Item: {
                        TwitterID: twitterID,
                        TwitterUser: tweetData.username.toString(),
                        TwitterUserPic: tweetData.pic,
                        TwitterTime: new Date(tweetData.time.replace(/( \+)/, ' UTC$1')).toLocaleString(),
                        Tweet: tweetData.text,
                        TweetTopic: tweetData.topic,
                        Tags: (tweetData.hashtags) ? tweetData.hashtags : " ",
                        Location: (tweetData.loc) ? tweetData.loc : " ",
                        Country: (tweetData.country) ? tweetData.country : " ",
                        TimeStamp: timestamp,
                        RecordNum: itemNum
                    }
                }
            };

            dataItemsBatch.push(ddbItem);
            counter++;
});

    var twitterItems = {};
    twitterItems[ddbTable] = dataItemsBatch;
    ddbItemsWrite(twitterItems, 0, context, callback);

};
The ddbItemsWrite function shown below will take the array of JSON tweet records processed from the Kinesis stream, and write the records multiple items at a time to our DynamoDB table using batch operations. This function leverages the DynamoDB best practice of retrying unprocessed items by implementing an exponential backoff algorithm to prevent write request failures due to throttling on the individual tables.
 function ddbItemsWrite(items, retries, ddbContext, ddbCallback)
    {
        dynamoDBClient.batchWrite({ RequestItems: items }, function(err, data)
            {
                if (err)
                {
                    console.log('DDB call failed: ' + err, err.stack);
                    ddbCallback(err, err.stack);
                }
                else
                {
                    if(Object.keys(data.UnprocessedItems).length)
                    {
                        console.log('Unprocessed items remain, retrying.');
                        var delay = Math.min(Math.pow(2, retries) * 100, ddbContext.getRemainingTimeInMillis() - 200);
                        setTimeout(function() {ddbItemsWrite(data.UnprocessedItems, retries + 1, ddbContext, ddbCallback)}, delay);
                    }
                    else
                    {
                         ddbCallback(null, "Success");
                         console.log("Completed Successfully");
                    }
                }
            }
        );
    }
Currently, this Lambda function works as expected and will successfully process tweets captured in Kinesis from the Twitter Streaming API, however, this function has a flaw that will cause an error to occur when processing batch write requests to our DynamoDB table. In the Lambda function, the current code does not take into account that the DynamoDB batchWrite function should be comprised of no more than 25 write (put) requests per single call to this function up to 16 MB of data. Therefore, without changing the code appropriately to have the ddbItemsWrite function to handle batches of 25 or have the handler function put items in the array in groups of 25 requests before sending to the ddbItemsWrite function; there will be a validation exception thrown when the batch of tweets items sent is greater than 25. This is a great example of a bug that is not easily detected in small-scale testing scenarios yet will cause failures under production load.
Dead Letter Queues
Now that we are aware of an event that will cause the ddbItemsWrite Lambda function to throw an exception and/or an event that will fail while processing records, we have a first-rate scenario for leveraging Dead Letter Queues (DLQ).
Since AWS Lambda DLQ functionality is only available for asynchronous event sources like Amazon S3, Amazon SNS, AWS IoT or direct asynchronous invocations, and not for streaming event sources such as Amazon Kinesis or Amazon DynamoDB streams; our first step is to break this Lambda function into two functions. The first Lambda function will handle the processing of the Kinesis stream, and the second Lambda function will take the data processed by the first function and write the tweet information to DynamoDB. We will then setup our DLQ on the second Lambda function for the error that will occur on writing the batch of tweets to DynamoDB as noted above.
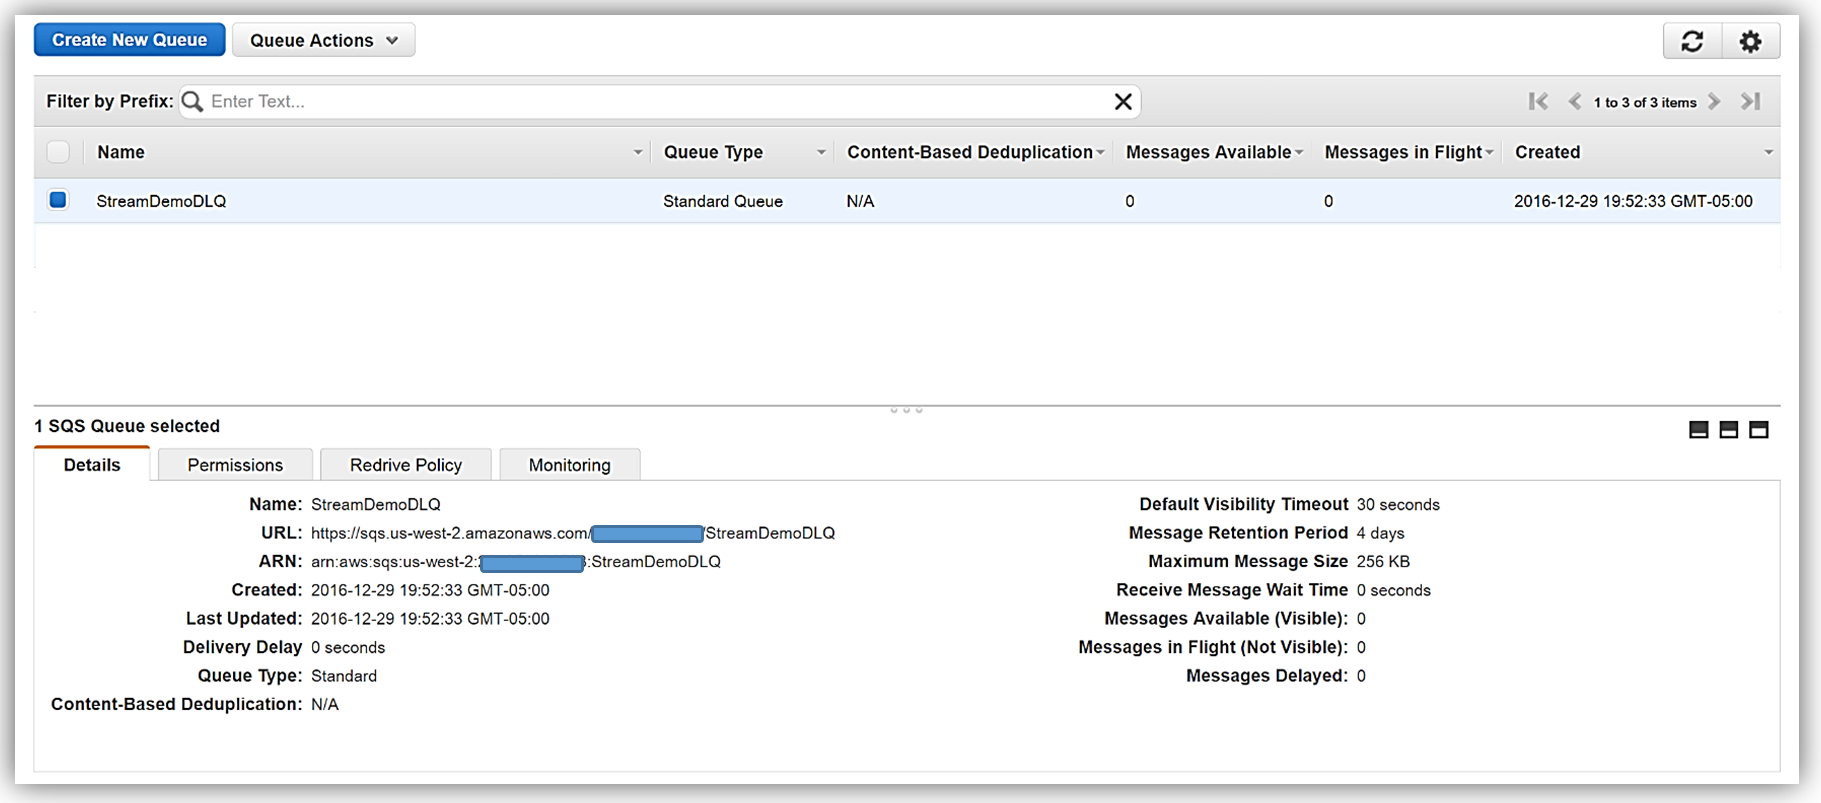
We have two options when setting up a target for our DLQ; Amazon SNS topic or an Amazon SQS queue. In this walk-through, we will opt for using an Amazon SQS queue. Therefore, my first step in using DLQ is to create a SQS Standard queue. A Standard queue type is a queue which has high transactions throughput, a message will be delivered at least once, but another copy of the message may also be delivered, and it is possible that messages might be delivered in an order different from which they were sent. You can learn more about creating SQS queues and queue type in the Amazon SQS documentation.
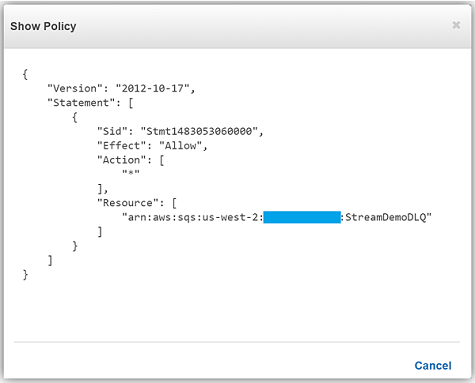
Once my queue, StreamDemoDLQ, is created, I will grab the ARN from the Details tab of this selected queue. If I am not using the console to designate the DLQ resource for this function, I will need the ARN for the queue for my Lambda function to identify this SQS queue as the DLQ target for error and event failure notifications. Additionally, I will use the ARN to add permissions to my Lambda execution role policy in order to access this SQS queue.
I will now return to my Lambda function and select the Configuration tab and expand the Advanced settings section. I will select SQS in the DLQ Resource field and select my StreamDemoDLQ queue in the SQS Queue field dropdown.
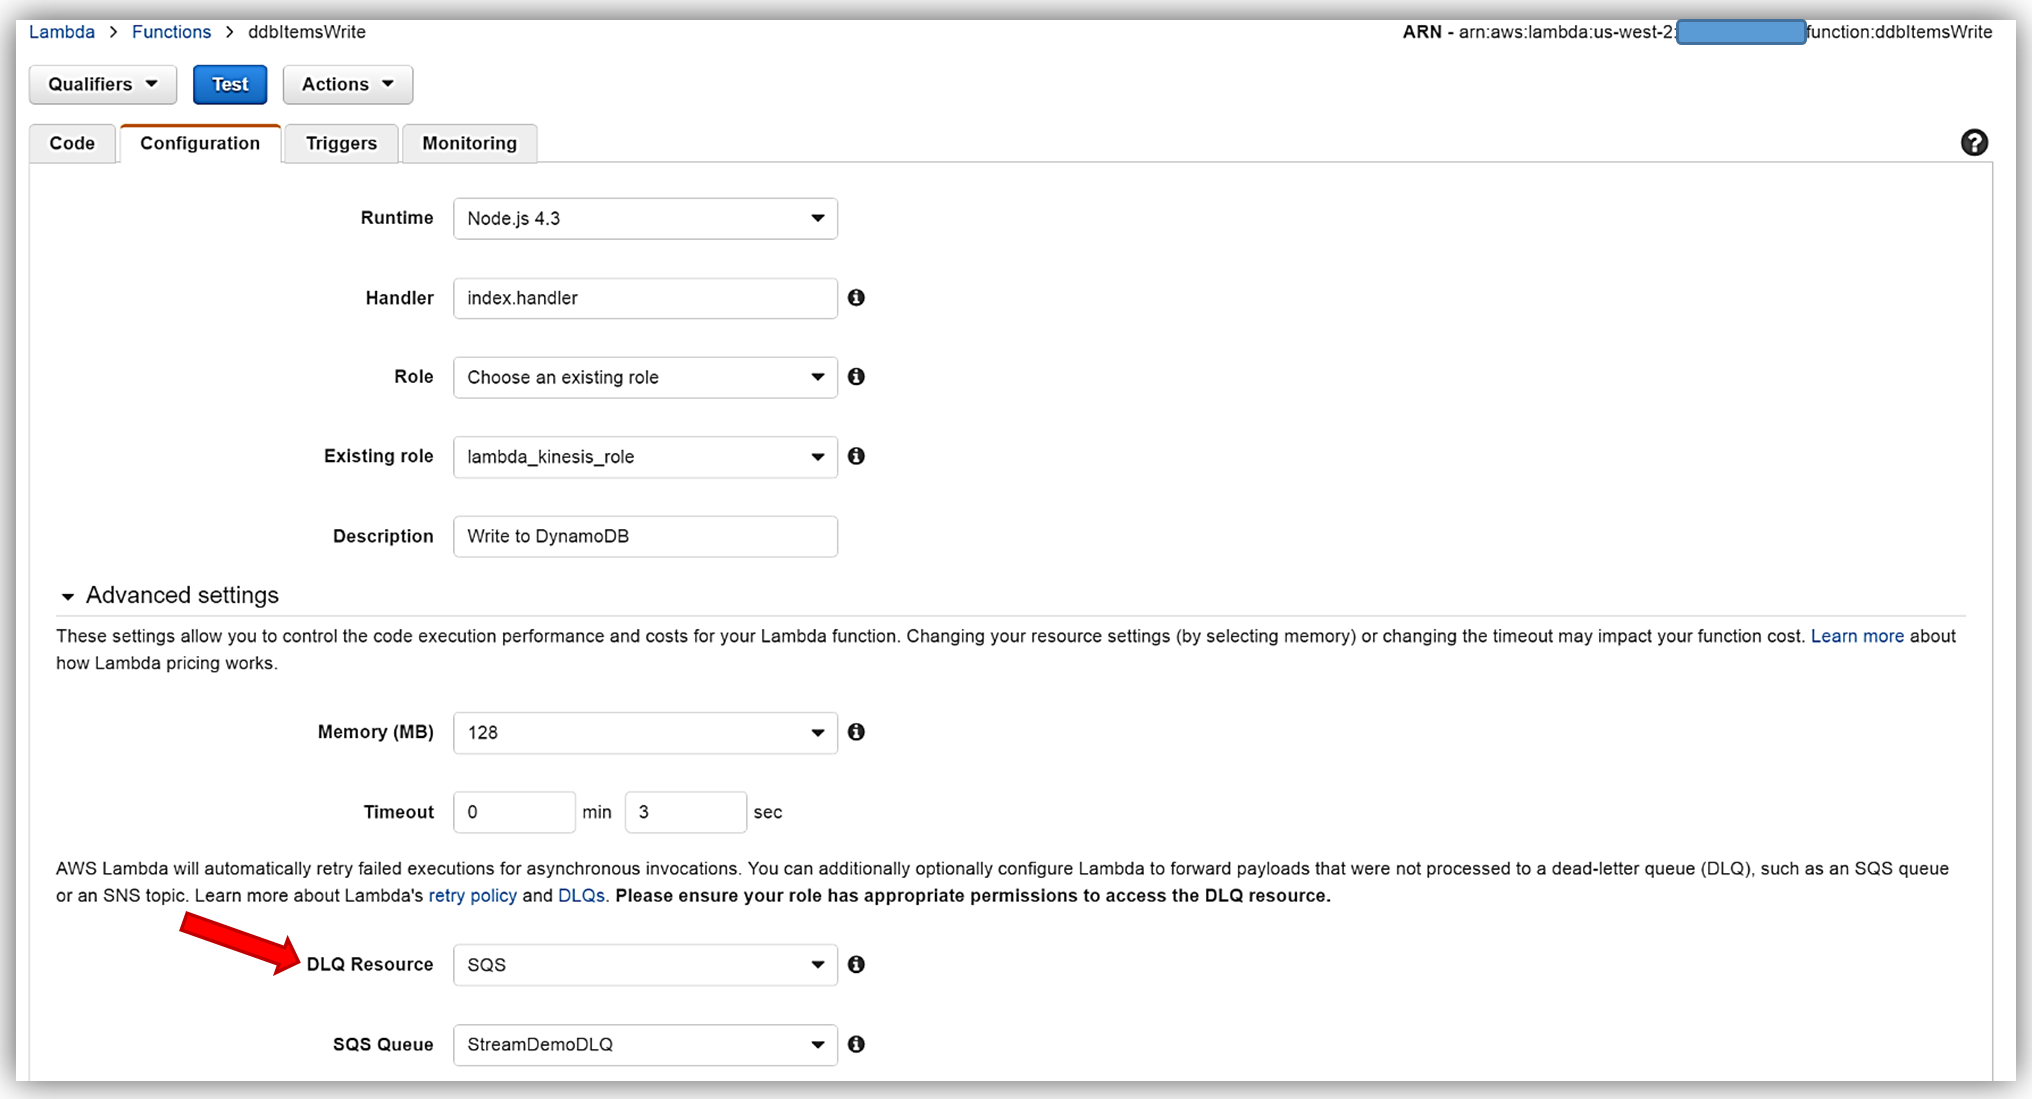
Remember, the execution role for the Lambda function must explicitly provide sqs:SendMessage access permissions to in order to successfully send messages to your SQS DLQ. Therefore, I ensured that my Lambda role, lambda_kinesis_role, has the following IAM policy for SQS permissions.
We have now successfully configured a Dead Letter Queue for our Lambda function using Amazon SQS. To learn more about Dead Letter Queues in Lambda, read the Troubleshooting and Monitoring section of the AWS Lambda Developer Guide and check out the AWS Compute Blog post on Dead Letter Queues.
C# Support
As I mentioned earlier, another very exciting feature added to Lambda during AWS re:Invent was the support for the C# language via the open source .NET Core 1.0 platform. Since the Lambda console does not offer editing for compiled languages yet, in order to author a C# Lambda function you can use tooling in Visual Studio with the AWS Toolkit, Yeoman, and/or the .NET CLI. To deploy Lambda functions written in C#, you can use the Lambda plugin in the AWS ToolKit for Visual Studio or create a deployment package with the .NET Core command line.
A C# Lambda function handler should be defined as an instance or static method in a class. There are two handler function parameters; the first is the input type which is the event data and second is the Lambda context object of type ILambdaContext. The event data input object types for AWS Services include the following:
- Amazon.Lambda.APIGatewayEvents
- Amazon.Lambda.CognitoEvents
- Amazon.Lambda.ConfigEvents
- Amazon.Lambda.DynamoDBEvents
- Amazon.Lambda.KinesisEvents
- Amazon.Lambda.S3Events
- Amazon.Lambda.SNSEvents
Now that we have discussed more detail around C# Support in Lambda, let’s rewrite our DevDayStreamProcessor lambda function with the C# language. For this example, I will use Visual Studio IDE to write the Lambda function, and additionally take advantage of the AWS Lambda Visual Studio plugin to deploy the function. Remember in order to use the AWS Toolkit for Visual Studio with Lambda, you will need to have Visual Studio 2015 Update 3 version and NET Core tools. You can read more about installing Visual Studio 2015 Update 3 and .NET Core here.
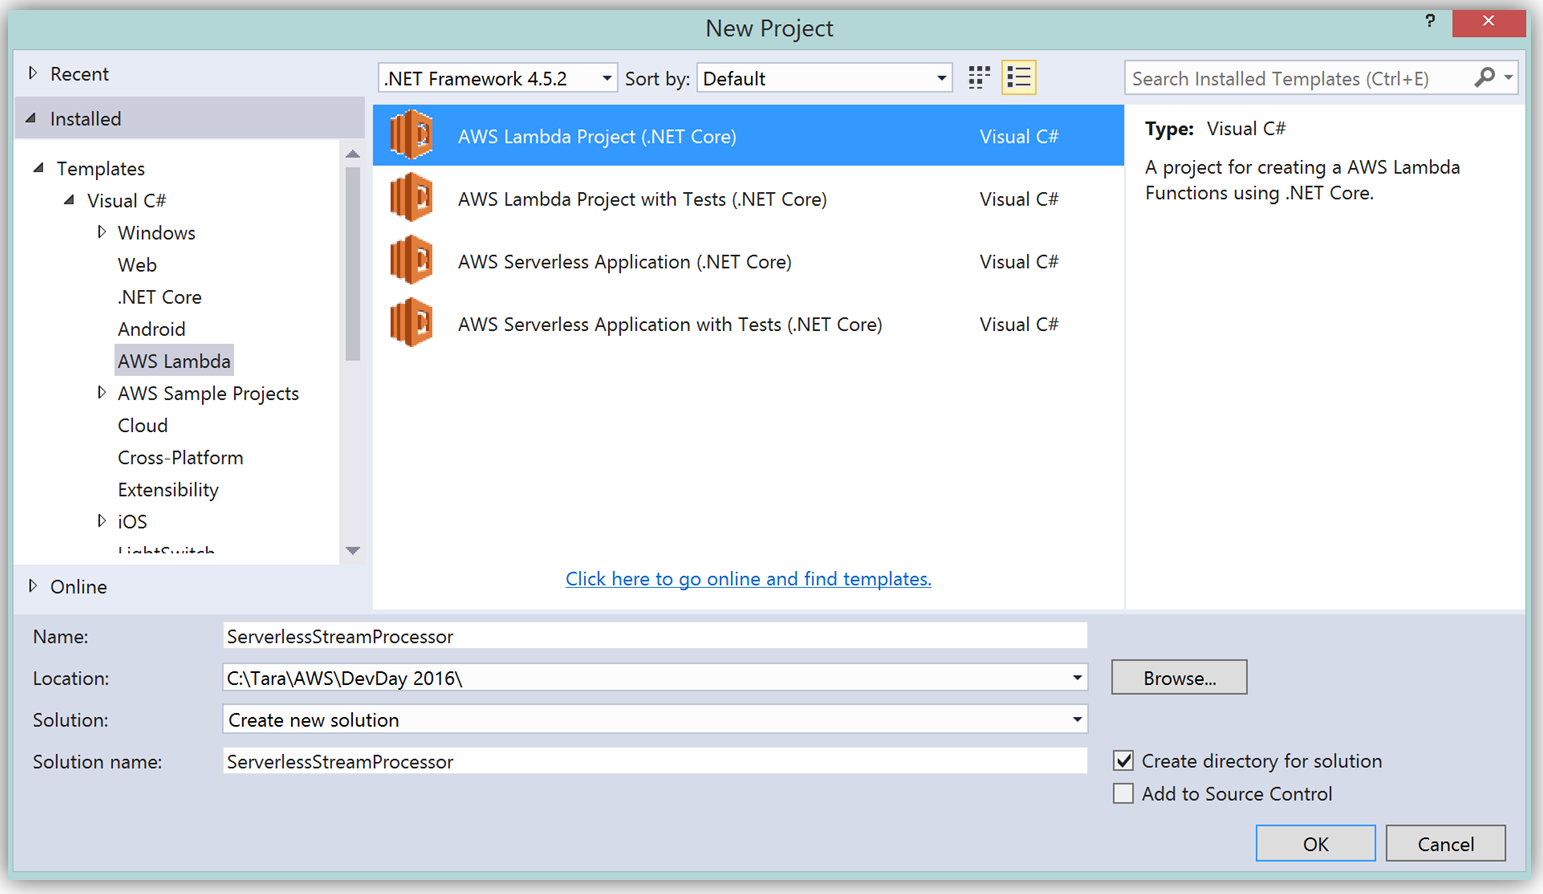
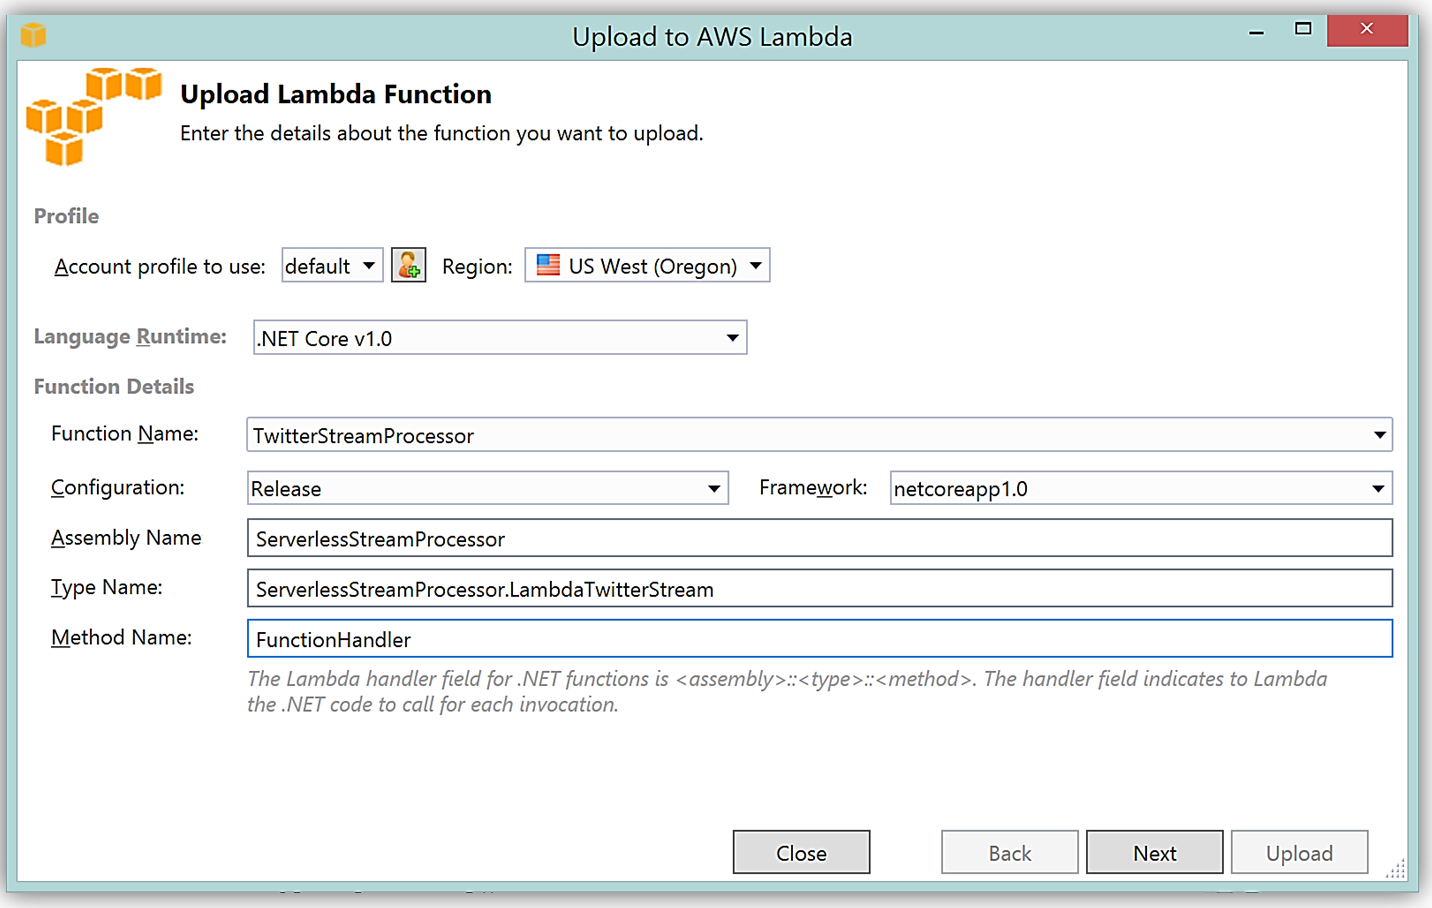
To create the C# function using Visual Studio, I start a New Project, select AWS Lambda Project (.NET Core) and name it ServerlessStreamProcessor.
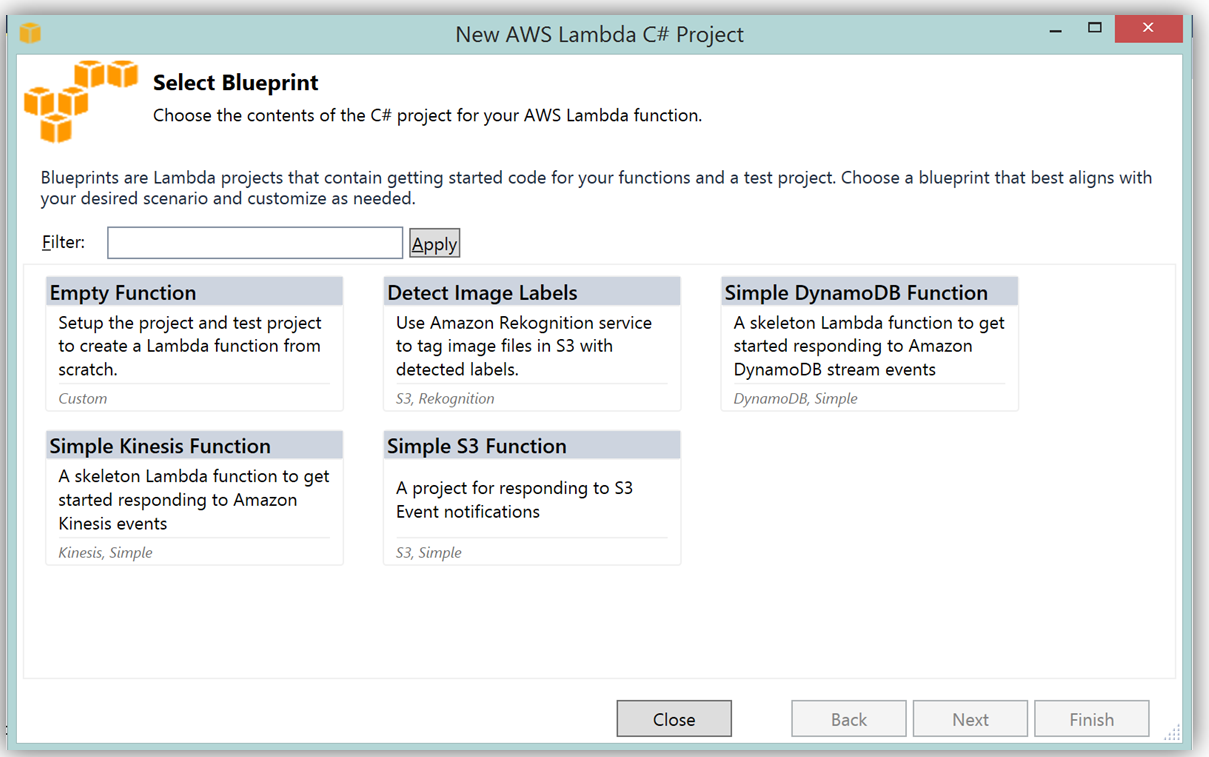
What’s really cool about taking advantage of the AWS Toolkit for Visual Studio to author this function, is that inside of Visual Studio I can use Lambda blueprints to get started in a similar way that I would in using the Lambda console. Therefore in order to replicate the DevDayStreamProcessor in C#, I will select the Simple Kinesis Function blueprint.
It should be noted that when writing Lambda functions in C#, there is no need to mark the class declaration nor the target handler function as a Lambda function. Additionally, when writing CloudWatch logs you can use the standard C# Console class WriteLine function or use the ILambdaContext LogLine function found as a part of the ILambdaContext interface. With the template for accessing the Kinesis stream in place, I finish writing the C# Lambda function, ServerlessStreamProcessor, utilizing the same variable names as in the Node.js code in DevDayStreamProcessor. Please note the C# Lambda handler function below.
using System.Collections.Generic;
using Amazon.Lambda.Core;
using Amazon.Lambda.KinesisEvents;
using Amazon.DynamoDBv2;
using Amazon.DynamoDBv2.DataModel;
using Newtonsoft.Json.Linq;

// Assembly attribute to enable the Lambda function's JSON input to be converted into a .NET class.
[assembly: LambdaSerializerAttribute(typeof(Amazon.Lambda.Serialization.Json.JsonSerializer))]

namespace ServerlessStreamProcessor
{
    public class LambdaTwitterStream
    {
        string twitterID, timeStamp;
        int itemNum = 0;

        private static AmazonDynamoDBClient dynamoDBClient = new AmazonDynamoDBClient();
        List<TwitterItem> dataItemsBatch = new List<TwitterItem>();

        public void FunctionHandler(KinesisEvent kinesisEvent, ILambdaContext context)
        {
            DynamoDBContext dbContext = new DynamoDBContext(dynamoDBClient);
            context.Logger.LogLine($"Beginning to process {kinesisEvent.Records.Count} records...");

            foreach (var record in kinesisEvent.Records)
            {
                context.Logger.LogLine($"Event ID: {record.EventId}");
                context.Logger.LogLine($"Event Name: {record.EventName}");

                // Kinesis data is base64 encoded so decode here
                string tweetData = GetRecordContents(record.Kinesis);
                context.Logger.LogLine($"Decoded Payload: {tweetData}");
                tweetData = @"" + tweetData;
                JObject twitterObj = JObject.Parse(tweetData);

                twitterID = twitterObj["id"].ToString();
                timeStamp = DateTime.Now.Millisecond.ToString();
                itemNum++;
                context.Logger.LogLine(timeStamp);
                context.Logger.LogLine($"Twitter ID is: {twitterID}");
                context.Logger.LogLine(itemNum.ToString());

                TwitterItem ddbItem = new TwitterItem()
                {
                    TwitterID = twitterID,
                    TwitterUser = twitterObj["username"].ToString(),
                    TwitterUserPic = twitterObj["pic"].ToString(),
                    TwitterTime = DateTime.Parse(twitterObj["time"].ToString()).ToUniversalTime().ToString(),
                    Tweet = twitterObj["text"].ToString(),
                    TweetTopic = twitterObj["topic"].ToString(),
                    Tags = twitterObj["hashtags"] != null ? twitterObj["hashtags"].ToString() : String.Empty,
                    Location = twitterObj["loc"] != null ? twitterObj["loc"].ToString() : String.Empty,
                    Country = twitterObj["country"] != null ? twitterObj["country"].ToString() : String.Empty,
                    TimeStamp =  timeStamp,
                    RecordNum = itemNum
                };

                dataItemsBatch.Add(ddbItem);
            }

            context.Logger.LogLine(JObject.FromObject(dataItemsBatch).ToString());
            ddbItemsWrite(dataItemsBatch, 0, dbContext, context);
            context.Logger.LogLine("Success - Completed Successfully");
            context.Logger.LogLine("Stream processing complete.");
        }
There are only a few differences that should be noted between our Kinesis stream processor written in C# and our original Node.js code. Since the input parameter type supported by default in C# Lambda functions is the System.IO.Stream type, the Kinesis base64 string is decoded by using a StreamReader with ASCII encoding in a blueprint provided function, GetRecordContents.
private string GetRecordContents(KinesisEvent.Record streamRecord)
{
    using (var reader = new StreamReader(streamRecord.Data, Encoding.ASCII))
    {
        return reader.ReadToEnd();
    }
}
The other thing to note is that in order to write the tweet data to the DynamoDB Table, I added the AWS .NET SDK NuGet package for DynamoDB; AWSSDK.DynamoDBv2 to the Lambda function project via the NuGet package manager within Visual Studio. I also created a .NET data object, TwitterItem, to map to the data being stored in the DynamoDB table. Using the AWS .NET SDK higher level programming interface, object persistence model for DynamoDB, I created a collection of TwitterItem objects to be written via the BatchWrite object class in our ddbItemsWrite C# function.
private async void ddbItemsWrite(List<TwitterItem> items, int retries, DynamoDBContext ddbContext, ILambdaContext context)
{
BatchWrite<TwitterItem> twitterStreamBatchWrite = ddbContext.CreateBatchWrite<TwitterItem>();

        try
        {
            twitterStreamBatchWrite.AddPutItems(items);
            await twitterStreamBatchWrite.ExecuteAsync();
        }
        catch (Exception ex)
        {
            context.Logger.LogLine($"DDB call failed: {ex.Source} ");
            context.Logger.LogLine($"Exception: {ex.Message}");
            context.Logger.LogLine($"Exception Stacktrace: {ex.StackTrace}");
        }
}
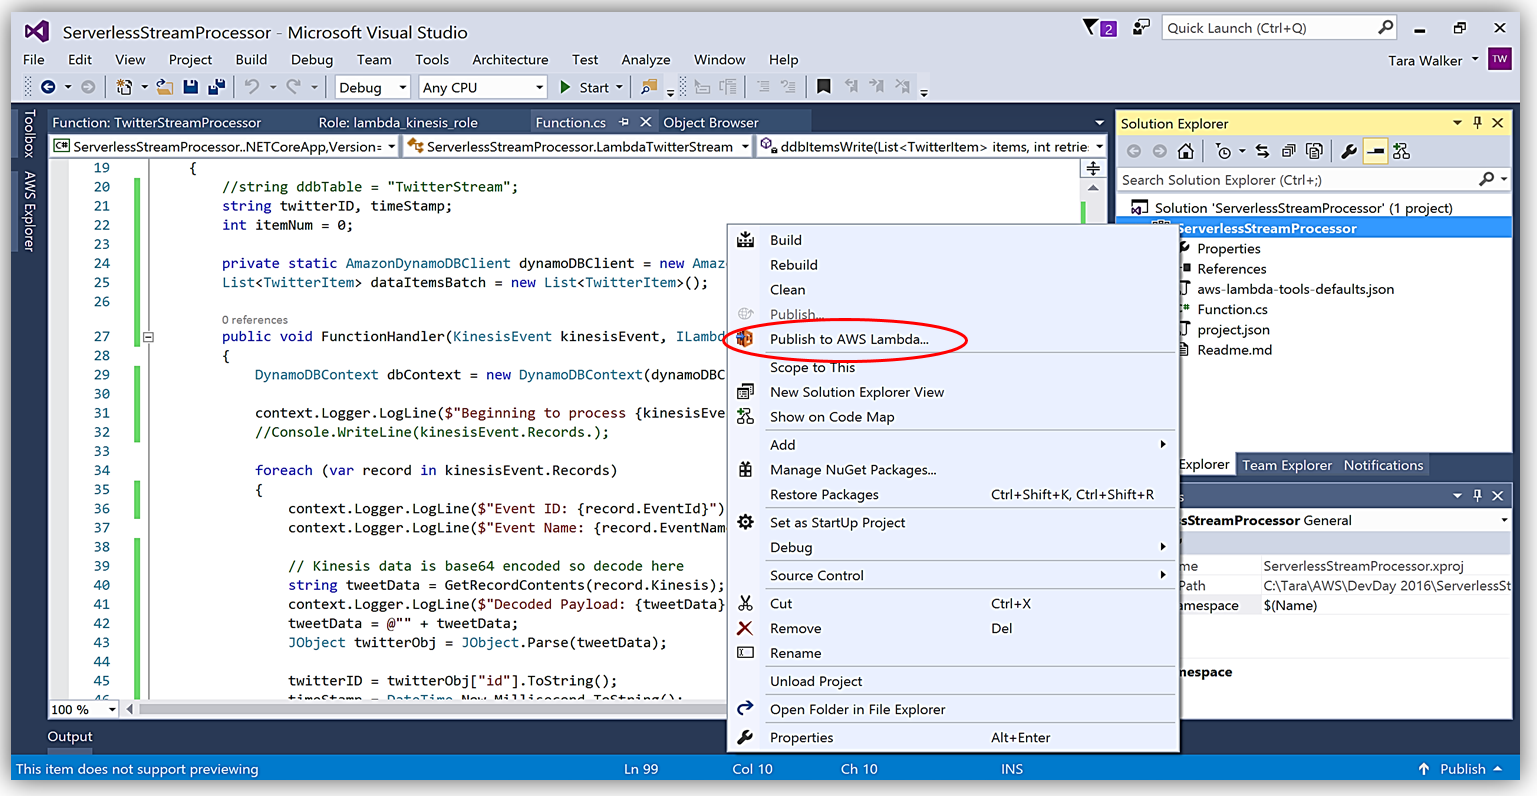
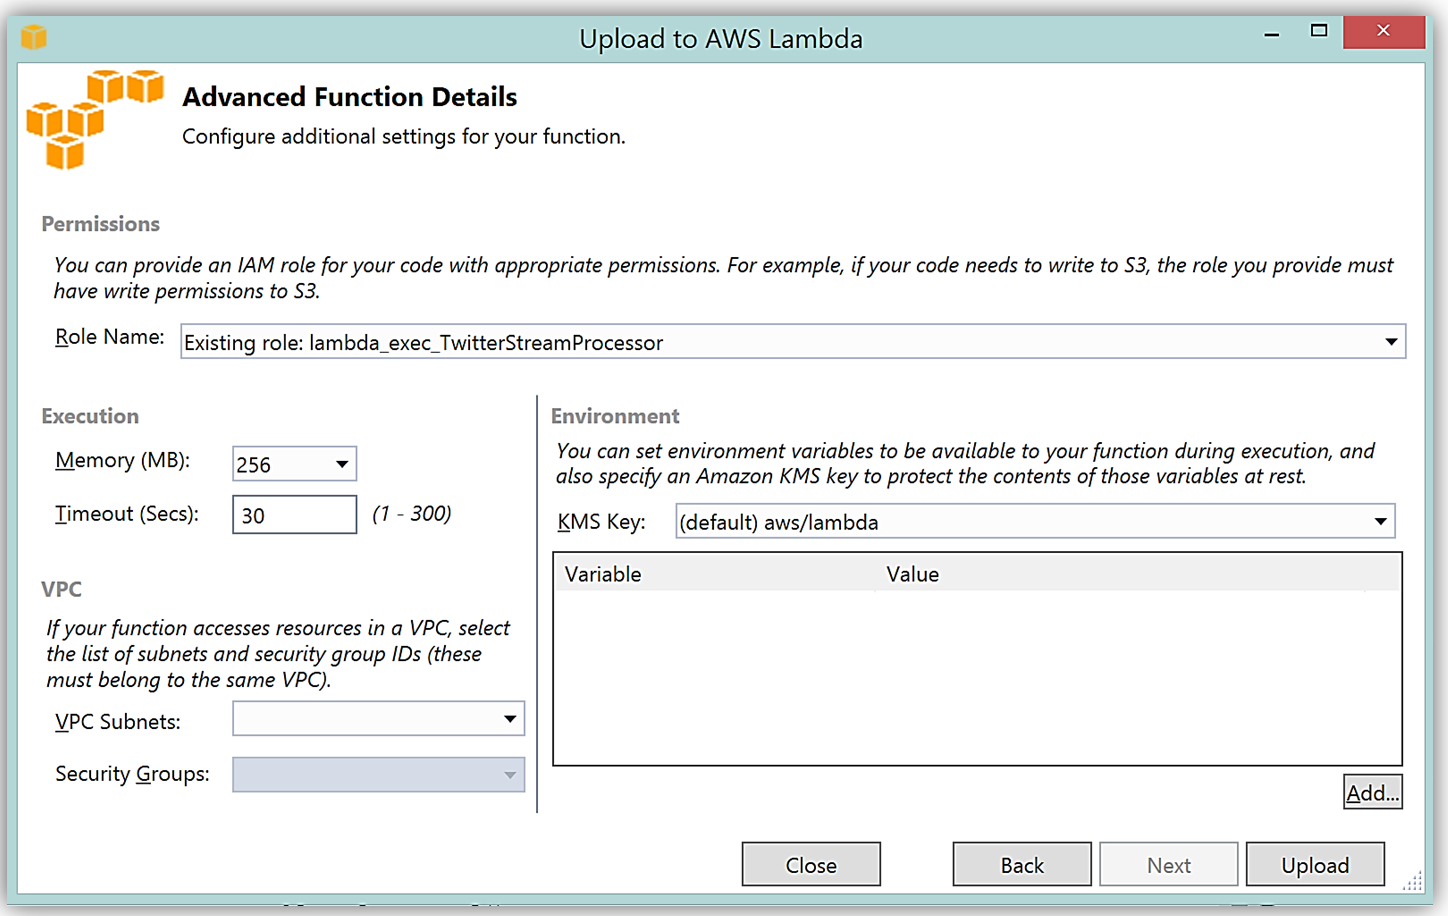
Another benefit of using AWS Toolkit for Visual Studio to author my C# Lambda function is that I can deploy my Lambda function directly to AWS with a single click. Selecting my project name in the Solution Explorer and performing a right-click, I get a menu option, Publish to AWS Lambda, which brings up a menu for information to include about my Lambda function for deployment to AWS.
It is important to note that the handler function signature follows the nomenclature of Assembly :: Namespace :: ClassName :: Method, therefore, the signature of our C# Lambda function shown here is: ServerlessStreamProcessor :: ServerlessStreamProcessor.LambdaTwitterStream :: FunctionHandler. We provide this information to the Upload to AWS Lambda dialog box and select Next to assign a role for the function.
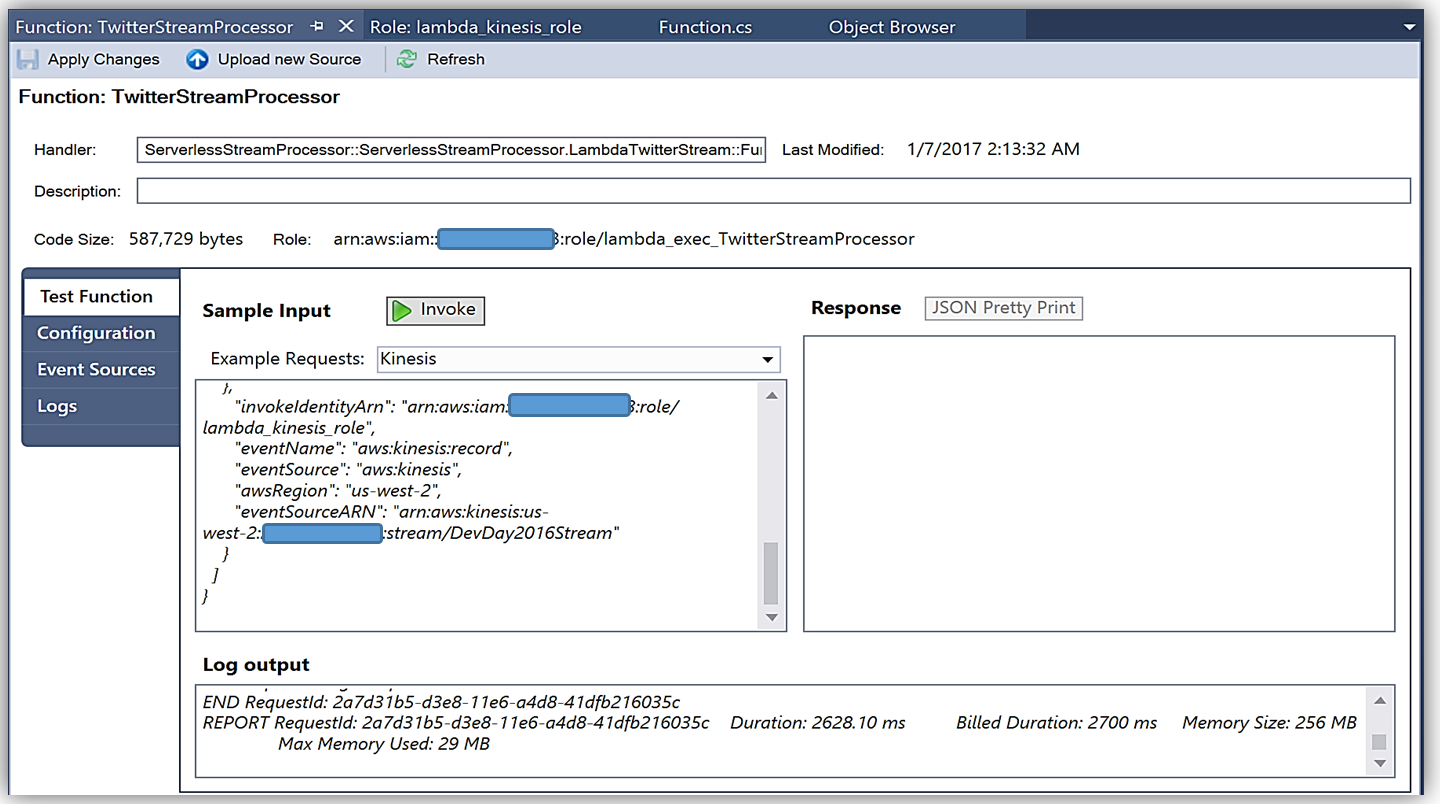
Upon completion, you can test in the Lambda console or in Visual Studio with AWS toolkit provided plugin (shown below) using the sample data of the triggering event source for an iterative approach to developing the Lambda function.
You can learn more about authoring AWS Lambda functions using the C# Language in the AWS Lambda developer guide or by reading the post announcing C# Support on the Compute Blog.
API Gateway Monetization and Developer Portal
If you have been following the microservices momentum, you may be aware of an architectural pattern that calls for using smart endpoints and/or using an API gateway via REST APIs to manage access and exposure of individual services that make up a microservices solution. Amazon API Gateway enables creation and management of RESTful APIs to expose AWS Lambda functions, external HTTP endpoints, as well as, other AWS services. In addition, Amazon API Gateway allows clients and external developers to have access to a deployed APIs by via HTTP protocol or a platform/language targeted SDK.
With the introduction of SaaS Subscriptions on AWS Marketplace and the API Gateway integration with the AWS Marketplace, you can now monetize your APIs by allowing customers to directly consume the APIs you create with API Gateway in the AWS Marketplace. AWS customers can subscribe and be billed for the APIs published on the marketplace with their existing AWS account. With the integration of API Gateway with the AWS Marketplace, the process to get started is easy on the AWS Marketplace.
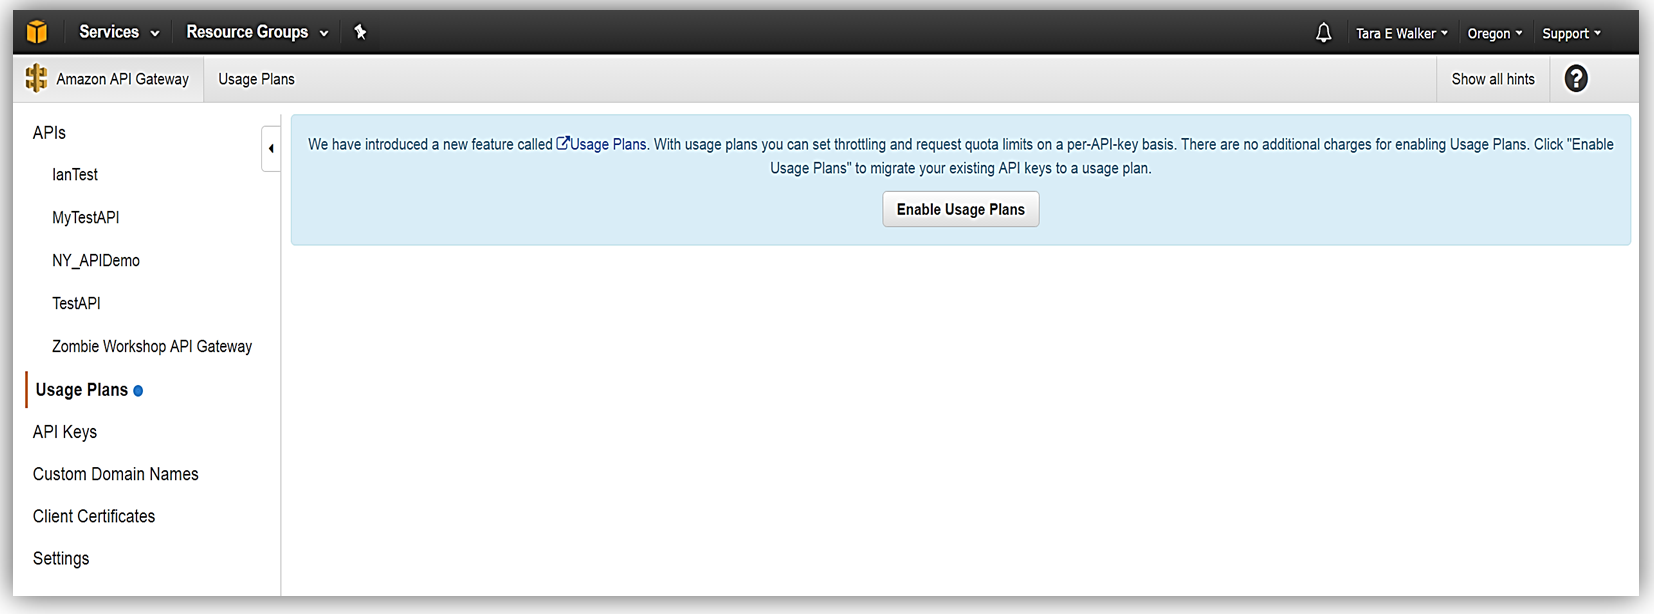
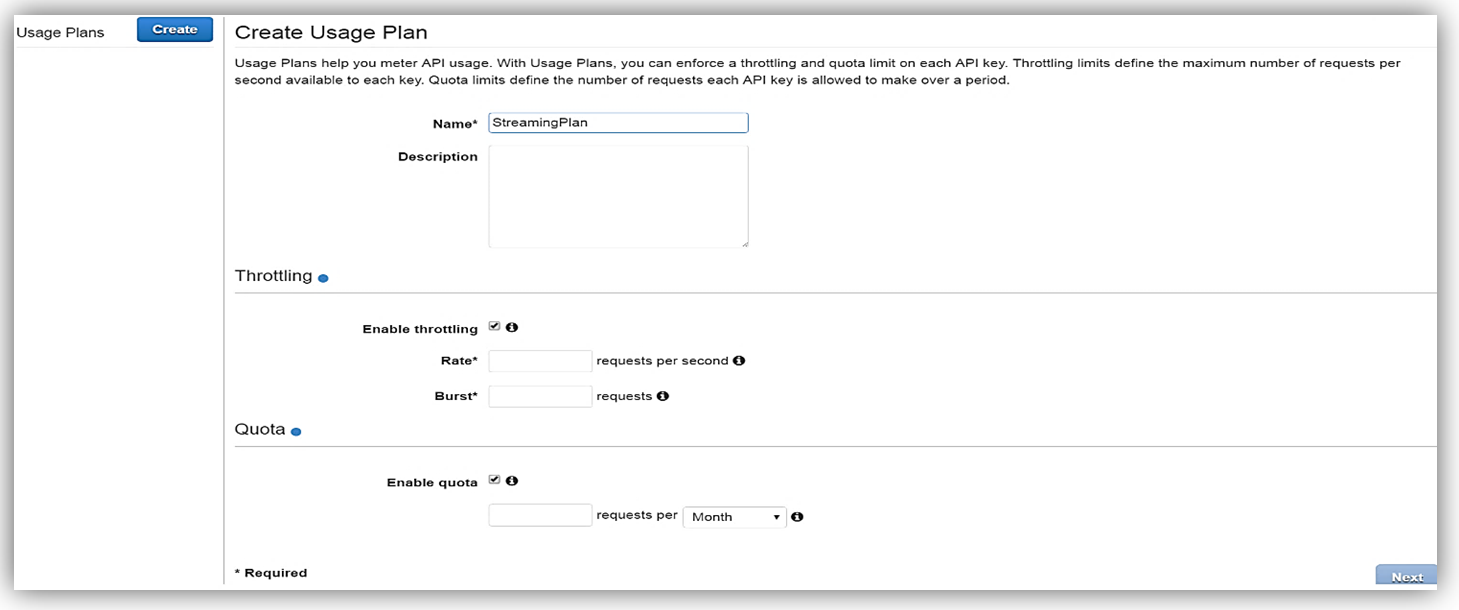
To get started, you must ensure that you have enabled the Usage Plan feature in Amazon API Gateway.
Once enabled the next step is to create a Usage Plan, enable throttling (if desired) with targeted rate and burst request thresholds, and finally enable quotas (if you choose) by providing targeted request quota per a set timeframe.
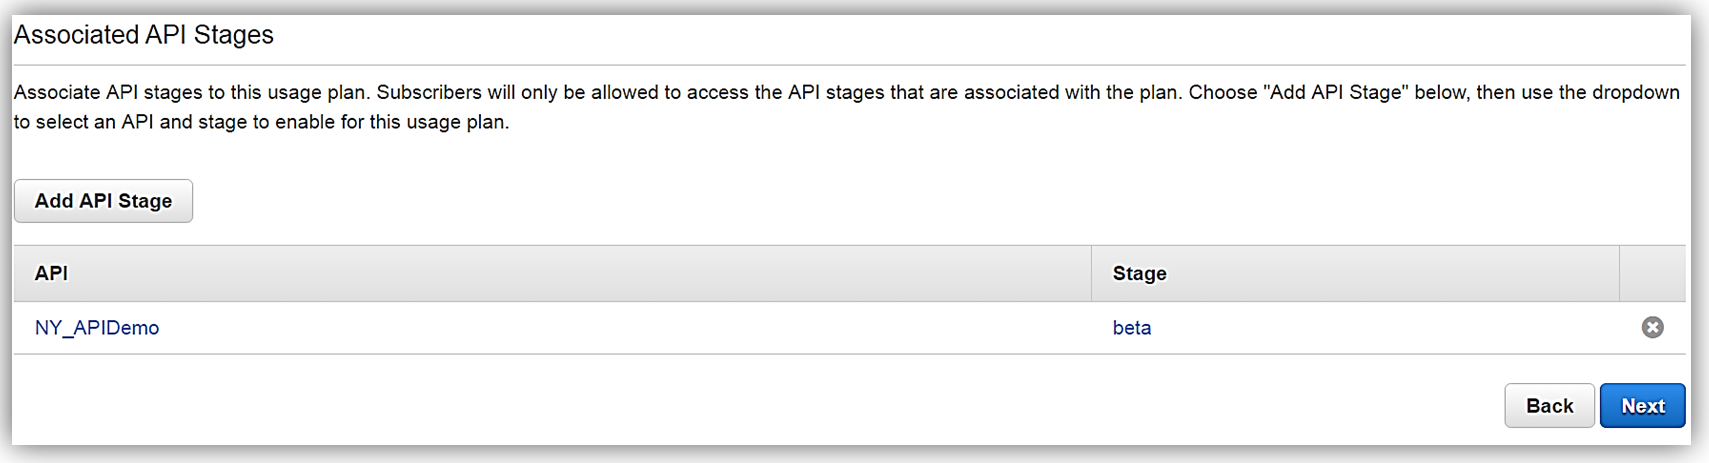
Next, we would choose our APIs and related stage(s) that we wish to be associated with the usage plan. Please note that this is an optional step as you can opt not associate a specific API with your usage plan.
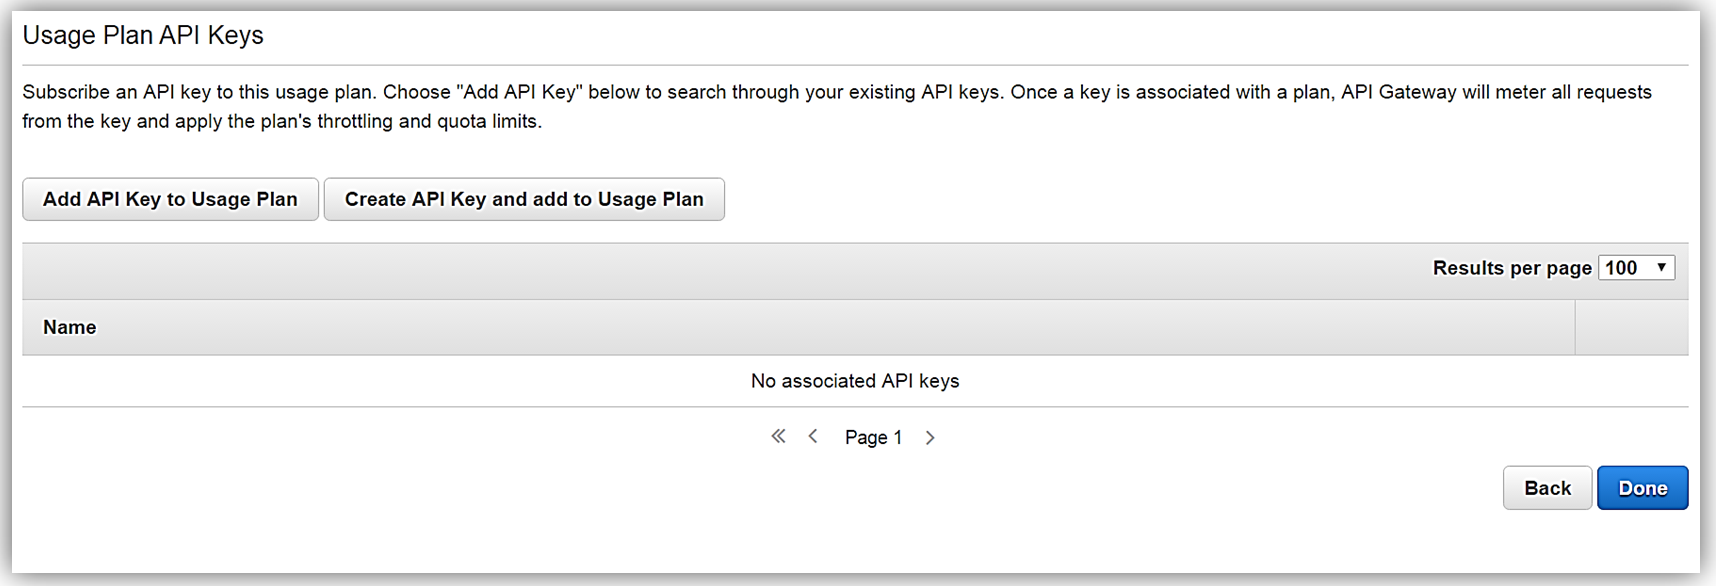
All that is left to do is add or create an API key for the usage plan. Again, it should be noted that this is also an optional step in creating your usage plan.
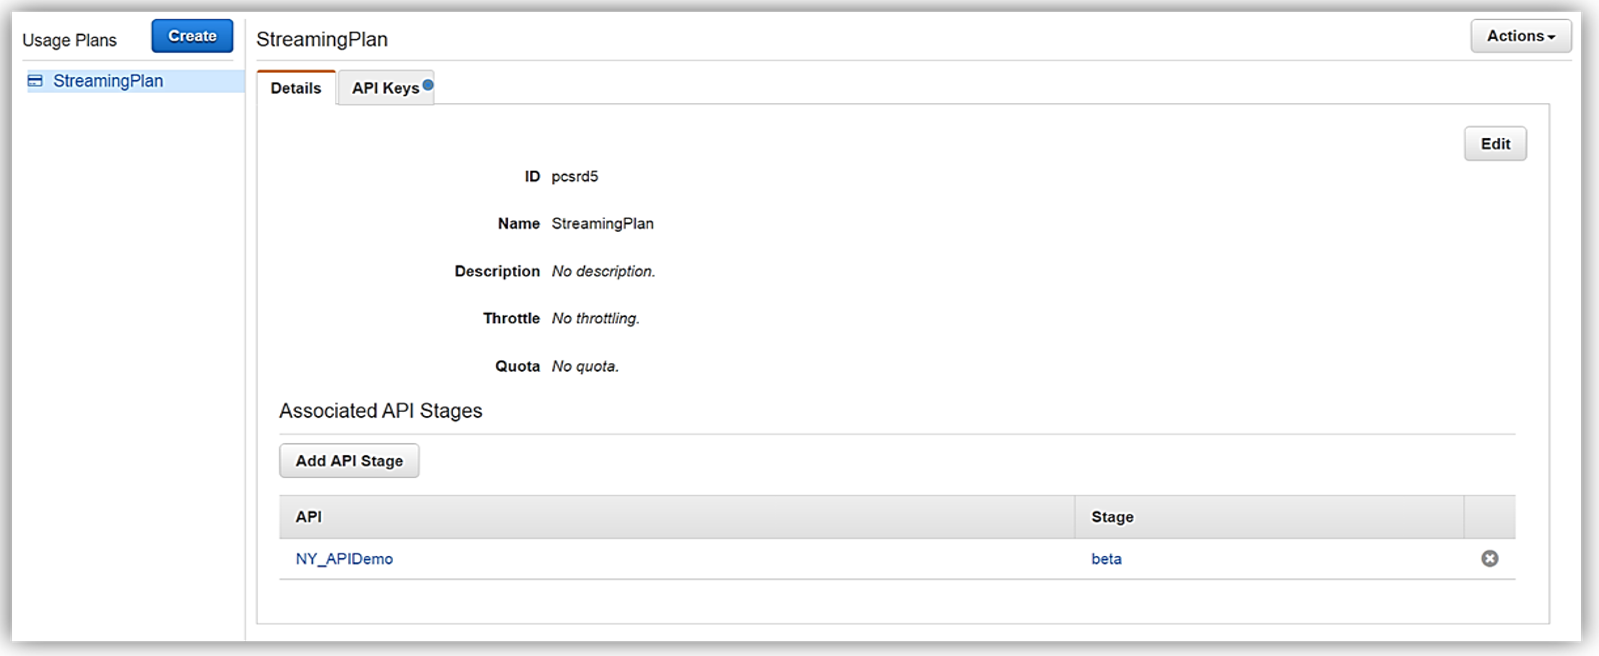
Now that we have our usage plan, StreamingPlan, we are ready for the next step in preparation for selling our API on the marketplace. You have the option to create multiple usage plans with varying APIs and limits, and sell these plans as differentiated API products on AWS Marketplace.
In order to enable customers to buy our new API product, however, the AWS Marketplace requires that each API product has an external developer portal to handle subscription requests, provide API information details and ability for the management of usage.
This customer need for an external developer portal for the marketplace birthed the new open source API Gateway developer portal serverless web application implementation. The goal of the API Gateway developer portal project was to allow customers to follow a few easy steps to create a serverless web application that lists a catalog of your APIs built with API Gateway while allowing for developer signups.
The API Gateway developer portal was built upon AWS Serverless Express; an open source library published by AWS which aids you in utilizing AWS Lambda and Amazon API Gateway in building web applications/services with the Node.js Express framework. Additionally, the API Gateway developer portal application uses an AWS SAM (Serverless Application Model) template to deploy its serverless resources. AWS SAM is a simplified CloudFormation template and specification that allows easier management and deployment of serverless applications on AWS.
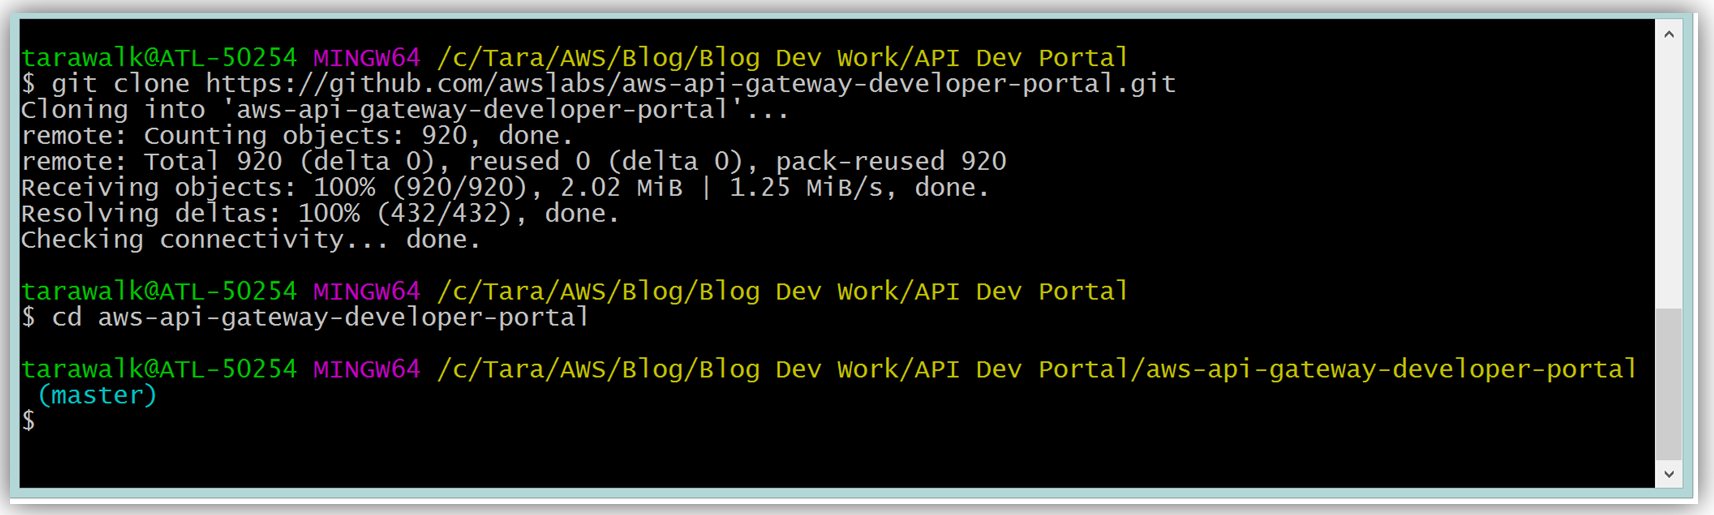
To build your developer portal using the API Gateway portal, you would start by cloning the aws-api-gateway-developer-portal project from GitHub.
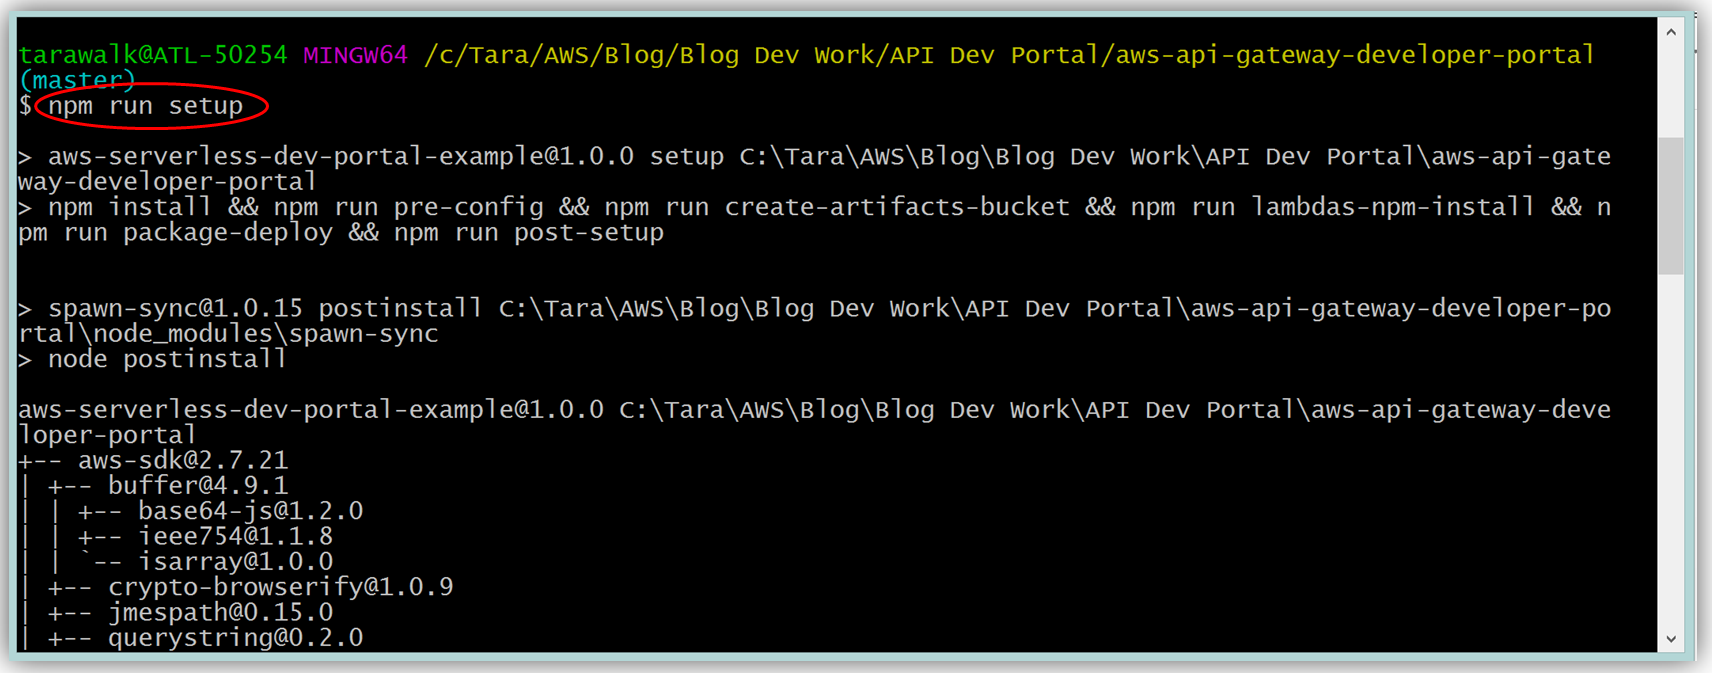
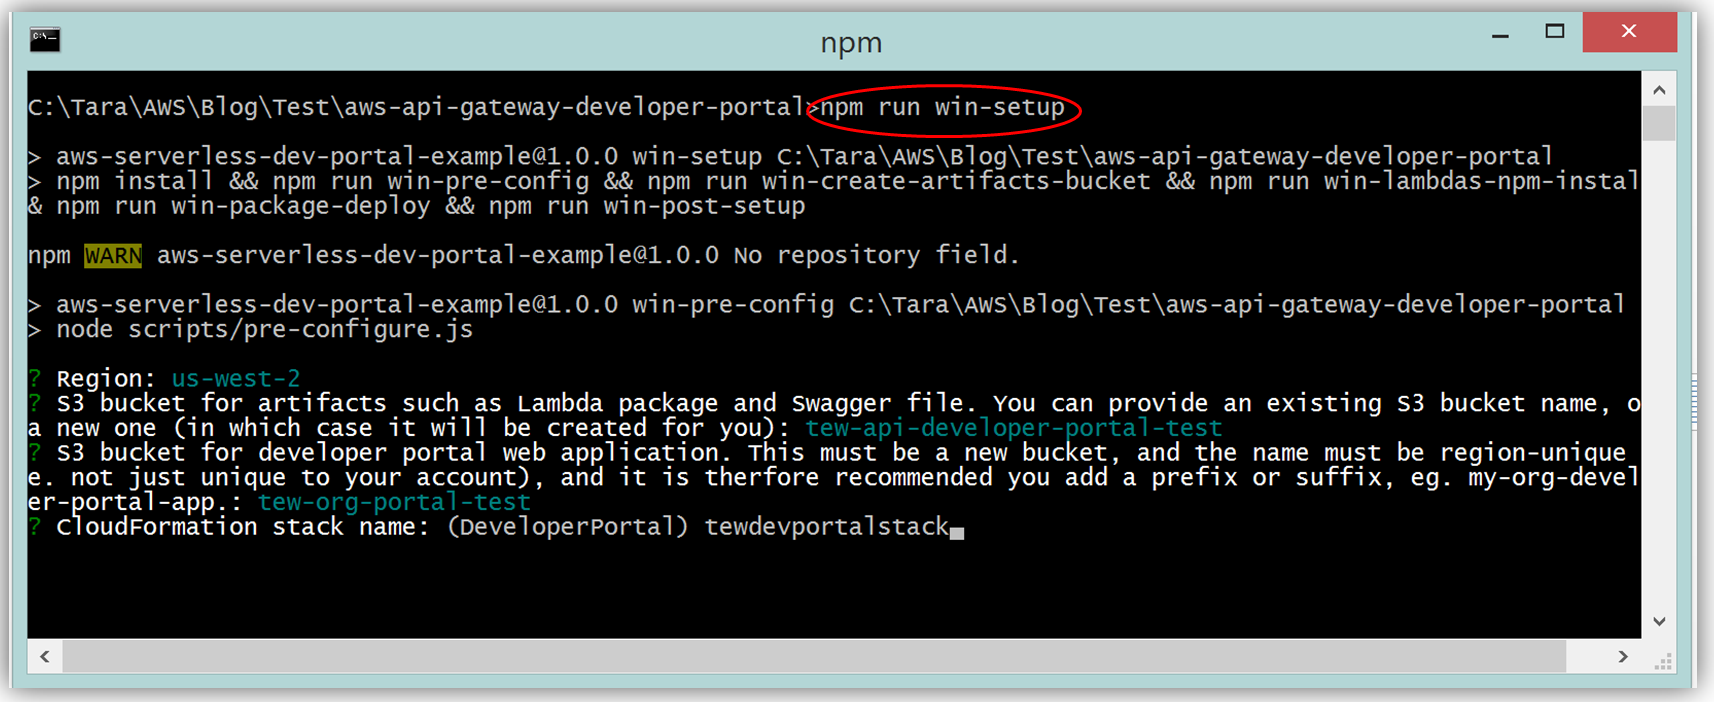
Assuming you have the latest version of the AWS CLI and Node.js installed, you would setup the developer portal by running “npm run setup” on the command line for Mac and Linux OS users. For Windows users, you would run “npm run win-setup” on the command line setup the developer portal.
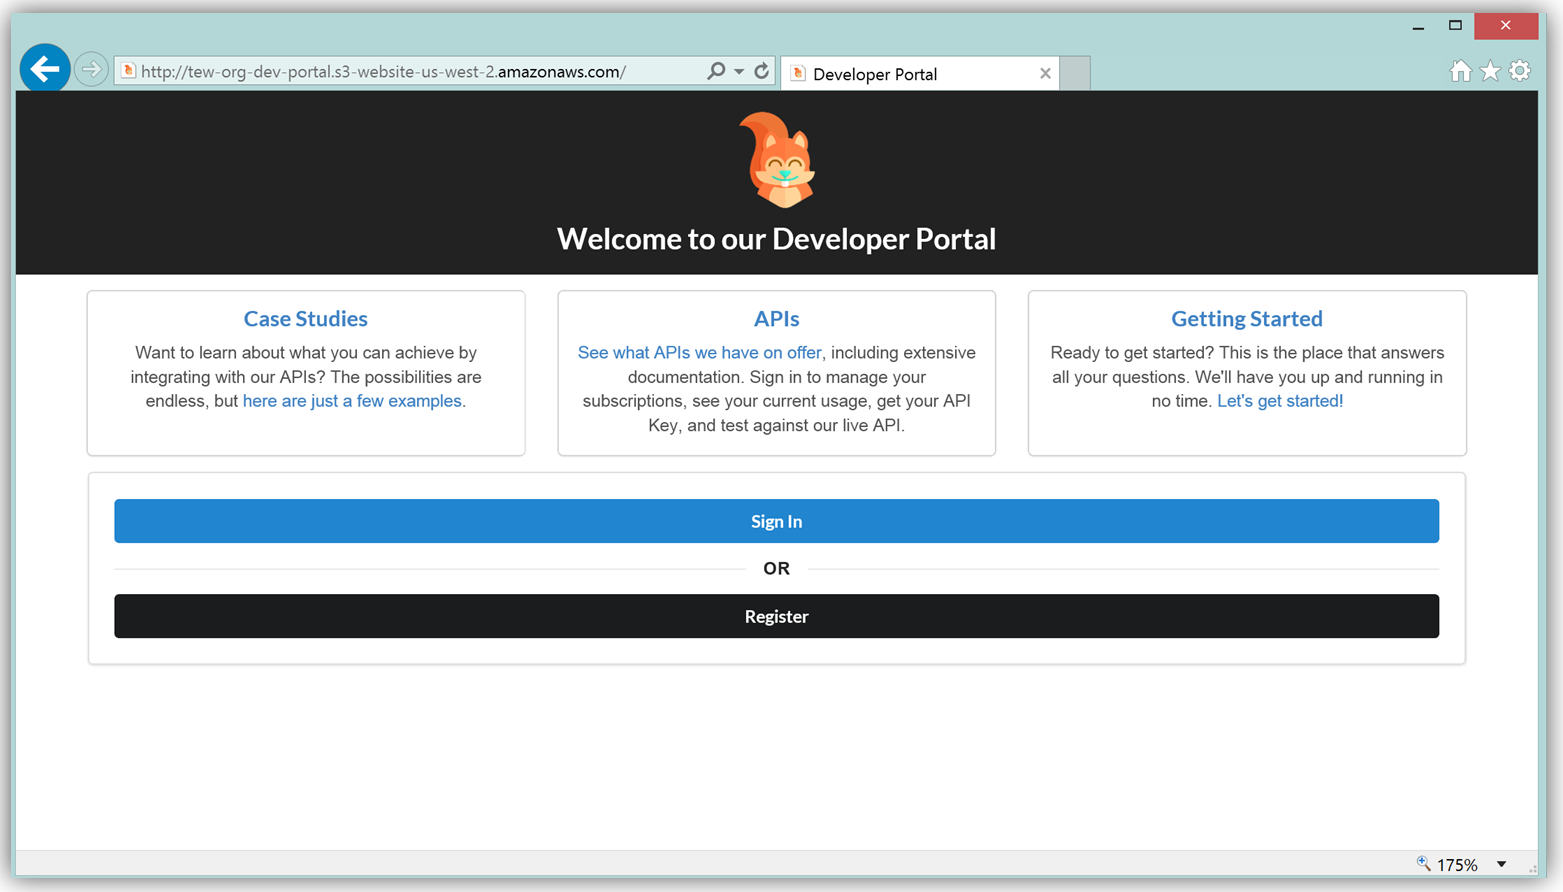
The result is a functional sample developer portal website running on S3 that you can customize in order to create your own developer portal for your APIs.
The frontend of the sample developer portal website is built with the React JavaScript library, and the backend is an AWS Lambda function running using the aws-serverless-express library. Additionally, a Lambda function with a SNS event source was created as a listener for notification when customers subscribe or unsubscribe to your API via the AWS Marketplace console. You can learn more about the steps to build, customize, and deploy your API Gateway developer portal web application with this reference project by visiting the AWS Compute blog post which discusses the architecture and implementation in more detail.
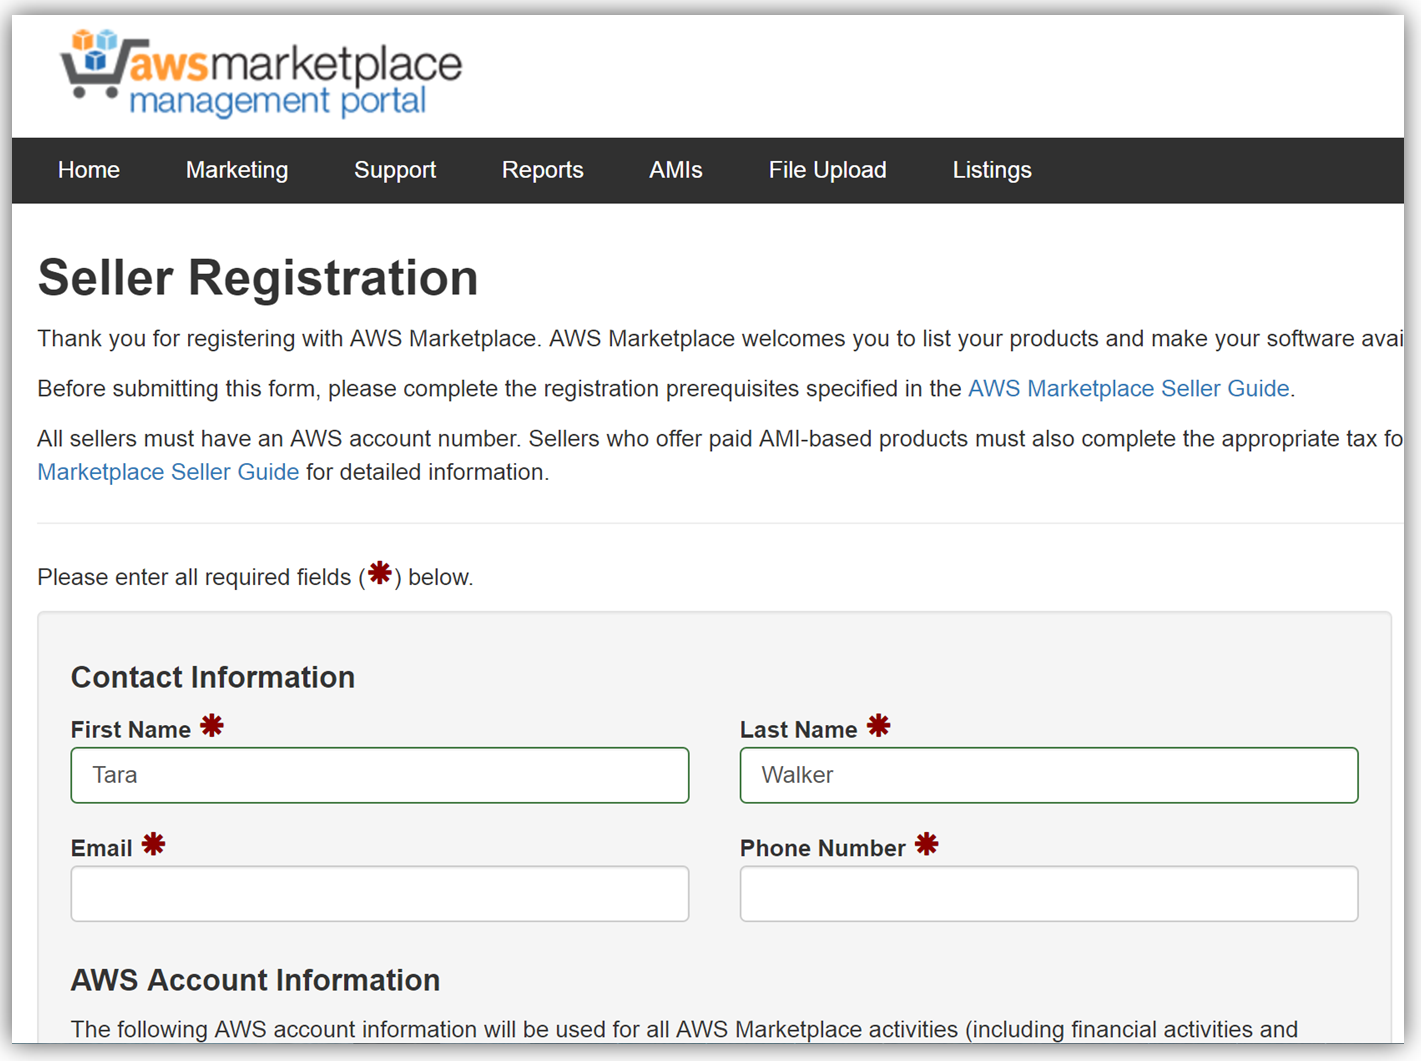
The next key step in monetizing our API is establishing an account on the AWS Marketplace. If an account is not already established, registering is simply verifying that you meet the requirement prerequisites provided in the AWS Marketplace Seller Guide and completing a seller registration form on the AWS Marketplace Management Portal. You can see a snapshot of the start of the seller registration form below.
To list the API, you would fill a product load form describing the API, establish the pricing for the API, and provide t\he IDs of AWS Accounts that will test the API subscription process. Completing this form would also require you to submit the URL for your API developer portal.
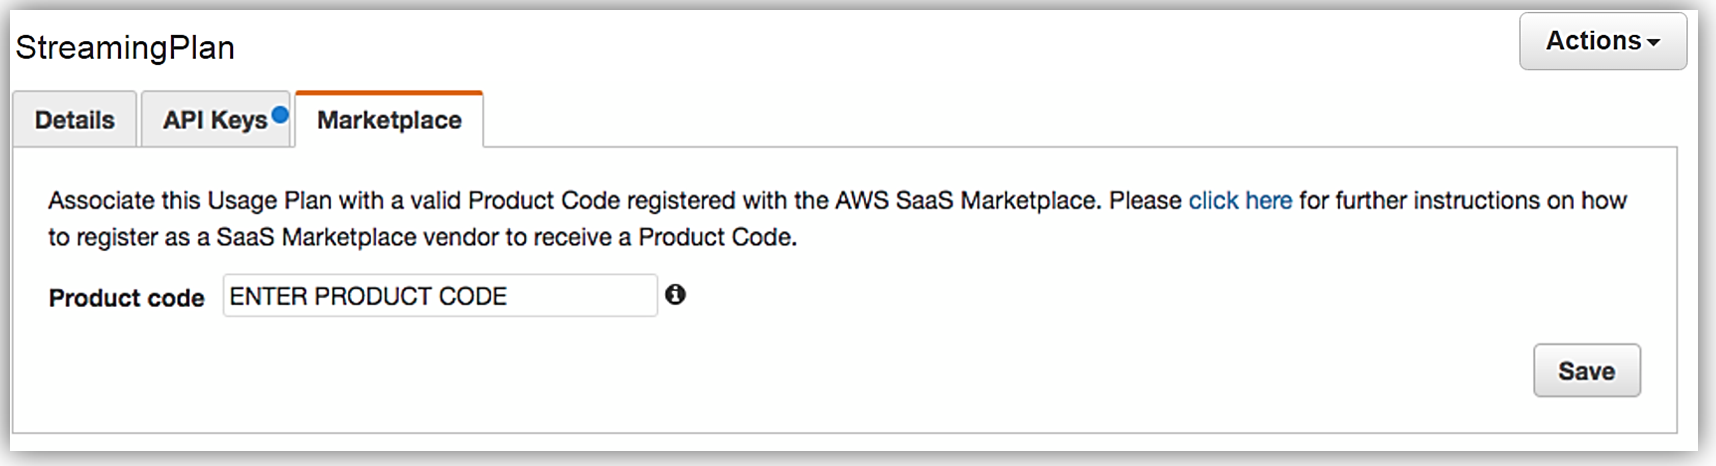
When your seller registration is complete, you will be supplied an AWS Marketplace product code. You will need to associate your marketplace product code with your API usage plan. In order to complete this step, you would simply log into the API Gateway console and go to your API usage plan. Go to the Marketplace tab and enter your product code. This tells API Gateway to send measurement data to AWS Marketplace when your API is used.
With your Amazon API Gateway managed API packaged into a usage plan, the accompanying API developer portal created, seller account registration completed, and product code associated with API usage plan; we are now ready to monetize our API on the AWS Marketplace.
Learn more about monetizing your APIs created with API Gateway by checking out the related blog post and reviewing the API Gateway developer guide documentation.
Summary
As you can see, the AWS teams were busy in 2016 working to make the customer experience easier for creating and deploying serverless architectures, as well as, providing mechanisms for customers to generate and monetize their API Gateway managed APIs.
Visit the product documentation for AWS Lambda and Amazon API Gateway to learn more about these services and all the newly released features.
– Tara
New – AWS Step Functions – Build Distributed Applications Using Visual Workflows
We want to make it even easier for you to build complex, distributed applications by connecting multiple web and microservices. Whether you are implementing a complex business process or setting up a processing pipeline for photo uploads, we want you to focus on the code instead of on the coordination. We want you to be able to build reliable applications that are robust, scalable, and cost-effective, while you use the tools and libraries that you are already familiar with.
How does that sound?
Introducing AWS Step Functions
Today we are launching AWS Step Functions to allow you to do exactly what I described above. You can coordinate the components of your application as series of steps in a visual workflow. You create state machines in the Step Functions Console to specify and execute the steps of your application at scale.
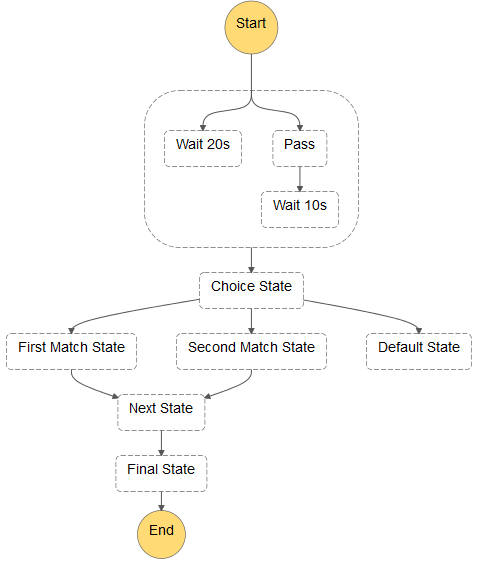
Each state machine defines a set of states and the transitions between them. States can be activated sequentially or in parallel; Step Functions will make sure that all parallel states run to completion before moving forward. States perform work, make decisions, and control progress through the state machine.
Here’s a state machine that includes a little bit of everything:
Multiple copies of each state machine can be running independently at the same time; each copy is called an execution. Step Functions will let you run thousands of execution concurrently so you can scale to any desired level.
There are two different ways to specify what you want to happen when a state is run. First, you can supply a Lambda function that will be synchronously invoked when the state runs. Second, you can supply the name of an Activity. This is a reference to a long-running worker function that polls (via the API) for work to be done. Either way, the code is supplied with a JSON statement as input, and is expected to return another JSON statement as output.
As part of your state machine, you can specify error handling behavior and retry logic. This allows you to build robust multi-step apps that will run smoothly even if transient issues in one part of your code cause a momentary failure.
Quick Tour
Let’s set up a state machine through the AWS Management Console. Keep in mind that production applications will most likely use the AWS Step Functions API (described below) to create and run state machines.
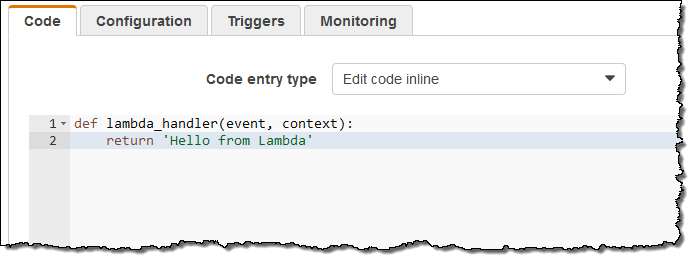
I start by creating and saving a simple Lambda function:
While I am there I also capture the function’s ARN:
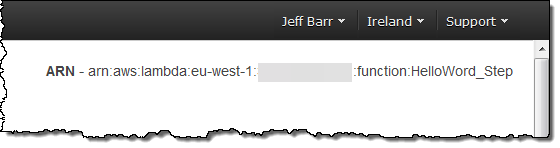
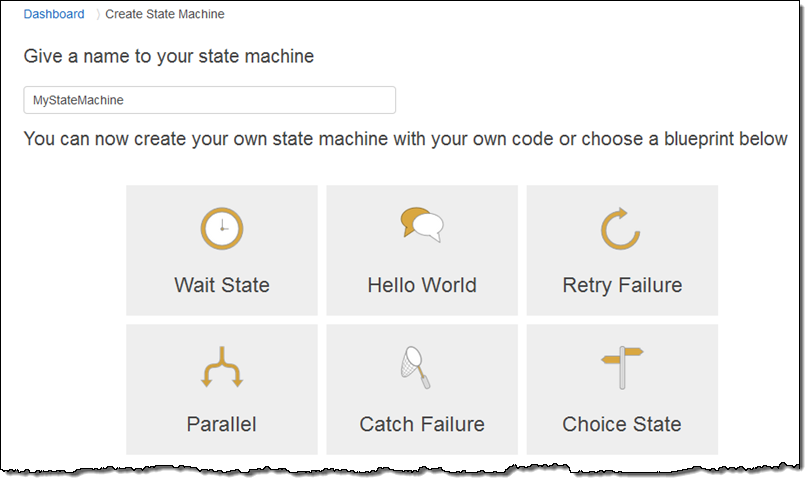
Then I go over to the AWS Step Functions Console and click on Create a State Machine. I enter a name (MyStateMachine), and I can click on one of the blueprints to get a running start:
I start with Hello World and use elements of Parallel to create this JSON model of my state machine (read the Amazon States Language spec to learn more):
{
"Comment": "A simple example of the Steps language using an AWS Lambda Function",
"StartAt": "Hello",
"States": {
"Hello": {
"Type": "Task",
"Resource": "arn:aws:lambda:eu-west-1:99999999999:function:HelloWord_Step",
"Next": "Parallel"
},
"Parallel": {
"Type": "Parallel",
"Next": "Goodbye",
"Branches": [
{
"StartAt": "p1",
"States": {
"p1": {
"Type": "Task",
"Resource": "arn:aws:lambda:eu-west-1:9999999999:function:HelloWord_Step",
"End": true
}
}
},
{
"StartAt": "p2",
"States": {
"p2": {
"Type": "Task",
"Resource": "arn:aws:lambda:eu-west-1:99999999999:function:HelloWord_Step",
"End": true
}
}
}
]
},
"Goodbye": {
"Type": "Task",
"Resource": "arn:aws:lambda:eu-west-1:99999999999:function:HelloWord_Step",
"End": true
}
}
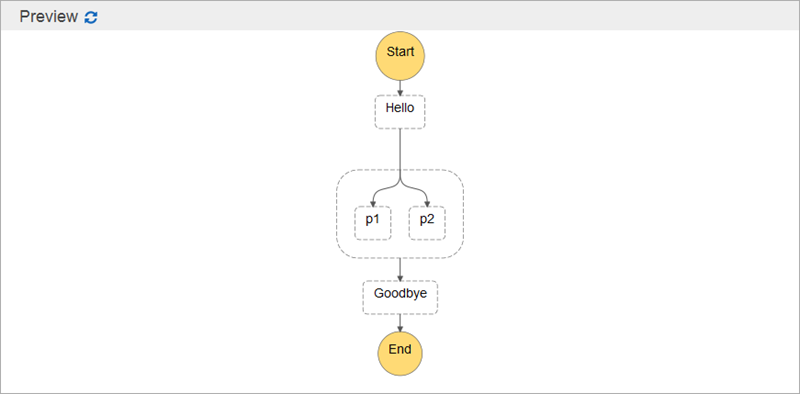
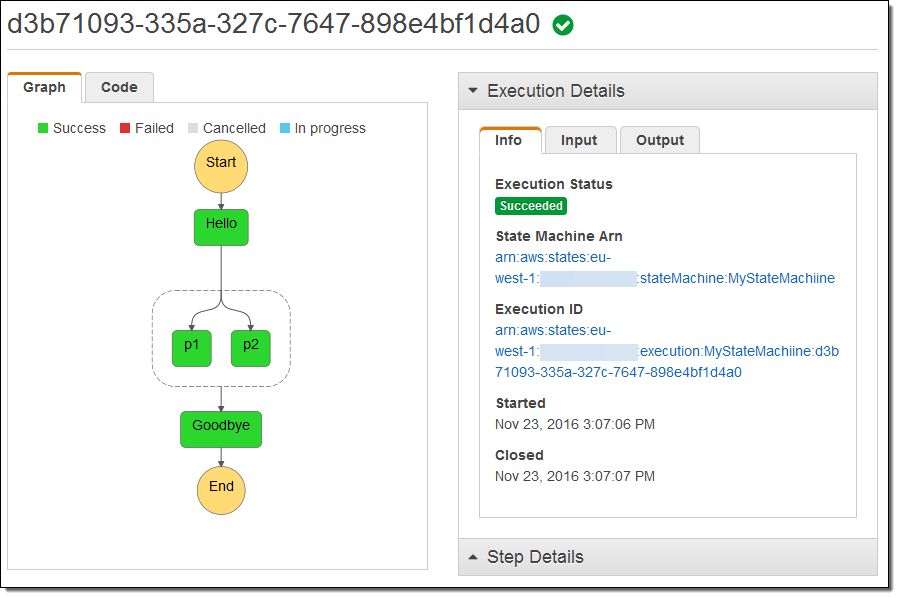
}I click on Preview to see it graphically:
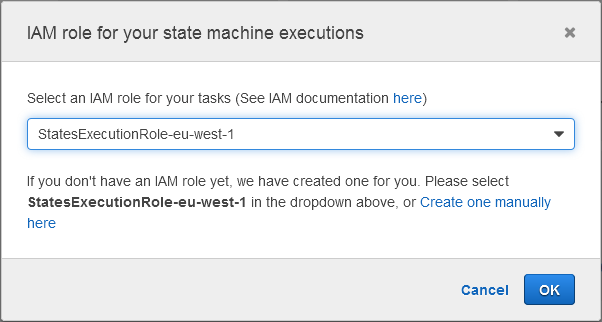
Then I select the IAM role that Step Functions thoughtfully created for me:
And I am all set! Now I can execute my state machine from the console; I can start it off with a block of JSON that is passed to the first function:
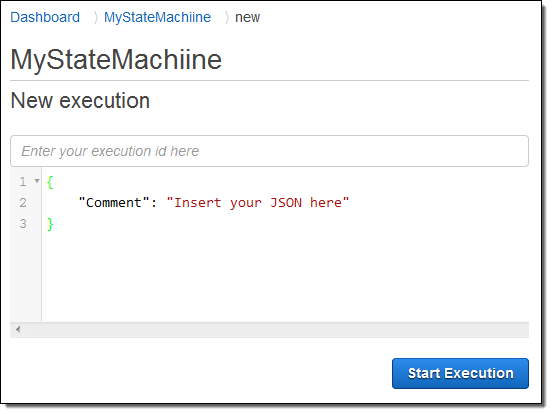
The state machine starts to execute as soon as I click on Start Execution. I can follow along and watch as execution flows from state to state:
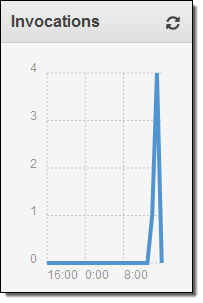
I can visit the Lambda Console and see that my function ran four times as expected (I was pressed for time and didn’t bother to create four separate functions):
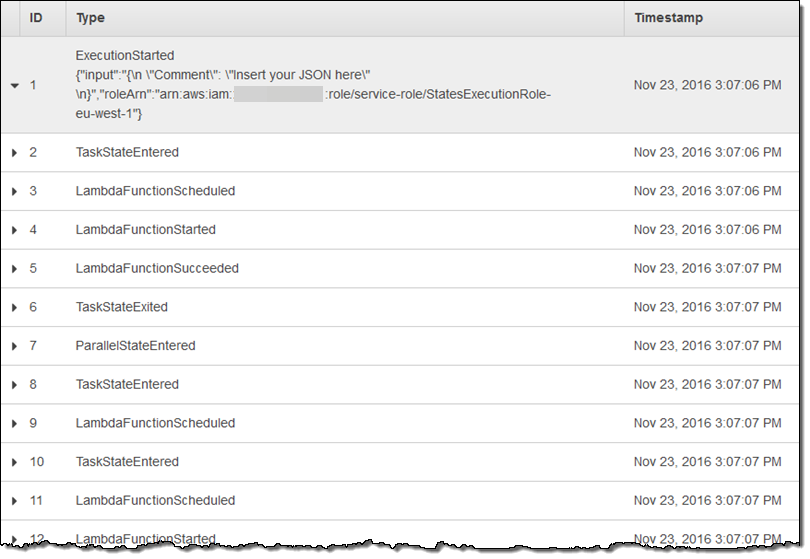
AWS Step Functions records complete information about each step and I can access it from the Step Console:
AWS Step Functions API
As I mentioned earlier, most of your interaction with AWS Step Functions will happen through the APIs. Here’s a quick overview of the principal functions:
CreateStateMachine– Create a new state machine, given a JSON description.ListStateMachines– Get a list of state machines.StartExecution– Run (asynchronously) a state machine.DescribeExecution– Get information about an execution.GetActivityTask– Poll for new tasks to run (used by long-running workers).
You could arrange to run a Lambda function every time a new object is uploaded to an S3 bucket. This function can then kick off a state machine execution by calling StartExecution. The state machine could (as an example) validate the image, generate multiple sizes and formats in parallel, check for particular types of content, and update a database entry.
The same functionality is also available from the AWS Command Line Interface (CLI).
Development Tools
You can use our new statelint gem to check your hand or machine-generated JSON for common errors including unreachable states and the omission of a terminal state.
Download it from the AWS Labs GitHub repo ( it will also be available on RubyGems) and install it like this:
$ sudo gem install j2119-0.1.0.gem statelint-0.1.0.gemHere’s what happens if you have a problem:
$ statelint my_state.json
2 errors:
 State Machine.States.Goodbye does not have required field "Next"
 No terminal state found in machine at State Machine.States
And if things look good:
$ statelint my_state.json
$
Available Now
AWS Step Functions is available now and you can start using it today in the US East (Northern Virginia), US East (Ohio), US West (Oregon), EU (Ireland), and Asia Pacific (Tokyo) Regions.
As part of the AWS Free Tier, you can perform up to 4,000 state transitions per month at no charge. After that, you pay $0.025 for ever 1,000 state transitions.
You can learn more during our webinar on December 16th. Register here.
— Jeff;