Category: Education
Whiteboard with an SA: AWS Direct Connect
In this brief whiteboarding video, learn how to establish a dedicated network connection from your premises to AWS with AWS Direct Connect. Todd Gagorik, AWS Solutions Architect, shows you how you can establish private connectivity between AWS and your datacenter, office, or colocation environment with AWS Direct Connect. In many cases, this can reduce your network costs, increase bandwidth throughput, and provide a more consistent network experience than Internet-based connections.
Todd will walk you through how to establish a dedicated network connection between your network and one of the AWS Direct Connect locations. This allows you to use the same connection to access public resources, such as objects stored in Amazon S3 using public IP address space, and private resources, such as Amazon EC2 instances running within an Amazon Virtual Private Cloud (VPC) using private IP space, while maintaining network separation between the public and private environments.
Watch this video to learn how you can take advantage of the benefits of AWS Direct Connect.
Continue to whiteboard with our AWS Worldwide Public Sector Solutions Architects for step-by-step instructions and demos on topics important to you in our YouTube Channel. Have a question about cloud computing? Our public sector SAs are here to help! Send us your question at aws-wwps-blog@amazon.com.
University of Muenster Creates openSenseMap to Engage with Citizens and Students
From the home to the classroom, University of Muenster works to engage citizens and students with scientific learning. As part of this effort, the university recently created the openSenseMap, an easy-to-use, open application platform built for the publishing of open sensor data.
 With the openSenseMap, University of Muenster relies on sensors to collect geographic and environmental data (temperature, humidity, air pressure, and illuminance) from users with do-it-yourself sensor stations called senseBox:home and senseBox:edu. With a senseBox, you can take measurements that will help to answer a variety of scientific questions supporting citizen science projects locally and globally. Data collected by senseBoxes can provide measurements of various environmental factors and can contribute to more precise statements regarding climate, pollution, or traffic. Each senseBox:home and senseBox:edu transmits its measurements directly to the map, where anyone can observe, analyze, and download the data. This method to collect data has provided an accessible and tangible way to work with data, teach programming skills, and learn more about the environment.
“To get more people involved, the sensebox needs to be usable and fast. By moving the platform to the AWS Cloud, we have seen improved speed and better service, and it is more secure and more stable compared to our local server,” said Thomas Bartoschek, Research Associate at the Institute for Geoinformatics at the University of Muenster, and founder and leader of the GI@School Lab and of senseBox.
Prior to moving to AWS, the openSenseMap was hosted on local servers at the university. They were unable to scale up, and the team dealt with problems running and scaling the app. With the goal of engaging with more citizens and students, they needed scalability. Since they received funding in April from the German Education Ministry, they have tripled the number of users from 60 to 250 registered sensors and devices actively submitting data.
The senseBox program works with schools, teachers, and citizens to educate, share data, and engage with scientists to discover more about the environment. The senseBox is developed exclusively following open science principles publishing the collected data for public use. Anyone can take the data and build dashboards or other tools on top of it. It is also not restricted by products, and is open to other sensors as well.

The university also won the CodeWeekAward, an independent EU and German initiative to get citizens and young students interested in coding. They organized a sensebox hackthon for kids during summer vacation, and 40 kids between 10-18 from Germany took part in the event. During the three-day hackathon powered by AWS, the participants gathered ideas, formed groups, coded applications, and built prototypes with the hardware. AWS provided access to our platform services and provided an Alexa Echo device for building voice interfaces to the sensebox. For example, two students used Alexa to interact with the sensebox data on OpenSenseMap to determine whether they would need sunscreen in City X or what to wear on that given day. See the presentation here. Three other groups used AWS to generate applications on measuring daily CO2 output and to save sensor output (camera pictures, temperature data, and more) on Amazon Simple Storage Service (Amazon S3).
An Eye on Science: How Stanford Students Turned Classwork into Their Life’s Work
Imagine visiting your doctor only to discover that you are losing your vision. That’s the reality for millions of people with diabetes every year around the world. Diabetic retinopathy causes progressive damage to the retina and is one of the leading causes of blindness. It afflicts more than 100 million people. Early intervention helps in 90% of the cases, but often the diagnosis happens too late due to the cost, complexity, and expertise required for the scanning exam.
Early last year, Stanford University students, Jason Su and Apaar Sadhwani, took the Project in Mining Massive Data Sets course taught by Dr. Anand Rajaraman and Dr. Jeffrey Ullman. The course gives students practical experience in data mining and machine learning algorithms for analyzing large amounts of data. Students undertake team projects of their own design with the mentorship of professors and the cloud computing power of Amazon Web Services (AWS). AWS provided platform credits to the students and instructor as part of the curriculum.
Building on their project that used AWS in the classroom, Jason and Apaar dared to ask the question: can deep learning be applied to quickly and cost-effectively identify the precursors to blindness caused by diabetic retinopathy?
Deep learning is like machine learning; it allows the computer to adjust and fine-tune a general model based on the data it sees and “learns” from it, rather than having a human enter parameters or design complicated rules for the machine to follow. In the past, algorithms to understand retinal images were all based on narrow approaches assuming ideal images. They couldn’t manage the many common artifacts in pictures and they required a prohibitive amount of compute power, making them impractical for a real clinic. In practice, doctors painstakingly scan through eye images looking for tiny lesions that suggest the onset of the disease. This process of finding needles in a haystack takes several minutes for each image. Deep learning could be the key to automating this process.
Based on their experiences in class, Jason and Apaar knew AWS provided the compute and storage resources for an automated diagnostic solution based on eye imagery. This was the starting point for their journey from “grass roots to [a] sophisticated infrastructure” for predicting eye diseases.
Using Amazon Elastic Compute Cloud (Amazon EC2), Amazon Simple Storage Service (Amazon S3), and Amazon Elastic Block Store (Amazon EBS), Apaar and Jason have imported more than 80,000 eye images and they are trying to access tens of thousands more from other sources, both local to Stanford and international. They are using AWS to manage, crunch, and review the many gigabytes of data.
For Apaar, AWS makes research much easier. “It is difficult to get access to large computing resources. AWS is so convenient to scale up and scale down. With AWS, we start small and it gives the institution and professors the confidence that we should be investing more.”
Next, they experimented with new architectures for neural networks—the models for deep learning—that they created to automate diagnosis of retinal images. It takes just two days to train a new model from scratch on AWS. They try new models over and over, based on advice and insights from ophthalmologists, improving diagnostic accuracy to expert human-level and speeding the network to analyze several images every second.
Their project, Automatic Grading of Eye Diseases through Deep Learning, is gaining attention. The project was one of the featured highlights at the GPU Technology Conference 2016 in San Jose, California. In the future, they hope to deploy their solution on cameras that are widely accessible to primary-care doctors, pharmacists, and patients, so monitoring becomes ubiquitous, regardless of income level or access to medical care. With greater vigilance, surgical intervention becomes safer and more effective, improving the chance of saving patients’ sight.
For now, the team will continue their work. “Before AWS, we couldn’t even attempt these projects. Now we can launch nodes at whim and just try something new, whatever pops into our heads. We come up with an idea, implement, and let it go,” said Jason Su. “AWS makes research liberating.”

What will your students dare to ask when they use the cloud? Join AWS Educate for free credits and other cloud resources, and bring the power of possibility to your classroom.
AWS Public Sector Month in Review – September

Check out the AWS Public Sector Month in Review featuring the content published for the education, government, and nonprofit communities in September.
Let’s take a look at what happened this past month:
All – Government, Education, & Nonprofits
- Whiteboard with an SA: Amazon Virtual Private Cloud
- Whiteboard with an SA: AWS Code Deployment
- Whiteboard with an SA: Tags
- Q&A with Planet OS: Learn about the OpenNEX Climate Data Access Tool
- Announcing Terrain Tiles on AWS: A Q&A with Mapzen
Education
- Industry, Teaching, and Jobs: How One Instructor Keeps Learning to Prepare Students for Cloud Careers
- Exatype: Cloud for HIV Drug Resistance Testing
Government
- Texas State Library and Archives Commission Turns to the Cloud to Launch Texas Digital Archive
- AWS Signs CJIS Agreement with State of Oregon
- AWS Signs CJIS Agreement with the State of Louisiana
- Improve Operations and Increase Efficiencies with the AWS Cloud
- Join the TfL Hackathon to Help Manage the Capacity of London’s Transport Network
- The Future of Policing: BJA Smart Suite Summit Recap
- The Future of Policing: Not the Robocop Hollywood Imagined
Nonprofits
New Customer Success Stories
Latest YouTube Videos
- AWS GovCloud (US) Intro
- Internet-of-Things (IoT) and New Sensors – Agriculture IoT in Action
- Overview of Earth Observation Data in the Cloud and Internet-of-Things for Agriculture
- The Future of Agriculture
- Connecting Space to Village – Cloud-based solutions for Food Security
- Cloud Computing and the Geospatial Sciences
- How Technology is Enabling a New Era of Farming
- Big Data Infrastructure for Data Driven Agriculture
Upcoming Events
Attend one of the events happening in October listed below and meet with AWS experts to get all of your questions answered.
- October 5-6 – EuroCloud Forum – Bucharest
- October 10-12 – GovWare – Singapore
- October 11-12 – Big Data and Healthcare Analytics – Australia
- October 11-12 – eResearch Australasia 2016 – Melbourne
- October 12 – AFCEA Bethesda Health IT Day – Bethesda, MD
- October 15-18 – IACP Annual Conference – San Diego, CA
- October 15- 24 – Codeweek.eu Germany – Germany
- October 18 – FedTalks – Washington, DC
- October 18 – 21 – Evolve (Technology One User Conference) – Brisbane
- October 24-27 – Gartner Symposium – Gold Coast
- October 25 -26 – Columbus Digital Summit – Columbus, OH
- October 25- 28 – Educause – Anaheim, CA
- October 26-28 – Blackbaud BBCON Conference – National Harbor, MD
- October 27 – AWS Enterprise Summit Paris – Paris
Follow along on Twitter for all of the latest AWS news for government and education.
Whiteboard with an SA: Tags
What are tags and what can you do with them? Tags help you manage your instances, images, and other Amazon Elastic Compute Cloud (Amazon EC2) resources. Tags enable you to categorize your AWS resources in different ways – for example, by purpose, owner, or environment.
In this whiteboarding video, Jerry Rhoads, AWS Solutions Architects, walks you through how to tag. This is useful when you have many resources of the same type — you can quickly identify a specific resource based on the tags you’ve assigned to it. We recommend that you devise a set of tag keys that meets your needs for each resource type. Using a consistent set of tag keys makes it easier for you to manage your resources. You can search and filter the resources based on the tags you add.
Watch this demo video to learn more about how tagging works.
Continue to whiteboard with our AWS Worldwide Public Sector Solutions Architects for step-by-step instructions and demos on topics important to you in our YouTube Channel. Have a question about cloud computing? Our public sector SAs are here to help! Send us your question at aws-wwps-blog@amazon.com.
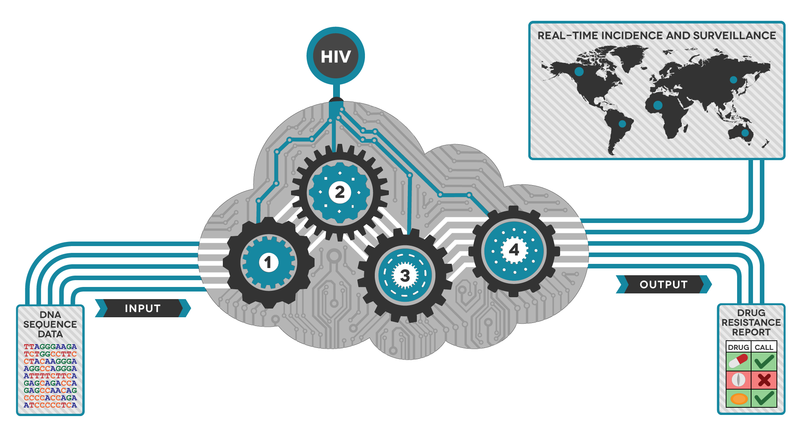
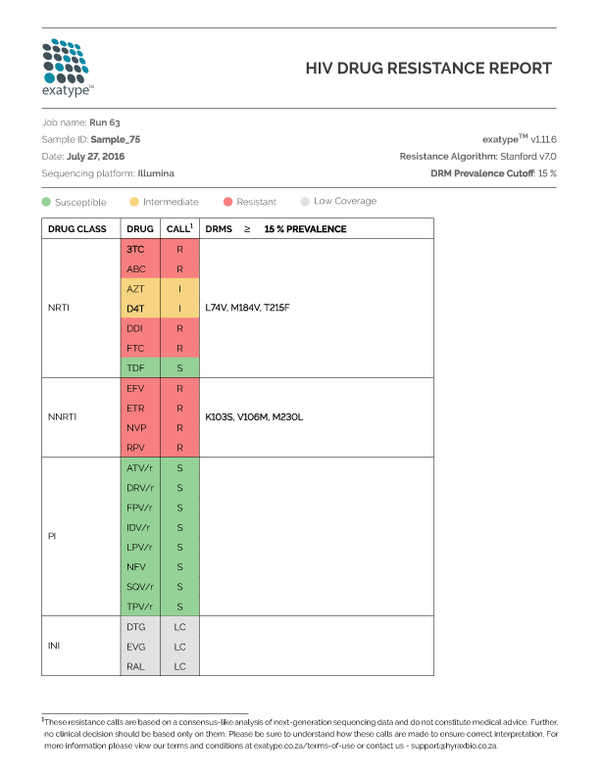
Exatype: Cloud for HIV Drug Resistance Testing
Professor Simon Travers and his team of researchers based at the South African National Bioinformatics Institute (SANBI) at the University of the Western Cape (UWC) have launched the Exatype platform, which runs on AWS. The Exatype platform provides rapid, accurate HIV drug resistance analysis at affordable rates. Users upload HIV sequence data files directly from high-throughput sequencing machines and receive a detailed drug resistance genotype report for each sample.
What started as an idea from Professor Travers to help the over six million South Africans living with HIV has now gone commercial and can test hundreds of people per machine per day in a more cost effective, scalable way.
In 2011, when this idea became a reality, the team realized the number of approaches available for HIV drug resistance testing. They could use software with the sequencing machine, and then analyze the data locally. With this approach, they recognized support issues and the hurdle of keeping the software up to date, thus increasing the cost per test. Or they could perform the data analysis in the cloud. Without needing to buy servers, Professor Travers realized they could drive down the cost of data analysis substantially and have unlimited scalability.
“Being able to access the computation requirements we need for a specific amount of time instead of buying high-end computing hardware that we don’t use most of the time was a no brainer,” Professor Travers said. “When we migrated to AWS, we got the computing power we needed at a much cheaper cost.”
How does it work?
The goal of HIV drug resistance testing is to identify mutations present within the viral population of an HIV-infected individual. These mutations can cause resistance to one or more drugs, so accurately identifying their presence/absence can help determine the best path for treatment. Now with new ways of generating the sequencing data quickly, vast quantities of complex data is produced. Data production is relatively easy, but analyzing it can be difficult.
Simon and team have developed a tool that takes data directly off of the sequencing machine and produces an easy-to-read PDF report within an hour. But it isn’t just about the speed to result; Exatype is highly accurate and can distinguish between background errors in the data and true mutations.
“With AWS, we could analyze data from every HIV-positive person in the world and use every sequencing machine possible, and still be able to generate the reports without any delay,” Professor Travers said. “This is not possible with anything other than the cloud.”
In addition to being scalable and more cost effective, the current approach provides greater sensitivity to detect resistance at low prevalence. The traditional way identifies a drug resistance mutation only if it is present in greater than 20% of the virus in the individual. Theoretically, this new approach to sequencing means that drug-resistant viruses present in less than 1% of the viruses circulating within a HIV-infected individual can be identified.
Looking ahead – What’s next?
Based on the possibilities of the cloud, the team is looking to move into other microbial resistance disease lines, such as Staphylococcus aureus, tuberculosis, and Hepatitis C. Exatype is a disease-agnostic application, and the set of references and rules applied to various diseases can be altered without having to tailor computing requirements. This will enable fast, accurate, and secure interpretation of next-generation sequencing to help as many people as possible get the right treatments.
Whiteboard with an SA: AWS Code Deployment
How can you easily deploy your code on AWS? AWS has several services which would allow you to do this. Whiteboard with Leo Zhadanovsky, AWS Solutions Architect, as he shows you how to use AWS CodeDeploy and other services to make it easier for you to rapidly release new features, help you avoid downtime during application deployment, and handle the complexity of updating your applications.
With several options available to deploy your code on AWS, Leo shares a proposed architecture and gives step-by-step instructions on how you can store your code in a git repository, or an S3 bucket, and use AWS Elastic Beanstalk to provision EC2 instances, deploy your code to them, set up autoscaling groups, configure your Elastic Load Balancer, and provision your RDS database.
Watch this video to learn how to make deploying your code on AWS as easy as possible!
Continue to whiteboard with our AWS Worldwide Public Sector Solutions Architects for step-by-step instructions and demos on topics important to you in our YouTube Channel. Have a question about cloud computing? Our public sector SAs are here to help! Send us your question at aws-wwps-blog@amazon.com.
Announcing Terrain Tiles on AWS: A Q&A with Mapzen
We are excited to announce Terrain Tiles on AWS, a new AWS Public Dataset that makes global digital elevation models (DEMs) available for anyone to access from Amazon Simple Storage Service (Amazon S3). DEMs provide a way to examine the elevation of the Earth’s surface and are available as terrain raster tiles. We connected with Mapzen, an open, sustainable, and accessible mapping platform which lets you display, search, and navigate our world. Mapzen gathered the elevation data from various public sources and is making it easy for startups, enterprises, and research institutions to access and use via Amazon S3. Elevation data has been one of the top public dataset requests, so we are excited about the recent launch. Making Earth observation data available in the cloud is accelerating scientific discovery and enabling the creation of new products.
Read our interview below with Mapzen about the newly released dataset and how they run entirely on open-source tools and are powered by open data.
What are terrain tiles? What sort of geospatial data are they providing?
Terrain tiles provide open elevation data for the entire world in a raster tile format. By aggregating, standardizing, and tiling multiple source datasets into common web mapping and desktop GIS formats and dimensions, it’s much easier to process the data and build applications on top of it.
Each square-shaped terrain tile contains a grid of elevation values. For example, the grid cell for Mount Everest would has a value of 8,848 meters above sea level, while the grid cell for Challenger Deep has a value of 10,994 meters below sea level.
If you are familiar with digital elevation models (DEMs) or digital terrain models (DTMs), then you’ll be interested in terrain tiles. Tiles are available for zooms 0 through 15 in several spatial data formats, including PNG and GeoTIFF tiles in web Mercator projection, as well as SRTM-style HGT in raw latlng projection. A derived “normal map” product is also available, which precomputes math on the server so your mobile phone doesn’t overheat and can be combined with renders like Tangram to generate spheremap-based hillshades and real-time 3D scenes.
With terrain tiles, you have the power to customize the content and visual appearance of your map on the fly and perform complicated analysis on the desktop or in the cloud. We’re excited to see what you build!
Where does the data for the terrain tiles come from?
Mapzen aggregates elevation data from several open data providers, including 3 meter and 10 meter 3DEP (formerly NED or National Elevation Dataset) in the United States, 30 meter SRTM globally, and coarser GMTED zoomed out and ETOPO1 to fill in bathymetry – all powered by GDAL VRTs, and some special sauce. We’d love to add additional detail in your area, so send us data source tips!
Why did you decide to make the terrain tiles publicly available?
Mapzen is committed to making all of our data and mapping solutions open and available to the public because we believe doing so will encourage innovation amongst developers and designers looking for greater personalization and control in their mapping capabilities. Through the open community, we’re able to offer a level of flexibility and accessibility not currently present in the industry today, without the costs associated with leveraging existing infrastructures. Even without the big budgets, developers and entrepreneurs of all sizes can incorporate our mapping functionality into whatever they are working on.
Can you provide an estimate of how much data you’re creating? How has working on AWS helped you to handle this amount of data?
The total file size of all the tiles Mapzen has created is around 51.5TB. Working on AWS has allowed us to store over 4.6 billion tiles easily in S3, without having to worry about provisioning redundant storage ourselves. Moreover, S3 serves as a platform for efficiently distributing the tile data to users, greatly simplifying deployment and maintenance of such a service.
How are you using terrain tiles in your own products internally?
Mapzen uses terrain tiles internally for our elevation lookup service and Walkabout map style. We will also be using the tiles for our upcoming terrain tile service and Tron map style.
How do you expect others to use terrain tiles in their own workflows?
Mapzen encourages people to use our data and leverage it in the best or most beneficial way for whatever projects they are working on. We have found that the terrain titles are particularly beneficial for helping design the following mapping elements:
- Lookup elevation values for a map location
- Create elevation profiles along a line
- Select map locations within an elevation range
- Hillshades
- Slopes
- Contours
- Hyposometric tints
- Coastal flooding models
- Model tsunami evacuation zones
- Other advanced GIS modeling using 3D height maps
- Flight simulators (combined with satellite data, see related Amazon public data)
- Estimate crop yield for agriculture (combined with weather information)
Thank you, Mapzen, for your work making this data available to the public!

Learn more about Terrain Tiles on AWS and access the Landsat and NAIP public datasets.
Join the TfL Hackathon to Help Manage the Capacity of London’s Transport Network
A guest post by Rikesh Shah, Lead Digital Relationship Manager, Transport for London (TfL) Online
There are 30 million journeys made in London every day. On September 23, Transport for London (TfL) in partnership with Amazon Web Services and Geovation are hosting a hackathon in London to seek ways to make these journeys more efficient by maximising capacity on the public transport network, maximising capacity on the roads network, and improving air quality. These open data sets are fueling entrepreneurship, accelerating scientific discovery, and enabling Londoners and visitors to travel more easily across the capital.
This hackathon provides the opportunity to win prizes, including six months’ worth of support (office space, business mentoring, and access to technical and subject matter experts). So, whether you’re a start-up or a developer, if you are in a position to develop a product that addresses the challenges outlined below, you should join us at the launch event. All entries will be judged by a panel in a closed environment to protect your idea.
There are over 500 apps powered by TfL data used by millions of people every day – we would like to see more. We want your solutions to help manage the capacity of London’s transport network.
Through this transport-focused hackathon, TfL, Geovation, and AWS want to work with the start-up community, app developers, UX and design specialists, and anyone with a passion for data in order to build new applications and unlock new insights from the data.
- Maximising capacity on the public transport network: TfL is committed to improving customer journeys and increasing the capacity of services to cope with increasing passenger numbers. Customers have told TfL they would like more information to help them avoid the busiest times and places. This might be by taking a different route, making a small change to travel time, or even travelling in a different way. You could help offer a quicker and more comfortable journey.
- Maximising capacity on the roads network: London’s rapid population growth, increasing economic activity, and rising traffic volumes is posing a set of challenges for the road network. By 2018, we expect to see around 1.25 million more trips each day on the roads. Therefore, to maintain road network performance, we need to increase the effective capacity of the roads, and move from not just dynamically managing London’s streets in real time, but to making the jump towards predictively managing them. Help us to optimise the use of road space capacity and ensure we can recover capacity quickly when incidents occur. Topics we would like the hackathon to focus on are: understanding the capacity of the road network in real time; detecting incidents and their impact on network capacity in real time; and visualising the state of the road network and predicting how it will look into the near future.
- Air quality: For TfL, our role is more than simply getting people from A to B quickly. We also want to make London cleaner and greener and contribute to a better quality of life for Londoners, now and in the future. Air quality is the biggest environmental challenge to face London. We want to know when and how to best provide customers with information that can influence behavioural change around being ‘greener.’
Join us at the hackathon and get access to AWS solutions architects, TfL staff, and Geovation technical experts to help you take your idea forward.
Mark your calendar with the details below:
- Venue: Amazon’s offices – 60 Holborn Viaduct, EC1A 2FD, London and remote access
- When: Hack for a week: September 23 – September 30, 2016. There will be two launch sessions: 23rd September, 12pm and 5:30pm, so join whichever one works for you.
- What you’ll need: You will need to bring a laptop and you will need an AWS account. AWS credits and an API will be provided to access the data.
How it works
- The hackathon will launch on 23 September to share the challenges
- Surgeries with subject matter experts will be hosted from September 26-29 at the AWS and Geovation offices.
- Your entry will be judged on September 30 at the AWS office or you can attend remotely.
Already have some ideas? Click here to register and add the event to your calendar. We look forward to seeing you there!
Learn more about the available Transport for London open datasets here.
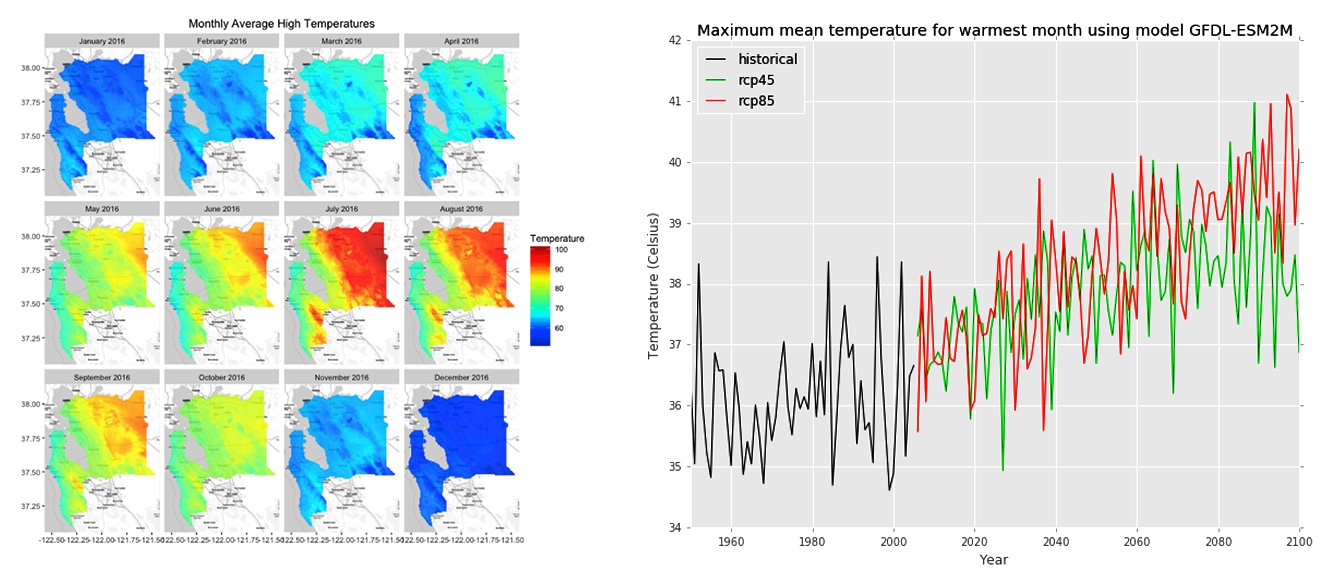
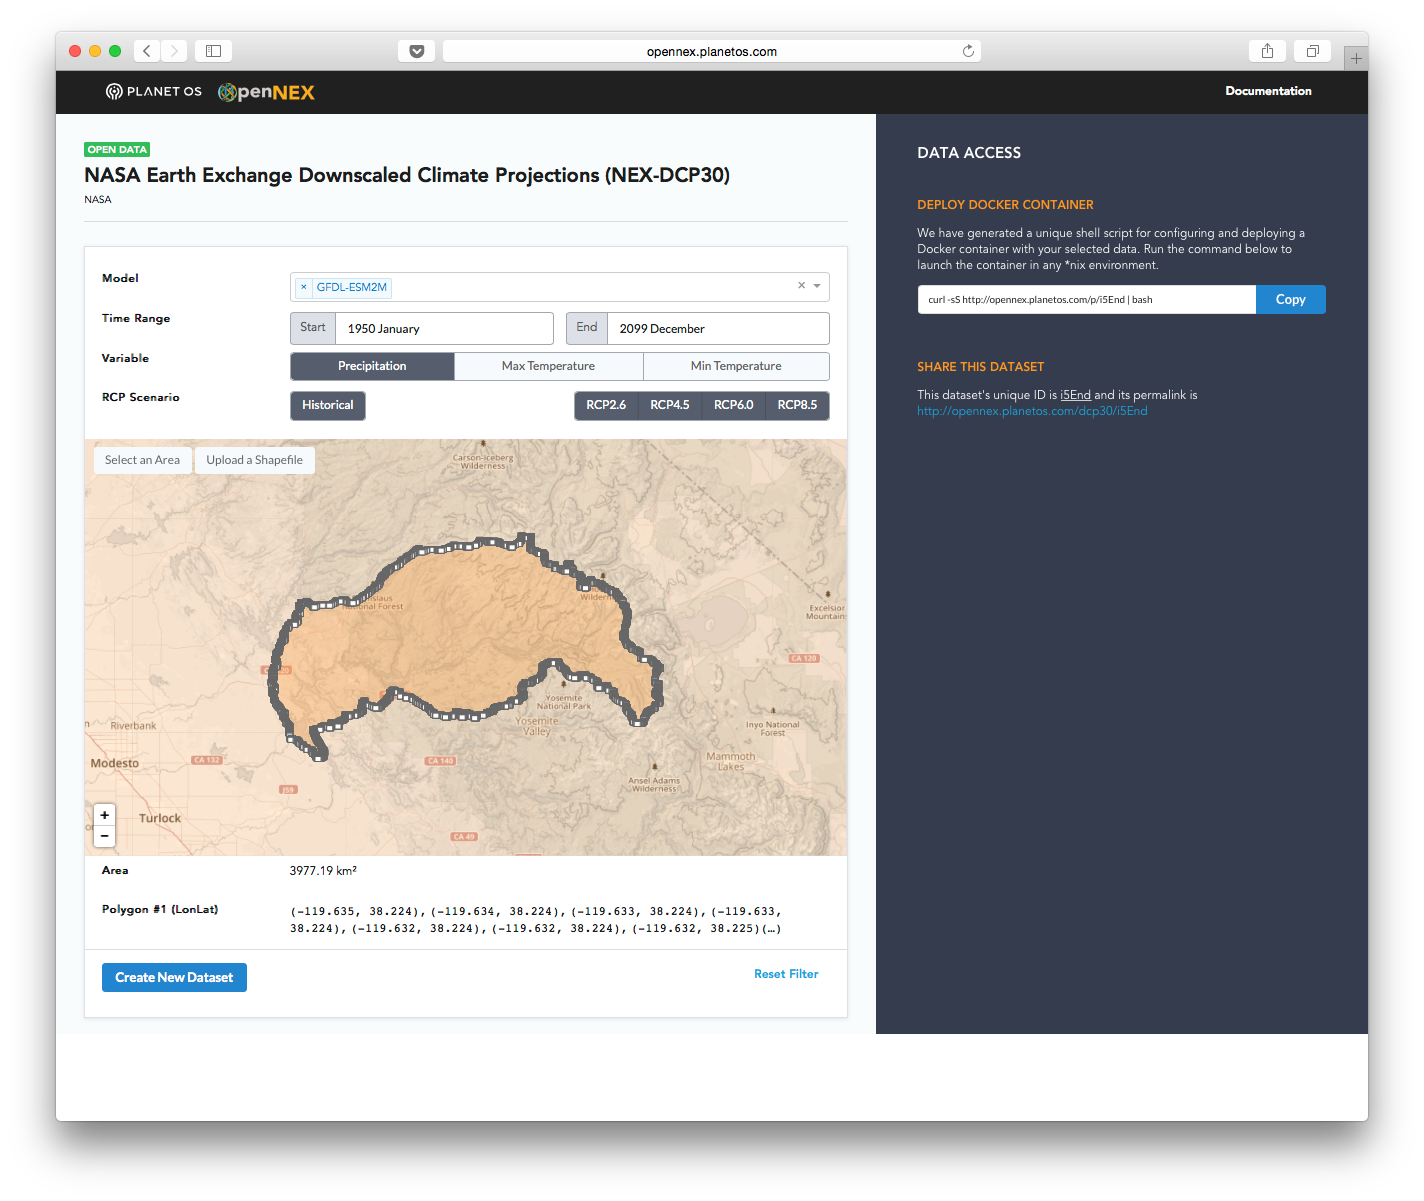
Q&A with Planet OS: Learn about the OpenNEX Climate Data Access Tool
Planet OS announced their OpenNEX Climate Data Access Tool, which allows users to generate custom datasets from the NASA Earth Exchange GDDP and DCP-30 data. With this launch, Planet OS is helping the NASA Earth Exchange team make these valuable climate datasets accessible to the masses, and taking a big step closer to their long-term vision of changing the way data-driven decisions are made.
We had a few questions for the Planet OS team about the project, how they use AWS, and how they plan to continue their innovation. Check out the Q&A below:
What is the OpenNEX project?
Open NASA Earth Exchange (OpenNEX) is a public-private partnership launched in 2014 to promote the discovery, access, and analysis of NASA Earth Exchange data in support of climate assessment. The OpenNEX project builds upon the work done by NASA Earth Exchange by providing open access to a variety of large-scale data products produced by NEX, as well as complementary tools and resources to encourage engagement with the data.
Why is the OpenNEX Climate Data Access Tool needed?
As a part of the OpenNEX project, two downscaled climate projection datasets produced by NEX, Downscaled Climate Projections (NEX-DCP30) and Global Daily Downscaled Projections (NEX-GDDP), were openly published on Amazon Simple Storage Service (Amazon S3) and remain freely accessible there. These downscaled and bias-corrected datasets provide a better representation of regional climate patterns and are useful for determining climate impacts to crop productivity, flood risk, energy demand, and human health. With such a wide range of real-world applications, this climate data is important not only to scientists and researchers, but also to non-technical stakeholders who are responsible for developing response plans, public policy, and climate-related legislation. The OpenNEX Climate Data Access Tool was designed to enable quick, easy access to non-technical users, while also providing more efficient access to tech-savvy domain experts.
How has OpenNEX data being available on Amazon S3 made development easier?
Having the data available in Amazon S3 enabled us to develop a self-serve tool that lets users do their own data transformation wherever they want to do it. If they run their transformations in Amazon Elastic Compute Cloud (Amazon EC2), it’s blindingly fast, but they can also run transformations on their own servers or on a laptop using Docker. To enhance performance and enable efficient spatial subsetting, we have taken the data stored in Amazon S3 and cut it into tiles, which allows our tool to download the requested data much more quickly.
This is just a preliminary release of the tool, what do you expect to add in the future?
In this release of the tool, the key features include:
- Create Custom Datasets – Create a custom dataset by selecting the time, region, parameter, climate model and scenario that matches your needs. Spatial and temporal slicing enables you to download data only within your area and time of interest.
- Deploy via Docker – Run the provided bash script to deploy a Docker container that will acquire and serve the data you selected. This container can be run on a local machine or deployed to a remote EC2 instance.
CSV or NetCDF Format – Download your data in NetCDF or CSV format. The availability of a CSV option means data can be loaded directly into applications without NetCDF support, such as Excel. - Reproducible – Deploy your container to an EC2 instance and expose the access endpoint to allow others direct access to your custom dataset. You can also share the unique dataset permalink with colleagues, who can launch their own containers to replicate your dataset.
In the future, we hope to integrate these climate datasets with our public Datahub to provide fully programmatic access to the data via our APIs. We’d also like to expand the scope of available data products by partnering with other government agencies and data publishers who are interested in improving their data accessibility.
These climate datasets are very large, how did you approach making them easier to understand and access?
We built a web front end that presents the data as a single dataset and lets users interactively select the subset they want. The system generates a simple URL that’s a link to a data structure describing that selection. The user pulls from this URL to launch a container that does the transformation on a node of their own.
One of the key elements of this model is that users never see the divisions between files or any data that’s out of the specified bounds. As a result, the user of the data just pulls the transformed data and performs the analysis they want on it directly, without needing to merge or filter. The data can be delivered in CSV format so that even tools like Excel can access it directly, or in the richer NetCDF format which allows for high-speed loading and analytics.
How do you expect others to build on top of the OpenNEX Climate Data Access Tool?
We’d love to see people explore the potential impacts of climate change in their local communities and begin to share their own custom datasets with one another. We’ve published a number of examples in our documentation to help people get started and highlight what’s possible.
We also encourage users to reach out with their own examples and use cases, or suggestions for improvements and future features at feedback@planetos.com. For those wanting to learn more, we recommend reviewing the online documentation and joining our free webinar on September 21 where Tom Faulhaber and Dr. Sangram Ganguly will demonstrate how to use the OpenNEX data tool.
Thank you to the Planet OS team for answering our questions and we look forward to future iterations of the tool!