Category: Nonprofit
Exatype: Cloud for HIV Drug Resistance Testing
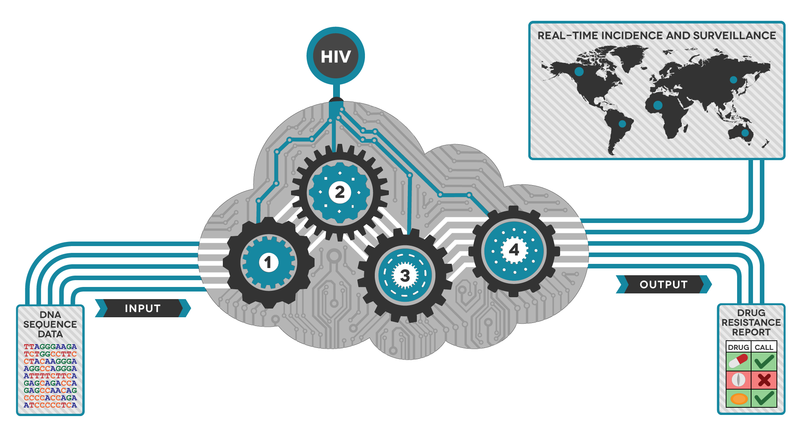
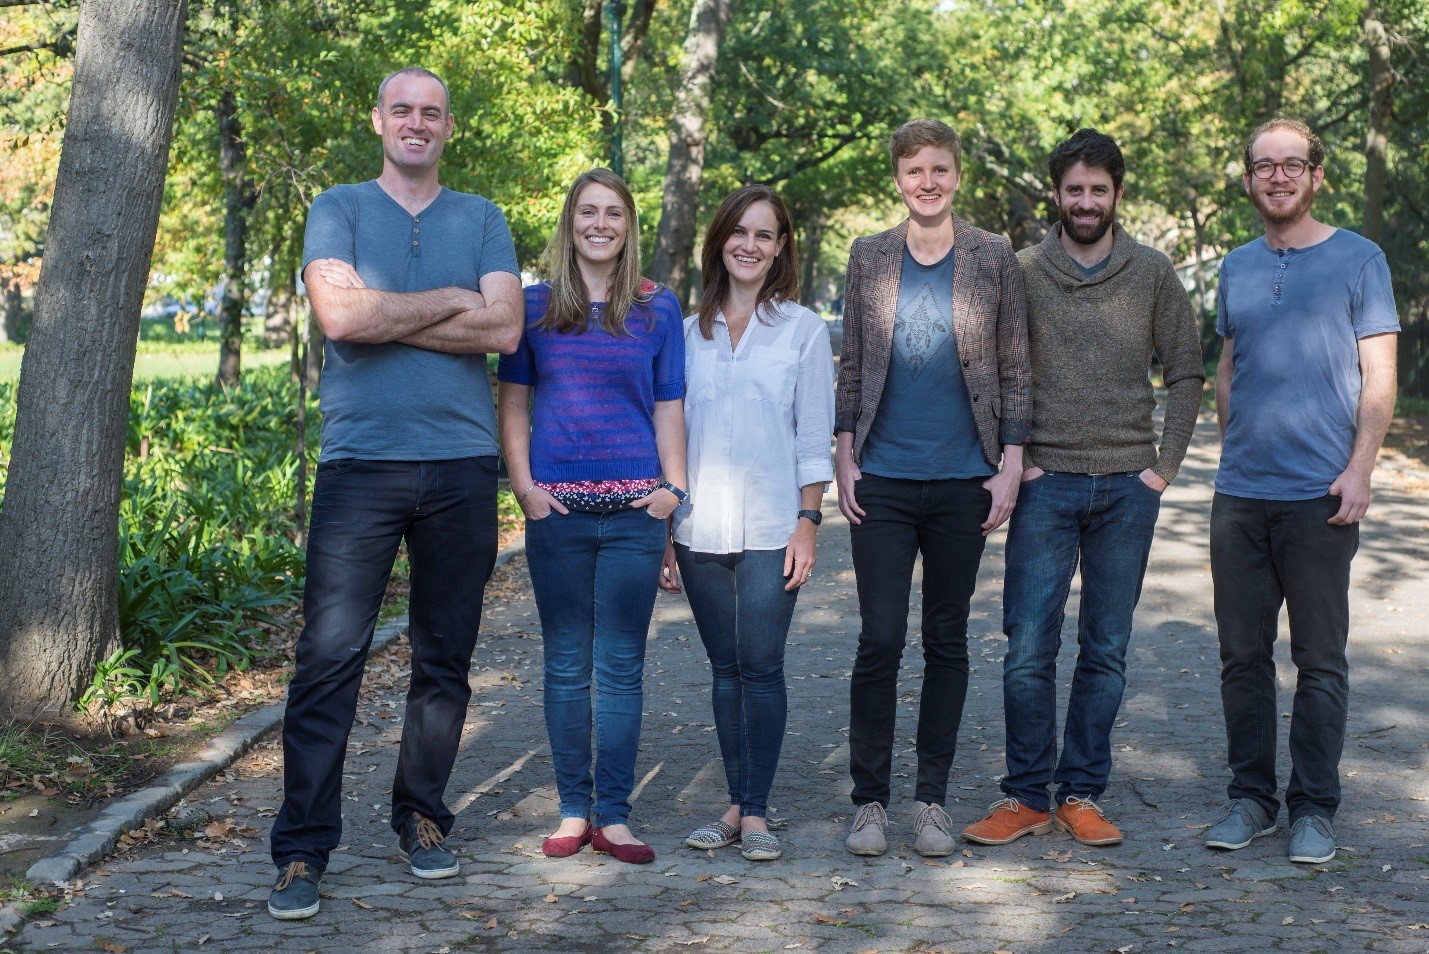
Professor Simon Travers and his team of researchers based at the South African National Bioinformatics Institute (SANBI) at the University of the Western Cape (UWC) have launched the Exatype platform, which runs on AWS. The Exatype platform provides rapid, accurate HIV drug resistance analysis at affordable rates. Users upload HIV sequence data files directly from high-throughput sequencing machines and receive a detailed drug resistance genotype report for each sample.
What started as an idea from Professor Travers to help the over six million South Africans living with HIV has now gone commercial and can test hundreds of people per machine per day in a more cost effective, scalable way.
In 2011, when this idea became a reality, the team realized the number of approaches available for HIV drug resistance testing. They could use software with the sequencing machine, and then analyze the data locally. With this approach, they recognized support issues and the hurdle of keeping the software up to date, thus increasing the cost per test. Or they could perform the data analysis in the cloud. Without needing to buy servers, Professor Travers realized they could drive down the cost of data analysis substantially and have unlimited scalability.
“Being able to access the computation requirements we need for a specific amount of time instead of buying high-end computing hardware that we don’t use most of the time was a no brainer,” Professor Travers said. “When we migrated to AWS, we got the computing power we needed at a much cheaper cost.”
How does it work?
The goal of HIV drug resistance testing is to identify mutations present within the viral population of an HIV-infected individual. These mutations can cause resistance to one or more drugs, so accurately identifying their presence/absence can help determine the best path for treatment. Now with new ways of generating the sequencing data quickly, vast quantities of complex data is produced. Data production is relatively easy, but analyzing it can be difficult.
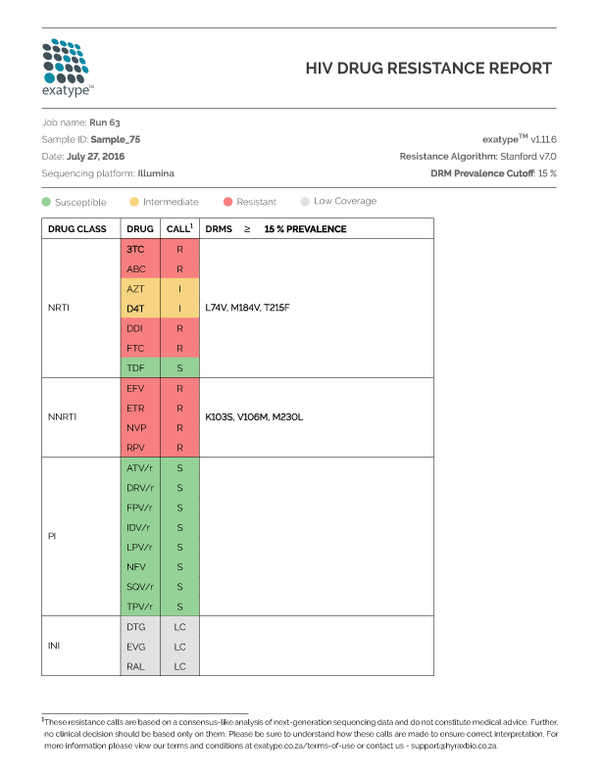
Simon and team have developed a tool that takes data directly off of the sequencing machine and produces an easy-to-read PDF report within an hour. But it isn’t just about the speed to result; Exatype is highly accurate and can distinguish between background errors in the data and true mutations.
“With AWS, we could analyze data from every HIV-positive person in the world and use every sequencing machine possible, and still be able to generate the reports without any delay,” Professor Travers said. “This is not possible with anything other than the cloud.”
In addition to being scalable and more cost effective, the current approach provides greater sensitivity to detect resistance at low prevalence. The traditional way identifies a drug resistance mutation only if it is present in greater than 20% of the virus in the individual. Theoretically, this new approach to sequencing means that drug-resistant viruses present in less than 1% of the viruses circulating within a HIV-infected individual can be identified.
Looking ahead – What’s next?
Based on the possibilities of the cloud, the team is looking to move into other microbial resistance disease lines, such as Staphylococcus aureus, tuberculosis, and Hepatitis C. Exatype is a disease-agnostic application, and the set of references and rules applied to various diseases can be altered without having to tailor computing requirements. This will enable fast, accurate, and secure interpretation of next-generation sequencing to help as many people as possible get the right treatments.
Whiteboard with an SA: AWS Code Deployment
How can you easily deploy your code on AWS? AWS has several services which would allow you to do this. Whiteboard with Leo Zhadanovsky, AWS Solutions Architect, as he shows you how to use AWS CodeDeploy and other services to make it easier for you to rapidly release new features, help you avoid downtime during application deployment, and handle the complexity of updating your applications.
With several options available to deploy your code on AWS, Leo shares a proposed architecture and gives step-by-step instructions on how you can store your code in a git repository, or an S3 bucket, and use AWS Elastic Beanstalk to provision EC2 instances, deploy your code to them, set up autoscaling groups, configure your Elastic Load Balancer, and provision your RDS database.
Watch this video to learn how to make deploying your code on AWS as easy as possible!
Continue to whiteboard with our AWS Worldwide Public Sector Solutions Architects for step-by-step instructions and demos on topics important to you in our YouTube Channel. Have a question about cloud computing? Our public sector SAs are here to help! Send us your question at aws-wwps-blog@amazon.com.
Announcing Terrain Tiles on AWS: A Q&A with Mapzen
We are excited to announce Terrain Tiles on AWS, a new AWS Public Dataset that makes global digital elevation models (DEMs) available for anyone to access from Amazon Simple Storage Service (Amazon S3). DEMs provide a way to examine the elevation of the Earth’s surface and are available as terrain raster tiles. We connected with Mapzen, an open, sustainable, and accessible mapping platform which lets you display, search, and navigate our world. Mapzen gathered the elevation data from various public sources and is making it easy for startups, enterprises, and research institutions to access and use via Amazon S3. Elevation data has been one of the top public dataset requests, so we are excited about the recent launch. Making Earth observation data available in the cloud is accelerating scientific discovery and enabling the creation of new products.
Read our interview below with Mapzen about the newly released dataset and how they run entirely on open-source tools and are powered by open data.
What are terrain tiles? What sort of geospatial data are they providing?
Terrain tiles provide open elevation data for the entire world in a raster tile format. By aggregating, standardizing, and tiling multiple source datasets into common web mapping and desktop GIS formats and dimensions, it’s much easier to process the data and build applications on top of it.
Each square-shaped terrain tile contains a grid of elevation values. For example, the grid cell for Mount Everest would has a value of 8,848 meters above sea level, while the grid cell for Challenger Deep has a value of 10,994 meters below sea level.
If you are familiar with digital elevation models (DEMs) or digital terrain models (DTMs), then you’ll be interested in terrain tiles. Tiles are available for zooms 0 through 15 in several spatial data formats, including PNG and GeoTIFF tiles in web Mercator projection, as well as SRTM-style HGT in raw latlng projection. A derived “normal map” product is also available, which precomputes math on the server so your mobile phone doesn’t overheat and can be combined with renders like Tangram to generate spheremap-based hillshades and real-time 3D scenes.
With terrain tiles, you have the power to customize the content and visual appearance of your map on the fly and perform complicated analysis on the desktop or in the cloud. We’re excited to see what you build!
Where does the data for the terrain tiles come from?
Mapzen aggregates elevation data from several open data providers, including 3 meter and 10 meter 3DEP (formerly NED or National Elevation Dataset) in the United States, 30 meter SRTM globally, and coarser GMTED zoomed out and ETOPO1 to fill in bathymetry – all powered by GDAL VRTs, and some special sauce. We’d love to add additional detail in your area, so send us data source tips!
Why did you decide to make the terrain tiles publicly available?
Mapzen is committed to making all of our data and mapping solutions open and available to the public because we believe doing so will encourage innovation amongst developers and designers looking for greater personalization and control in their mapping capabilities. Through the open community, we’re able to offer a level of flexibility and accessibility not currently present in the industry today, without the costs associated with leveraging existing infrastructures. Even without the big budgets, developers and entrepreneurs of all sizes can incorporate our mapping functionality into whatever they are working on.
Can you provide an estimate of how much data you’re creating? How has working on AWS helped you to handle this amount of data?
The total file size of all the tiles Mapzen has created is around 51.5TB. Working on AWS has allowed us to store over 4.6 billion tiles easily in S3, without having to worry about provisioning redundant storage ourselves. Moreover, S3 serves as a platform for efficiently distributing the tile data to users, greatly simplifying deployment and maintenance of such a service.
How are you using terrain tiles in your own products internally?
Mapzen uses terrain tiles internally for our elevation lookup service and Walkabout map style. We will also be using the tiles for our upcoming terrain tile service and Tron map style.
How do you expect others to use terrain tiles in their own workflows?
Mapzen encourages people to use our data and leverage it in the best or most beneficial way for whatever projects they are working on. We have found that the terrain titles are particularly beneficial for helping design the following mapping elements:
- Lookup elevation values for a map location
- Create elevation profiles along a line
- Select map locations within an elevation range
- Hillshades
- Slopes
- Contours
- Hyposometric tints
- Coastal flooding models
- Model tsunami evacuation zones
- Other advanced GIS modeling using 3D height maps
- Flight simulators (combined with satellite data, see related Amazon public data)
- Estimate crop yield for agriculture (combined with weather information)
Thank you, Mapzen, for your work making this data available to the public!

Learn more about Terrain Tiles on AWS and access the Landsat and NAIP public datasets.
Join the TfL Hackathon to Help Manage the Capacity of London’s Transport Network
A guest post by Rikesh Shah, Lead Digital Relationship Manager, Transport for London (TfL) Online
There are 30 million journeys made in London every day. On September 23, Transport for London (TfL) in partnership with Amazon Web Services and Geovation are hosting a hackathon in London to seek ways to make these journeys more efficient by maximising capacity on the public transport network, maximising capacity on the roads network, and improving air quality. These open data sets are fueling entrepreneurship, accelerating scientific discovery, and enabling Londoners and visitors to travel more easily across the capital.
This hackathon provides the opportunity to win prizes, including six months’ worth of support (office space, business mentoring, and access to technical and subject matter experts). So, whether you’re a start-up or a developer, if you are in a position to develop a product that addresses the challenges outlined below, you should join us at the launch event. All entries will be judged by a panel in a closed environment to protect your idea.
There are over 500 apps powered by TfL data used by millions of people every day – we would like to see more. We want your solutions to help manage the capacity of London’s transport network.
Through this transport-focused hackathon, TfL, Geovation, and AWS want to work with the start-up community, app developers, UX and design specialists, and anyone with a passion for data in order to build new applications and unlock new insights from the data.
- Maximising capacity on the public transport network: TfL is committed to improving customer journeys and increasing the capacity of services to cope with increasing passenger numbers. Customers have told TfL they would like more information to help them avoid the busiest times and places. This might be by taking a different route, making a small change to travel time, or even travelling in a different way. You could help offer a quicker and more comfortable journey.
- Maximising capacity on the roads network: London’s rapid population growth, increasing economic activity, and rising traffic volumes is posing a set of challenges for the road network. By 2018, we expect to see around 1.25 million more trips each day on the roads. Therefore, to maintain road network performance, we need to increase the effective capacity of the roads, and move from not just dynamically managing London’s streets in real time, but to making the jump towards predictively managing them. Help us to optimise the use of road space capacity and ensure we can recover capacity quickly when incidents occur. Topics we would like the hackathon to focus on are: understanding the capacity of the road network in real time; detecting incidents and their impact on network capacity in real time; and visualising the state of the road network and predicting how it will look into the near future.
- Air quality: For TfL, our role is more than simply getting people from A to B quickly. We also want to make London cleaner and greener and contribute to a better quality of life for Londoners, now and in the future. Air quality is the biggest environmental challenge to face London. We want to know when and how to best provide customers with information that can influence behavioural change around being ‘greener.’
Join us at the hackathon and get access to AWS solutions architects, TfL staff, and Geovation technical experts to help you take your idea forward.
Mark your calendar with the details below:
- Venue: Amazon’s offices – 60 Holborn Viaduct, EC1A 2FD, London and remote access
- When: Hack for a week: September 23 – September 30, 2016. There will be two launch sessions: 23rd September, 12pm and 5:30pm, so join whichever one works for you.
- What you’ll need: You will need to bring a laptop and you will need an AWS account. AWS credits and an API will be provided to access the data.
How it works
- The hackathon will launch on 23 September to share the challenges
- Surgeries with subject matter experts will be hosted from September 26-29 at the AWS and Geovation offices.
- Your entry will be judged on September 30 at the AWS office or you can attend remotely.
Already have some ideas? Click here to register and add the event to your calendar. We look forward to seeing you there!
Learn more about the available Transport for London open datasets here.
Q&A with Planet OS: Learn about the OpenNEX Climate Data Access Tool
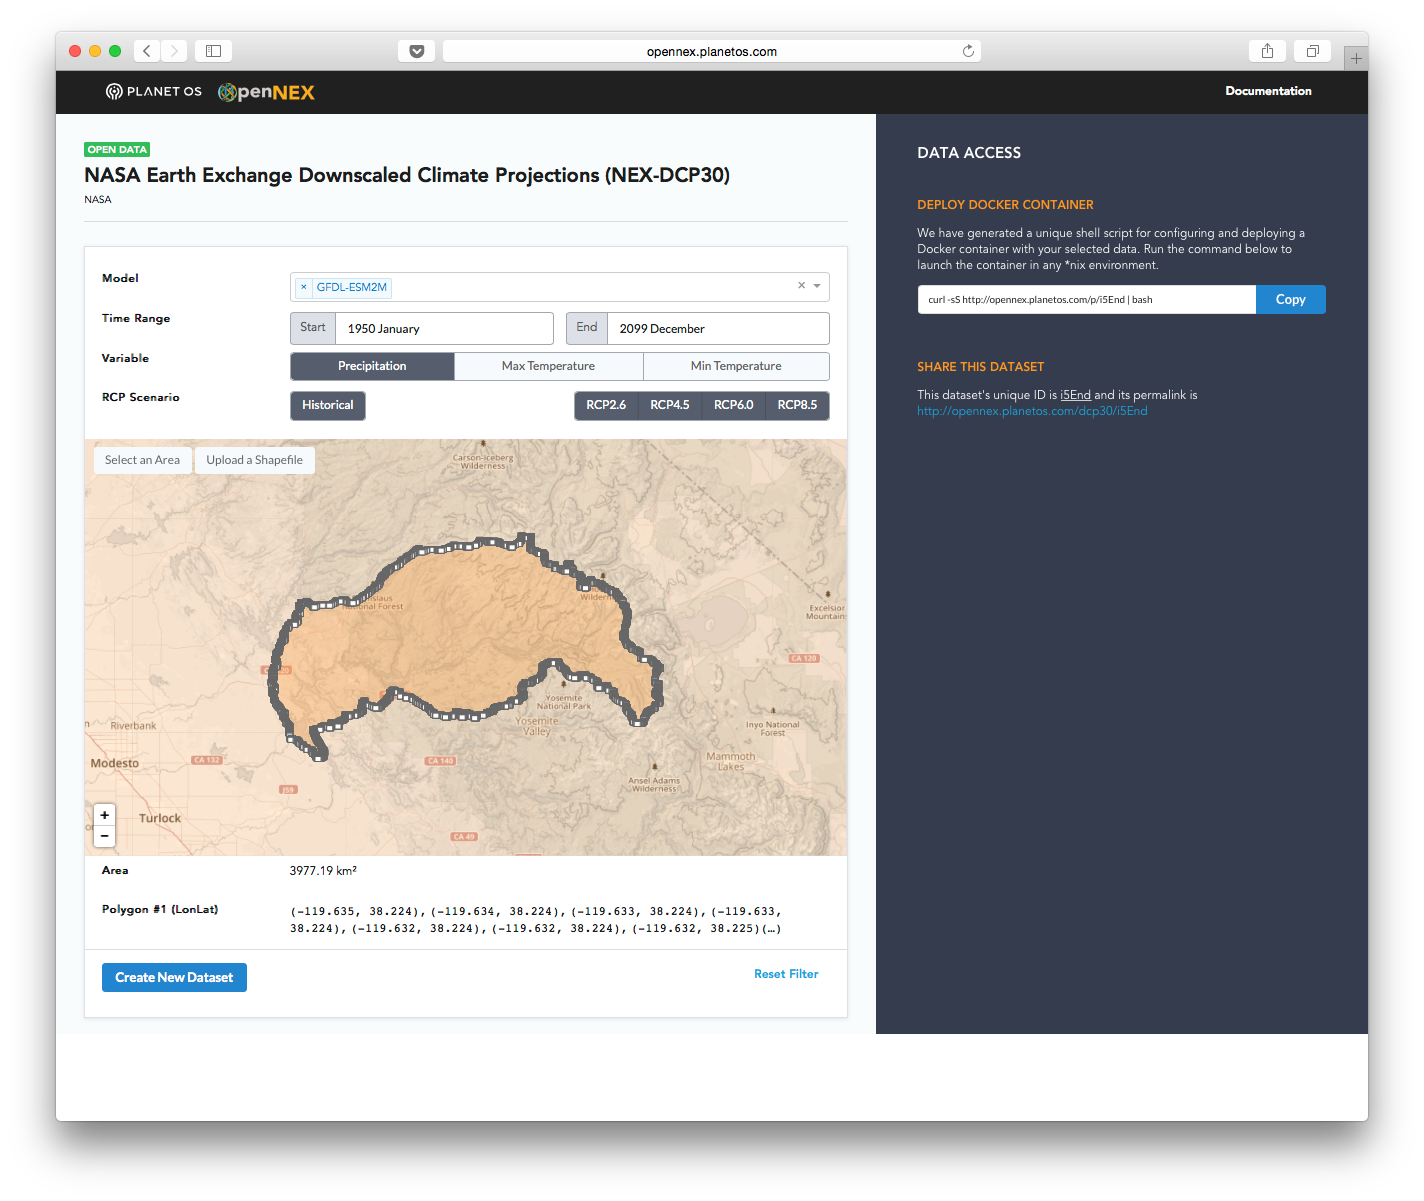
Planet OS announced their OpenNEX Climate Data Access Tool, which allows users to generate custom datasets from the NASA Earth Exchange GDDP and DCP-30 data. With this launch, Planet OS is helping the NASA Earth Exchange team make these valuable climate datasets accessible to the masses, and taking a big step closer to their long-term vision of changing the way data-driven decisions are made.
We had a few questions for the Planet OS team about the project, how they use AWS, and how they plan to continue their innovation. Check out the Q&A below:
What is the OpenNEX project?
Open NASA Earth Exchange (OpenNEX) is a public-private partnership launched in 2014 to promote the discovery, access, and analysis of NASA Earth Exchange data in support of climate assessment. The OpenNEX project builds upon the work done by NASA Earth Exchange by providing open access to a variety of large-scale data products produced by NEX, as well as complementary tools and resources to encourage engagement with the data.
Why is the OpenNEX Climate Data Access Tool needed?
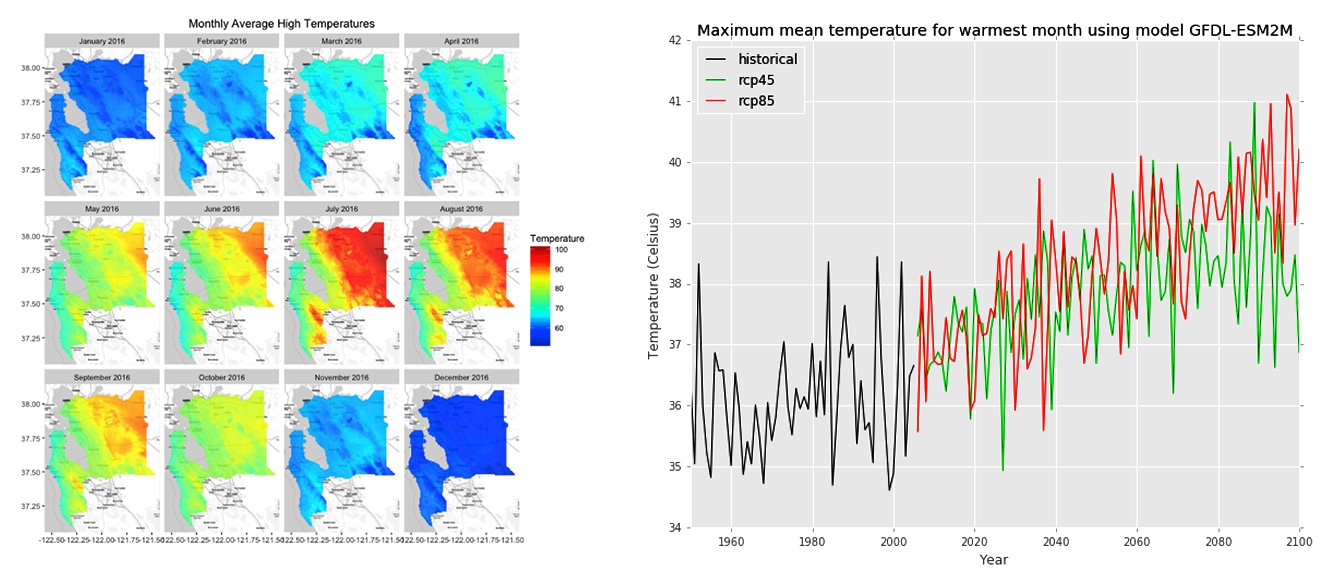
As a part of the OpenNEX project, two downscaled climate projection datasets produced by NEX, Downscaled Climate Projections (NEX-DCP30) and Global Daily Downscaled Projections (NEX-GDDP), were openly published on Amazon Simple Storage Service (Amazon S3) and remain freely accessible there. These downscaled and bias-corrected datasets provide a better representation of regional climate patterns and are useful for determining climate impacts to crop productivity, flood risk, energy demand, and human health. With such a wide range of real-world applications, this climate data is important not only to scientists and researchers, but also to non-technical stakeholders who are responsible for developing response plans, public policy, and climate-related legislation. The OpenNEX Climate Data Access Tool was designed to enable quick, easy access to non-technical users, while also providing more efficient access to tech-savvy domain experts.
How has OpenNEX data being available on Amazon S3 made development easier?
Having the data available in Amazon S3 enabled us to develop a self-serve tool that lets users do their own data transformation wherever they want to do it. If they run their transformations in Amazon Elastic Compute Cloud (Amazon EC2), it’s blindingly fast, but they can also run transformations on their own servers or on a laptop using Docker. To enhance performance and enable efficient spatial subsetting, we have taken the data stored in Amazon S3 and cut it into tiles, which allows our tool to download the requested data much more quickly.
This is just a preliminary release of the tool, what do you expect to add in the future?
In this release of the tool, the key features include:
- Create Custom Datasets – Create a custom dataset by selecting the time, region, parameter, climate model and scenario that matches your needs. Spatial and temporal slicing enables you to download data only within your area and time of interest.
- Deploy via Docker – Run the provided bash script to deploy a Docker container that will acquire and serve the data you selected. This container can be run on a local machine or deployed to a remote EC2 instance.
CSV or NetCDF Format – Download your data in NetCDF or CSV format. The availability of a CSV option means data can be loaded directly into applications without NetCDF support, such as Excel. - Reproducible – Deploy your container to an EC2 instance and expose the access endpoint to allow others direct access to your custom dataset. You can also share the unique dataset permalink with colleagues, who can launch their own containers to replicate your dataset.
In the future, we hope to integrate these climate datasets with our public Datahub to provide fully programmatic access to the data via our APIs. We’d also like to expand the scope of available data products by partnering with other government agencies and data publishers who are interested in improving their data accessibility.
These climate datasets are very large, how did you approach making them easier to understand and access?
We built a web front end that presents the data as a single dataset and lets users interactively select the subset they want. The system generates a simple URL that’s a link to a data structure describing that selection. The user pulls from this URL to launch a container that does the transformation on a node of their own.
One of the key elements of this model is that users never see the divisions between files or any data that’s out of the specified bounds. As a result, the user of the data just pulls the transformed data and performs the analysis they want on it directly, without needing to merge or filter. The data can be delivered in CSV format so that even tools like Excel can access it directly, or in the richer NetCDF format which allows for high-speed loading and analytics.
How do you expect others to build on top of the OpenNEX Climate Data Access Tool?
We’d love to see people explore the potential impacts of climate change in their local communities and begin to share their own custom datasets with one another. We’ve published a number of examples in our documentation to help people get started and highlight what’s possible.
We also encourage users to reach out with their own examples and use cases, or suggestions for improvements and future features at feedback@planetos.com. For those wanting to learn more, we recommend reviewing the online documentation and joining our free webinar on September 21 where Tom Faulhaber and Dr. Sangram Ganguly will demonstrate how to use the OpenNEX data tool.
Thank you to the Planet OS team for answering our questions and we look forward to future iterations of the tool!
Whiteboard with an SA: Amazon Virtual Private Cloud
How should you design your first VPC? Amazon Virtual Private Cloud (VPC for short) lets you provision an isolated section of the cloud to run your AWS resources in a network you control. When planning your VPC network design, there are several design considerations to explore.
In this video, Warren Santner, AWS Solutions Architect (SA), shows you how to plan and deploy your VPC to have complete control over your virtual networking environment, including selection of your own IP address range, creation of subnets, and configuration of route tables and network gateways. He will walk you through several design patterns taking into account these three criteria:
- Who are your users?
- What systems are accessing your resources?
- Where are they accessing these resources?
Watch this whiteboarding video to learn how to design your first VPC.
Continue to whiteboard with our AWS Worldwide Public Sector Solutions Architects for step-by-step instructions and demos on topics important to you in our YouTube Channel. Have a question about cloud computing? Our public sector Solutions Architects are here to help! Send us your question at aws-wwps-blog@amazon.com.
Ecosia: Planting Trees, One Search at a Time
Ecosia, a social business based in Berlin, Germany, is the search engine that plants trees. They donate $100,000 or 80% of their monthly profits from ad revenue to nonprofit conservationist organizations every month, with a focus on tree planting. Since they launched in December of 2009, they are close to hitting the “5 million trees planted” milestone and have a goal of doubling their users by year end.
How it works
By reaching users where they are and with no financial asks, Ecosia offers a search engine with social good in mind. They invest money generated from advertising into planting trees in Burkina Faso, Madagascar, and Peru. All the user has to do is use the search engine and for every ad click, they donate money towards planting trees. After plug-in installation into the browser, every user sees the progress of planted trees in their browser in the upper right corner.

The tech behind the trees
In 2013, Ecosia turned to AWS to host their website and search engine on Amazon CloudFront, Amazon Elastic Compute Cloud (Amazon EC2), Amazon Route 53, and Amazon Simple Storage Service (Amazon S3).
Prior to moving to AWS, Ecosia was hosting its applications on dedicated servers with traditional hosting companies. “We needed a service that provided us with excellent options for scalability. As our traffic started to increase, we quickly realized that using dedicated hosting would not scale. We could not react quickly enough to spikes in traffic and were delivering sub-optimal performance during peak hours,” said Gregory McCue, Chief Technology Officer at Ecosia. “We wanted to see exactly how much we were spending to serve our website, and have the ability to utilize only the capacity we needed.”
Ecosia has 2.5 million active users a month, and is trying to reach 5 million active users. They reach upwards of 720,000 search requests a day and are able to fund planting a new tree every 10-12 seconds.
“AWS is at the core of the business; without AWS, we wouldn’t have any product to offer our users. The fact that everything runs smoothly allows us to deliver a well performing product to our user,” said Jacey Binger, Head of PR at Ecosia.
For nonprofits dedicated to helping the world, cost and scalability matters. Since they are donating 80% of their profits to planting trees, being frugal is important to their bottom line. Learn more how organizations need technology that help them achieve their mission without wasting precious resources.

Counting young trees in the second year – Credit Beeldkas and OZG

Dead trees in the desert in Burkina Faso – Credit WeForest
AWS Public Sector Month in Review – August

Here is the first edition of the AWS Public Sector Month in Review. Each month we will be curating all of the content published for the education, government, and nonprofit communities including blogs, white papers, webinars, and more.
Let’s take a look at what happened in August:
All – Government, Education, & Nonprofits
- 2016 GovLoop Guide – Government and the Internet of Things: Your Questions Answered
- Cloud Adoption Maturity Model: Guidelines to Develop Effective Strategies for Your Cloud Adoption Journey
- Building a Microsoft BackOffice Server Solution on AWS with AWS CloudFormation
- Exploring the Possibilities of Earth Observation Data
- California Apps for Ag Hackathon: Solving Agricultural Challenges with IoT
Education
Government
- Jeff Bezos Joins Defense Secretary Ash Carter’s New Defense Innovation Advisory Board
- Acquia, an APN Technology Partner, Leverages AWS to Achieve FedRAMP Compliance
- Ransomware Fightback Takes to the Cloud
- City on a Cloud Innovation Challenge: Partners in Innovation and Cloud Innovation Leadership Award Winners
Nonprofits
New Customer Success Stories
Latest YouTube Videos
Whiteboard with our AWS Worldwide Public Sector Solutions Architects for step-by-step instructions and demos on topics important to you. Have a question about cloud computing? Our public sector SAs are here to help! Send us your question at aws-wwps-blog@amazon.com.
- AWS SA Whiteboarding | Amazon Virtual Private Cloud (VPC)
- AWS Q&A with an SA: | How should I design my first VPC?
- AWS SA Whiteboarding | AWS Direct Connect
- AWS SA Whiteboarding | Tagging Demo
- AWS Q&A with an SA: | What are tags and what can I do with them?
- AWS SA Whiteboarding | AWS Code Deployment
- AWS Q&A with an SA | How do I easily deploy my code on AWS?
Recent Webinars
- Geospatial Analytics in the Cloud with ENVI and Amazon Web Services
- FedRAMP High & AWS GovCloud(US): Meet FISMA High Requirements
- Running Microsoft Workloads in the AWS Cloud
Upcoming Events
Attend one of our upcoming events and meet with AWS experts to get all of your questions answered. Register for one of the events below:
- September 12- 13 – Massachusetts Digital Summit – Boston, MA
- September 12-14 – LWDA – Potsdam
- September 12 -14 – EO Open Science – Frascati, Italy
- September 13- 14 – UK Defence Symposium – London
- September 16-17 – New York Digital Summit – New York, NY
- September 17-21 – NASCIO Annual Conference – Orlando, FL
- September 18-21 – ISM for Human Services – Phoenix, AZ
- September 19 – AWS Agriculture Analysis in the Cloud Day at The Ohio State University – Columbus, OH
- September 19-20 – SC CJIS Users Conference – Myrtle Beach, SC
- September 20- 21 – DonorPerfect Conference – Philadelphia, PA
- September 22 – AWS Summit – Rio de Janeiro
- September 28 – AWS Summit – Lima
- September 29 – Tech & Tequila MeetUp: Tapping into Tech Hubs – Arlington, VA
Keep checking back with us. But in the meantime, are you following us on social media? Follow along to stay up to the date with all of the real-time AWS news for government and education.
MalariaSpot: Diagnose Diseases with Video Games

More than one billion people in the world entertain themselves with apps and video games. Only a hobby? For Miguel Luengo Oroz, the answer is no. Miguel and his team from the Technical University of Madrid (UPM) have resolved to use the collective intelligence of players from around the world to help diagnose diseases that kill thousands of people every day.
Parasites rather than spaceships
The idea originated in 2012. “While I was working for the United Nations in global health challenges, it caught my attention how tough and manual the process of diagnosing malaria was,” explains Miguel. “It can take up to 30 minutes to identify and count the parasites in a blood sample that cause the disease. There are not enough specialists in the world to diagnose all the cases!”
Miguel, a great fan of videogames had an idea: “Why not create a video game in which rather than shooting spaceships we search for parasites?” And MalariaSpot was born, a game available for computer and mobiles in which the “malaria hunter” has one minute to detect the parasites in a real, digitalized blood sample.
Since its launch, more than 100,000 people in 100 countries have “hunted” one and a half million parasites, and the results are promising. The number of clicks made by many players in the same image sample combined by artificial intelligence shows a count as precise as the one of an expert, but quicker.
“We published a study that probed that the collective diagnosis by the use of a videogame is not a crazy thing, but now it needs to be assessed from a medical point of view,” explains Miguel. His team cooperates with a clinic in Mozambique and has done some tests in real time and has achieved the first collaborative remote diagnosis of malaria from Africa.
The technology platform to host the game was the key. “We needed a flexible infrastructure that worked from anywhere in the world. We usually have traffic spikes when we appear in media or when we do campaigns in social networks, and we saw that Amazon Web Services (AWS) offered a good solution for auto scaling based on demand,” Miguel said.
Miguel and his team use the AWS Research Grants program that allows students, teachers, and researchers to transfer their activities to the cloud and innovate rapidly at a low cost. “We can now test different services without having to worry about the bill,” explains Miguel.
From the White House to neighborhood schools
The MalariaSpot project has attracted the recognition of entities such as the Singularity University of NASA, the Office of Science and Technology of the White House, and the Massachusetts Institute of Technology (MIT), which has named Miguel one of the ten Spaniards under 35 with potential to change the world through technology.
But one of the greatest rewards for Miguel and his team comes from much closer to home. They enjoy visiting schools all over Spain and helping awaken unsuspected scientific vocations. “Today’s kids are digital natives. They are used to seeing and analyzing complex images on a screen,” says Miguel. This shows the educational value and awareness of videogames. During the last World Malaria Day on April 25th, thousands of Spanish students participated in “Olympic malaria video games,” playing the new game MalariaSpot Bubbles. School teams competed to become the best virtual hunters of malaria parasites.
“With MalariaSpot, we have even be able to reach kids who were not very good at biology. In a workshop that we ran in a school last year, the kid who won was the worst troublemaker out of his whole class,” explains Miguel (with a smile).
The future of medical diagnosis is not only defined in laboratories. “We are at a turning point where technology allows ubiquitous connectivity. We, and the rest of our generation, are responsible to direct all the possibilities that technology offers us to initiatives that make a real impact on the lives of people. And what better than health.”
With MalariaSpot and her “younger sister,” TuberSpot, Miguel and his young team of researchers are contributing so that in five years, 5% of video games are used to analyze medical images. Their objective? “Achieve a low cost diagnosis of global diseases, accessible to any person anywhere around the planet.”
Ransomware Fightback Takes to the Cloud
Guest post by Raj Samani, EMEA CTO Intel Security (@Raj_Samani)

“How many visitors do you expect to access the No More Ransom Portal?”
This was the simple question asked prior to this law enforcement (Europol’s European Cybercrime Centre, Dutch Police) and private industry (Kaspersky Lab, Intel Security) portal going live, which I didn’t have a clue how to answer. What do YOU think? How many people do you expect to access a website dedicated to fighting ransomware?
If you said 2.6 million visitors in the first 24 hours, then please let me know six numbers you expect to come up in the lottery this weekend (I will spend time until the numbers are drawn to select the interior of my new super yacht). I have been a long-time advocate of cloud technology, and its benefit of rapid scalability came to the rescue when our visitor numbers blew expected numbers out of the water. To be honest, if we had attempted to host this site internally, my capacity estimates would have resulted in the portal crashing within the first hour of operation. That would have been embarrassing and entirely my fault.
Indeed my thoughts on the use of cloud computing technology are well documented in various blogs, my work within the Cloud Security Alliance, and the book I recently co-authored. I have often used the phrase, “Cloud computing in the future will keep our lights on and water clean.” The introduction of Amazon Web Services (AWS) and the AWS Marketplace into the No More Ransom Initiative to host the online portal demonstrates that the old myth, “one should only use the cloud for non-critical services,” needs to be quickly archived into the annals of history.
To ensure such an important site was ready for the large influx of traffic at launch, we had around the clock support out of Australia and the U.S. (thank you, Ben Potter and Nathan Case from AWS!), which meant everything was running as it should and we could handle millions of visitors on our first day. This, in my opinion, is the biggest benefit of the cloud. Beyond scalability, and the benefits of outsourcing the management and the security of the portal to a third party, an added benefit was that my team and I could focus our time on developing tools to decrypt ransomware victims’ systems, conduct technical research, and engage law enforcement to target the infrastructure to make such keys available.
AWS also identified controls to reduce the risk of the site being compromised. With the help of Barracuda, they implemented these controls and regularly test the portal to reduce the likelihood of an issue.
Thank you, AWS and Barracuda, and welcome to the team! This open initiative is intended to provide a non-commercial platform to address a rising issue targeting our digital assets for criminal gain. We’re thrilled that we are now able to take the fight to the cloud.