Category: Amazon Elasticsearch Service
Amazon Elasticsearch Service support for Elasticsearch 5.1
The Amazon Elasticsearch Service is a fully managed service that provides easier deployment, operation, and scale for the Elasticsearch open-source search and analytics engine. We are excited to announce that Amazon Elasticsearch Service now supports Elasticsearch 5.1 and Kibana 5.1.
Elasticsearch 5 comes with a ton of new features and enhancements that customers can now take advantage of in Amazon Elasticsearch service. Elements of the Elasticsearch 5 release are as follow:
- Indexing performance: Improved Indexing throughput with updates to lock implementation & async translog fsyncing
- Ingestion Pipelines: Incoming data can be sent to a pipeline that applies a series of ingestion processors, allowing transformation to the exact data you want to have in your search index. There are twenty processors included, from simple appending to complex regex applications
- Painless scripting: Amazon Elasticsearch Service supports Painless, a new secure and performant scripting language for Elasticsearch 5. You can use scripting to change the precedence of search results, delete index fields by query, modify search results to return specific fields, and more.
- New data structures: Lucene 6 data structures, new data types; half_float, text, keyword, and more complete support for dots-in-fieldnames
- Search and Aggregations: Refactored search API, BM25 relevance calculations, Instant Aggregations, improvements to histogram aggregations & terms aggregations, and rewritten percolator & completion suggester
- User experience: Strict settings and body & query string parameter validation, index management improvement, default deprecation logging, new shard allocation API, and new indices efficiency pattern for rollover & shrink APIs
- Java REST client: simple HTTP/REST Java client that works with Java 7 and handles retry on node failure, as well as, round-robin, sniffing, and logging of requests
- Other improvements: Lazy unicast hosts DNS lookup, automatic parallel tasking of reindex, update-by-query, delete-by-query, and search cancellation by task management API
The compelling new enhancements of Elasticsearch 5 are meant to make the service faster and easier to use while providing better security. Amazon Elasticsearch Service is a managed service designed to aid customers in building, developing and deploying solutions with Elasticsearch by providing the following capabilities:
- Multiple configurations of instance types
- Amazon EBS volumes for data storage
- Cluster stability improvement with dedicated master nodes
- Zone awareness – Cluster node allocation across two Availability Zones in the region
- Access Control & Security with AWS Identity and Access Management (IAM)
- Various geographical locations/regions for resources
- Amazon Elasticsearch domain snapshots for replication, backup and restore
- Integration with Amazon CloudWatch for monitoring Amazon Elasticsearch domain metrics
- Integration with AWS CloudTrail for configuration auditing
- Integration with other AWS Services like Kinesis Firehose and DynamoDB for loading of real-time streaming data into Amazon Elasticsearch Service
Amazon Elasticsearch Service allows dynamic changes with zero downtime. You can add instances, remove instances, change instance sizes, change storage configuration, and make other changes dynamically.
The best way to highlight some of the aforementioned capabilities is with an example.
During a presentation at the IT/Dev conference, I demonstrated how to build a serverless employee onboarding system using Express.js, AWS Lambda, Amazon DynamoDB, and Amazon S3. In the demo, the information collected was personnel data stored in DynamoDB about an employee going through a fictional onboarding process. Imagine if the collected employee data could be searched, queried, and analyzed as needed by the company’s HR department. We can easily augment the onboarding system to add these capabilities by enabling the employee table to use DynamoDB Streams to trigger Lambda and store the desired employee attributes in Amazon Elasticsearch Service.
The result is the following solution architecture:
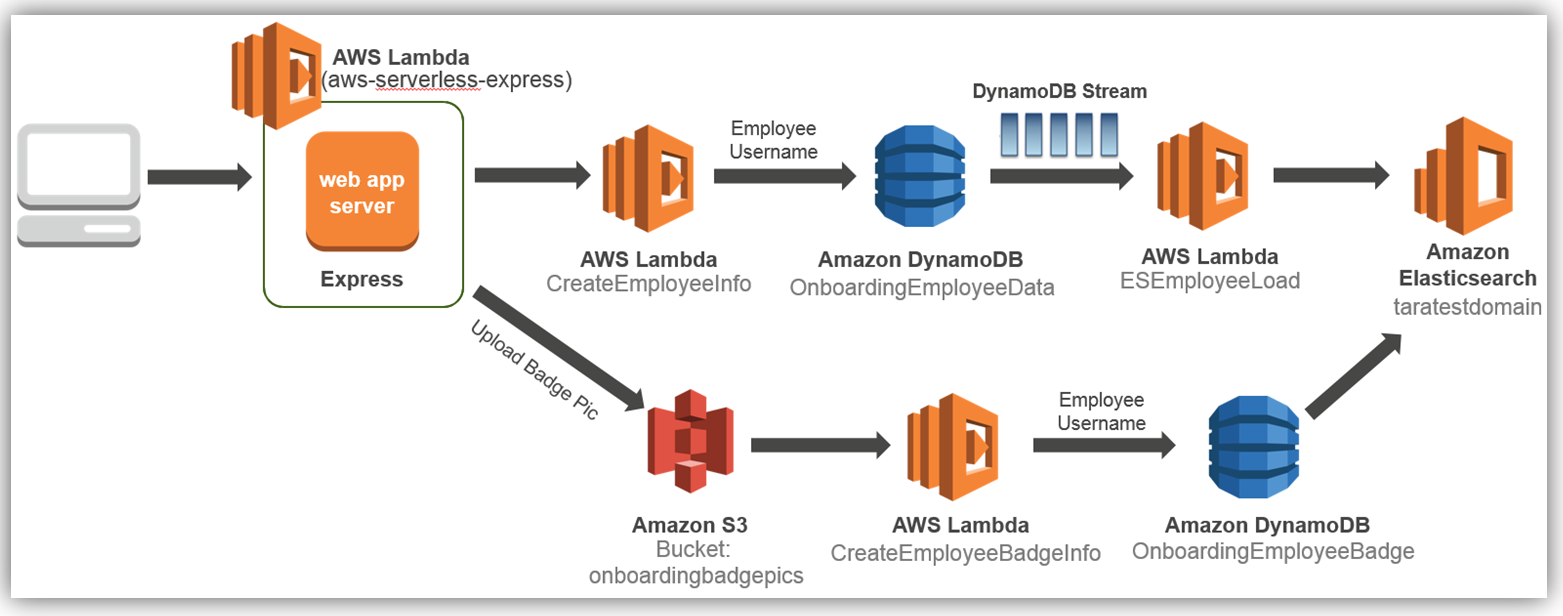
We will focus solely on how to dynamically store and index employee data to Amazon Elasticseach Service each time an employee record is entered and subsequently stored in the database.
To add this enhancement to the existing aforementioned onboarding solution, we will implement the solution as noted by the detailed cloud architecture diagram below:
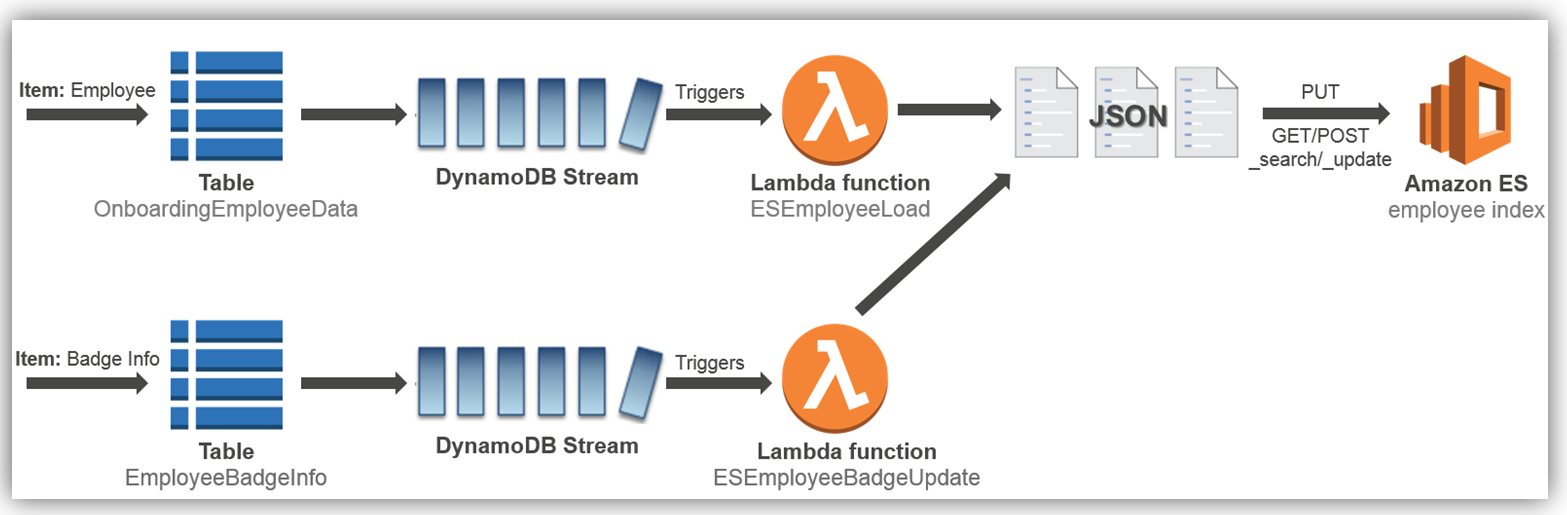
Let’s look at how to implement the employee load process to the Amazon Elasticsearch Service, which is the first process flow shown in the diagram above.
Amazon Elasticsearch Service: Domain Creation
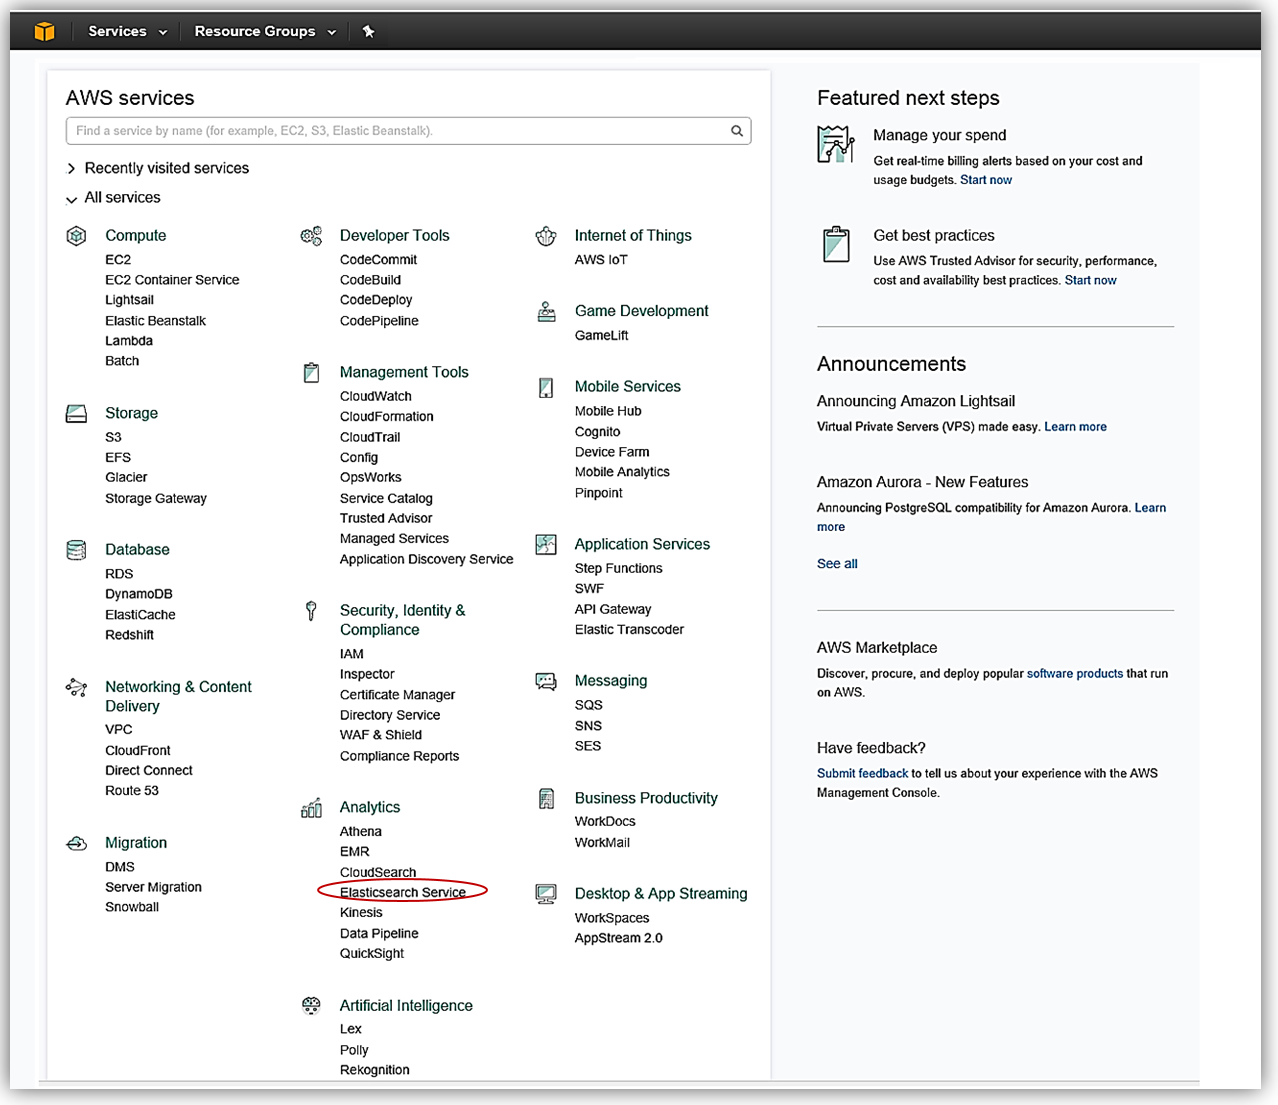
Let’s now visit the AWS Console to check out Amazon Elasticsearch Service with Elasticsearch 5 in action. As you probably guessed, from the AWS Console home, we select Elasticsearch Service under the Analytics group.
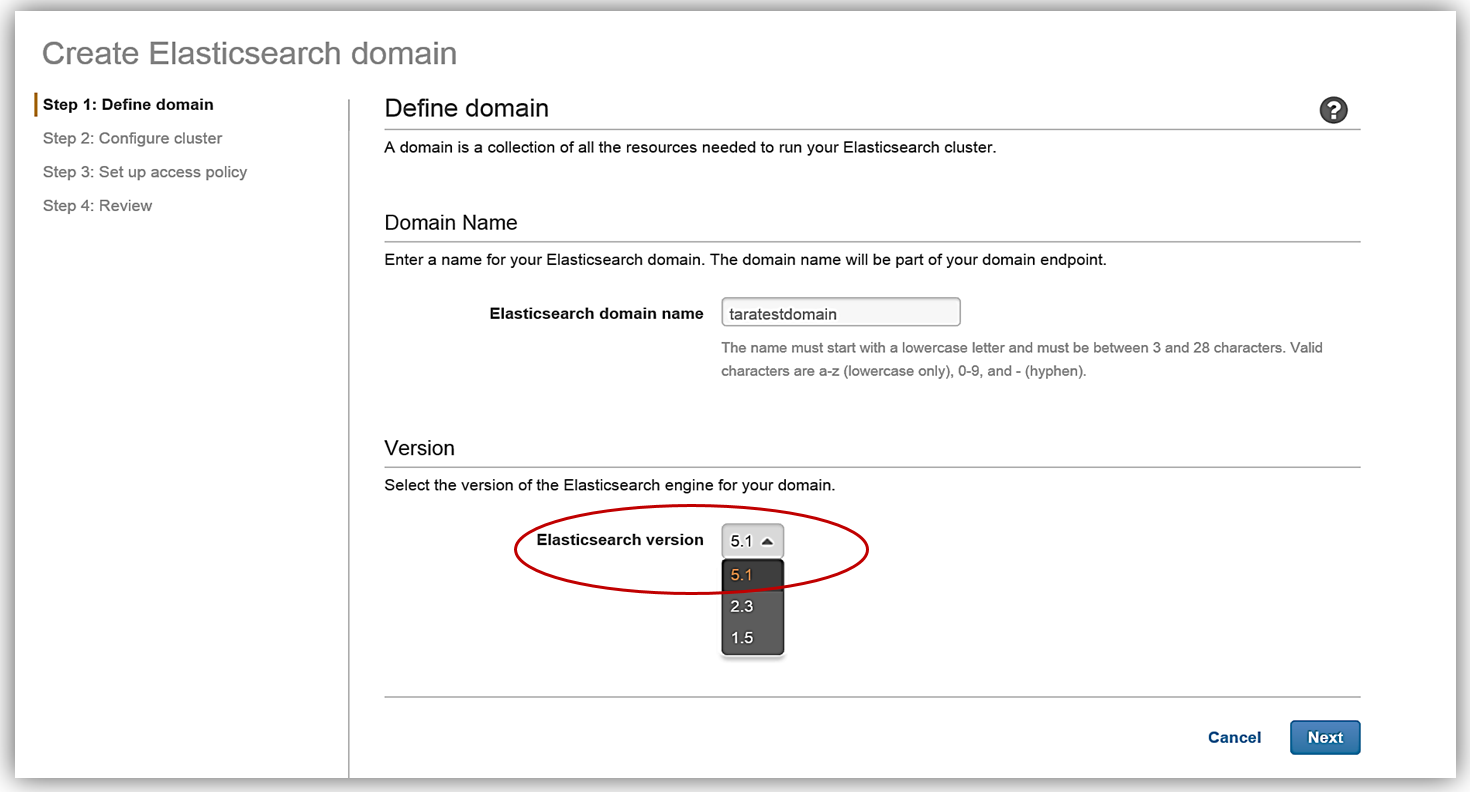
The first step in creating an Elasticsearch solution is to create a domain. You will notice that now when creating an Amazon Elasticsearch Service domain, you now have the option to choose the Elasticsearch 5.1 version. Since we are discussing the launch of the support of Elasticsearch 5, we will, of course, choose the 5.1 Elasticsearch engine version when creating our domain in the Amazon Elasticsearch Service.
After clicking Next, we will now setup our Elasticsearch domain by configuring our instance and storage settings. The instance type and the number of instances for your cluster should be determined based upon your application’s availability, network volume, and data needs. A recommended best practice is to choose two or more instances in order to avoid possible data inconsistencies or split brain failure conditions with Elasticsearch. Therefore, I will choose two instances/data nodes for my cluster and set up EBS as my storage device.
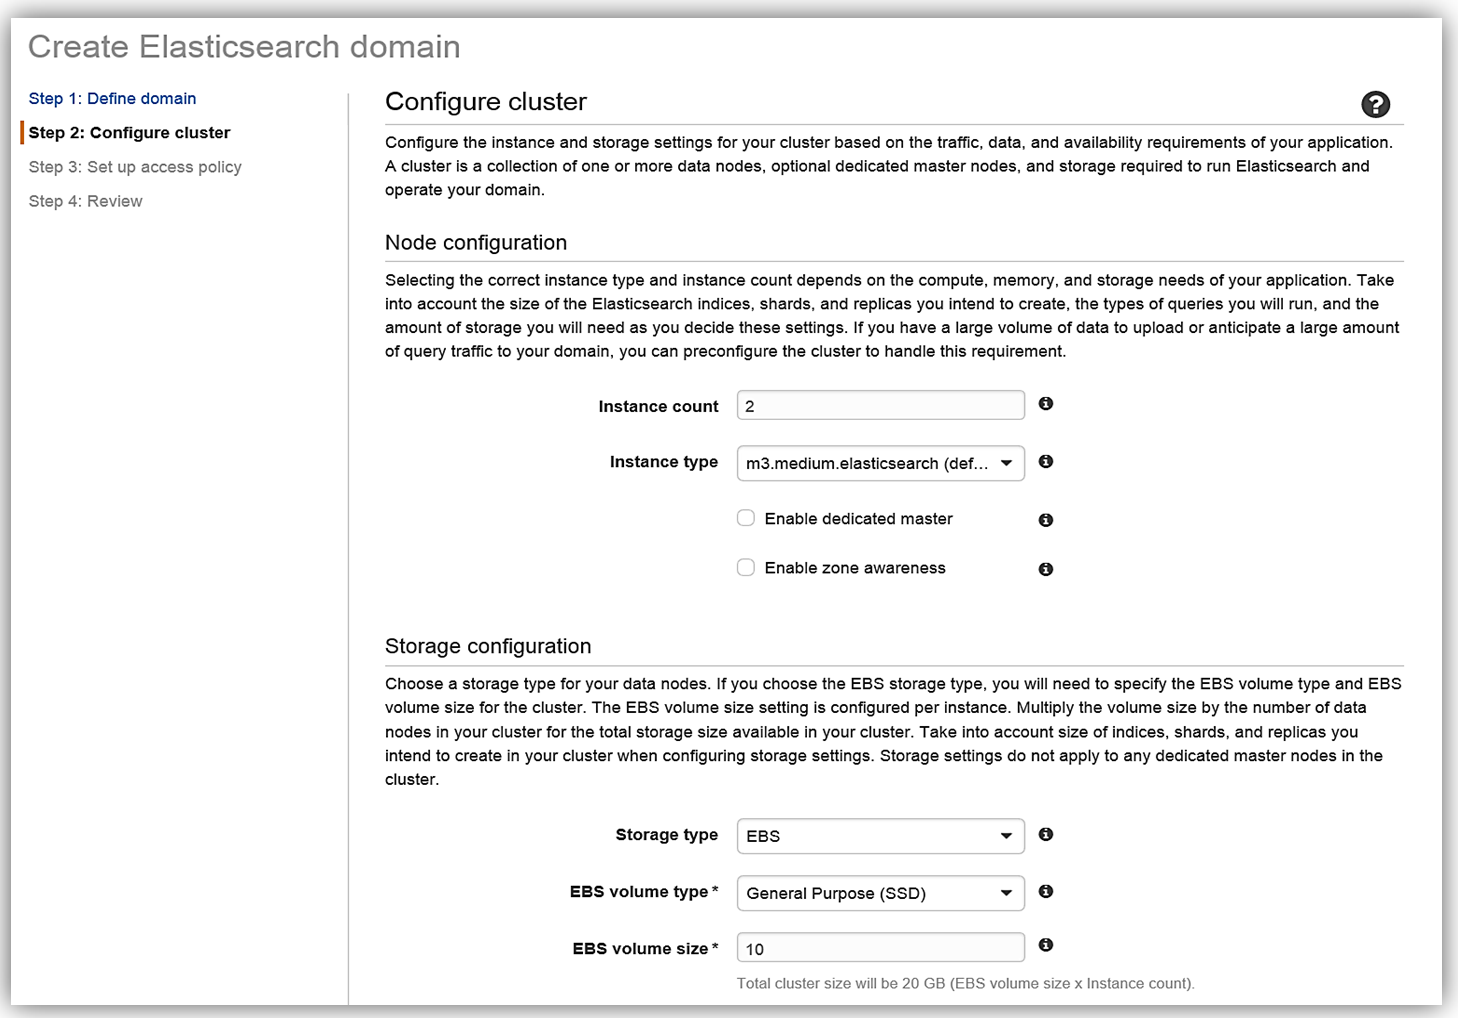
To understand how many instances you will need for your specific application, please review the blog post, Get Started with Amazon Elasticsearch Service: How Many Data Instances Do I Need, on the AWS Database blog.
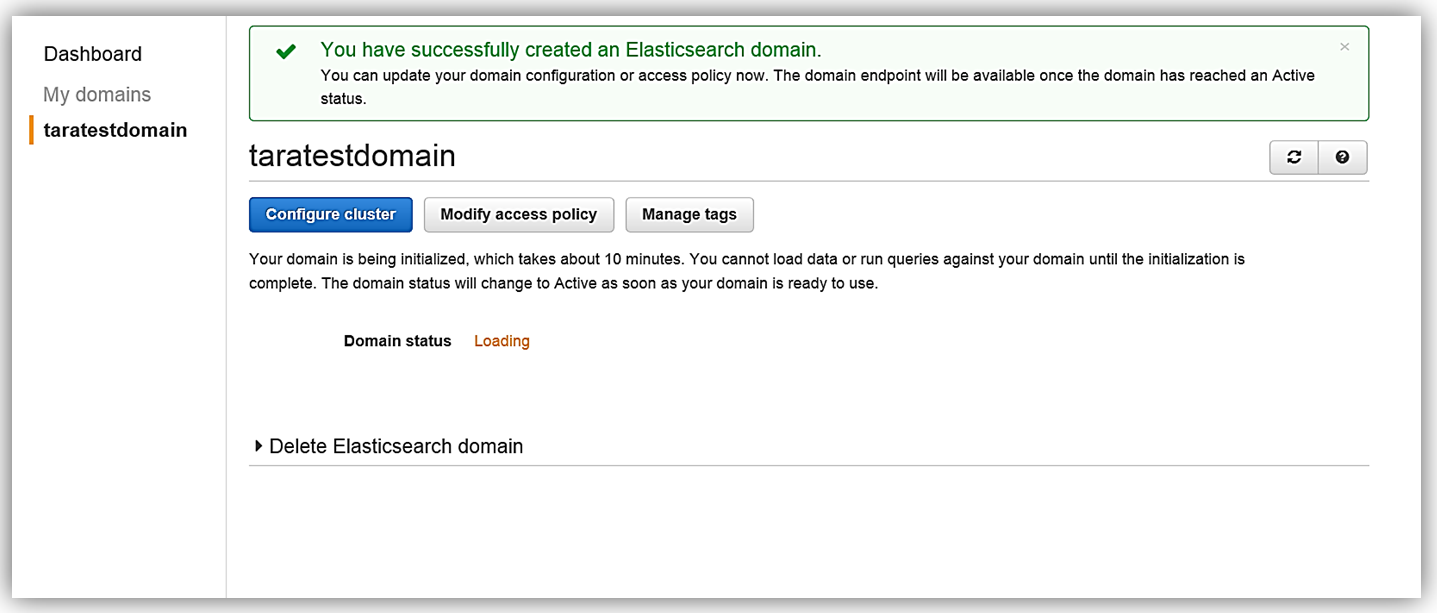
All that is left for me is to set up the access policy and deploy the service. Once I create my service, the domain will be initialized and deployed.
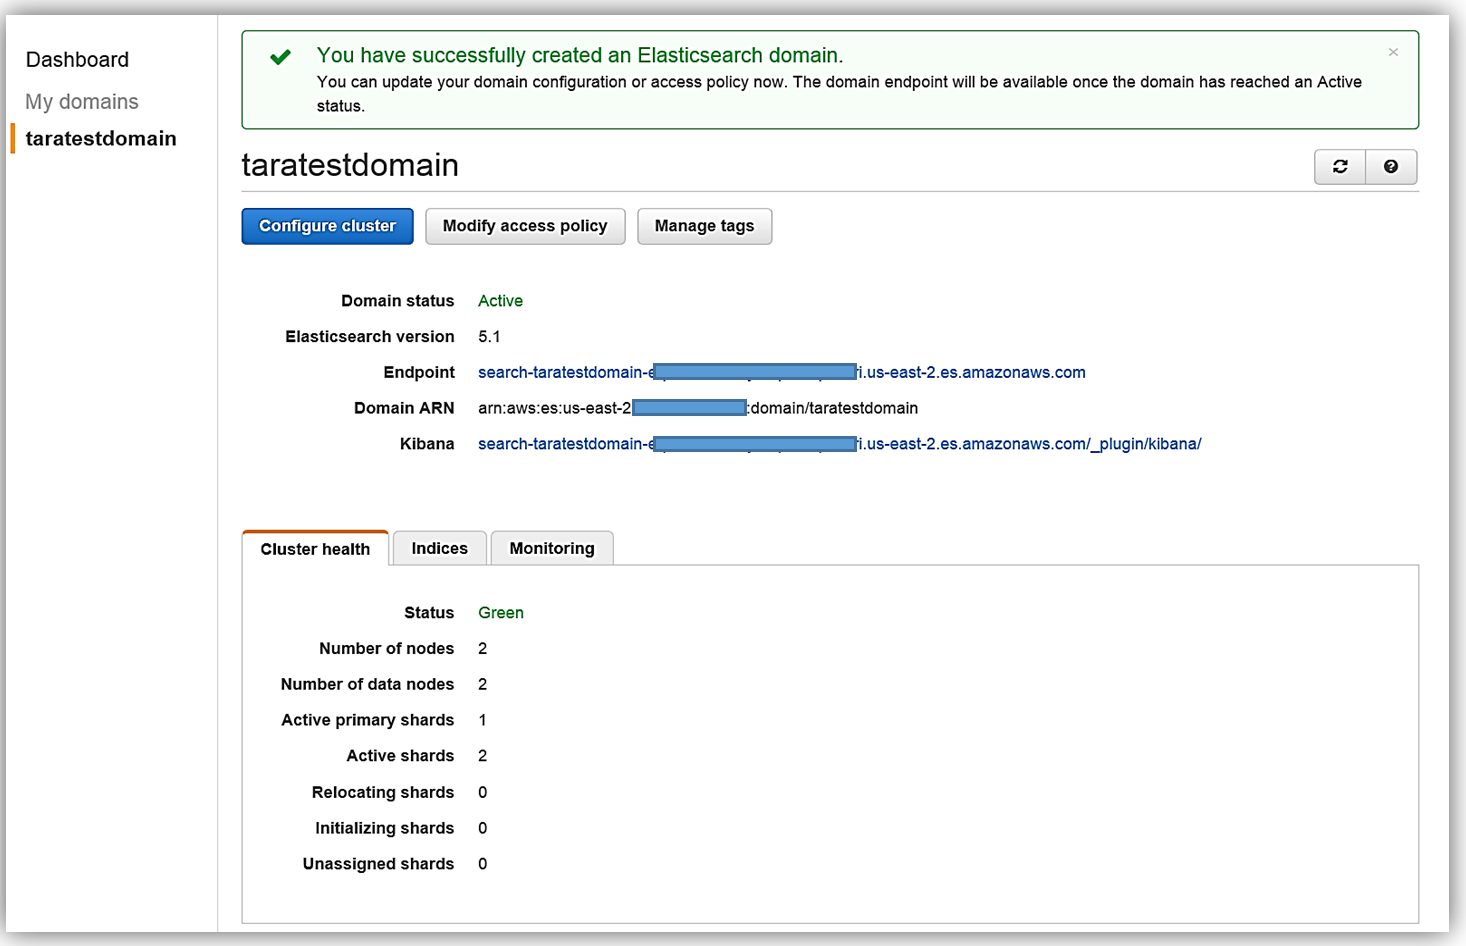
Now that I have my Elasticsearch service running, I now need a mechanism to populate it with data. I will implement a dynamic data load process of the employee data to Amazon Elasticsearch Service using DynamoDB Streams.
Amazon DynamoDB: Table and Streams
Before I head to the DynamoDB console, I will quickly cover the basics.
Amazon DynamoDB is a scalable, distributed NoSQL database service. DynamoDB Streams provide an ordered, time-based sequence of every CRUD operation to the items in a DynamoDB table. Each stream record has information about the primary attribute modification for an individual item in the table. Streams execute asynchronously and can write stream records in practically real time. Additionally, a stream can be enabled when a table is created or can be enabled and modified on an existing table. You can learn more about DynamoDB Streams in the DynamoDB developer guide.
Now we will head to the DynamoDB console and view the OnboardingEmployeeData table.
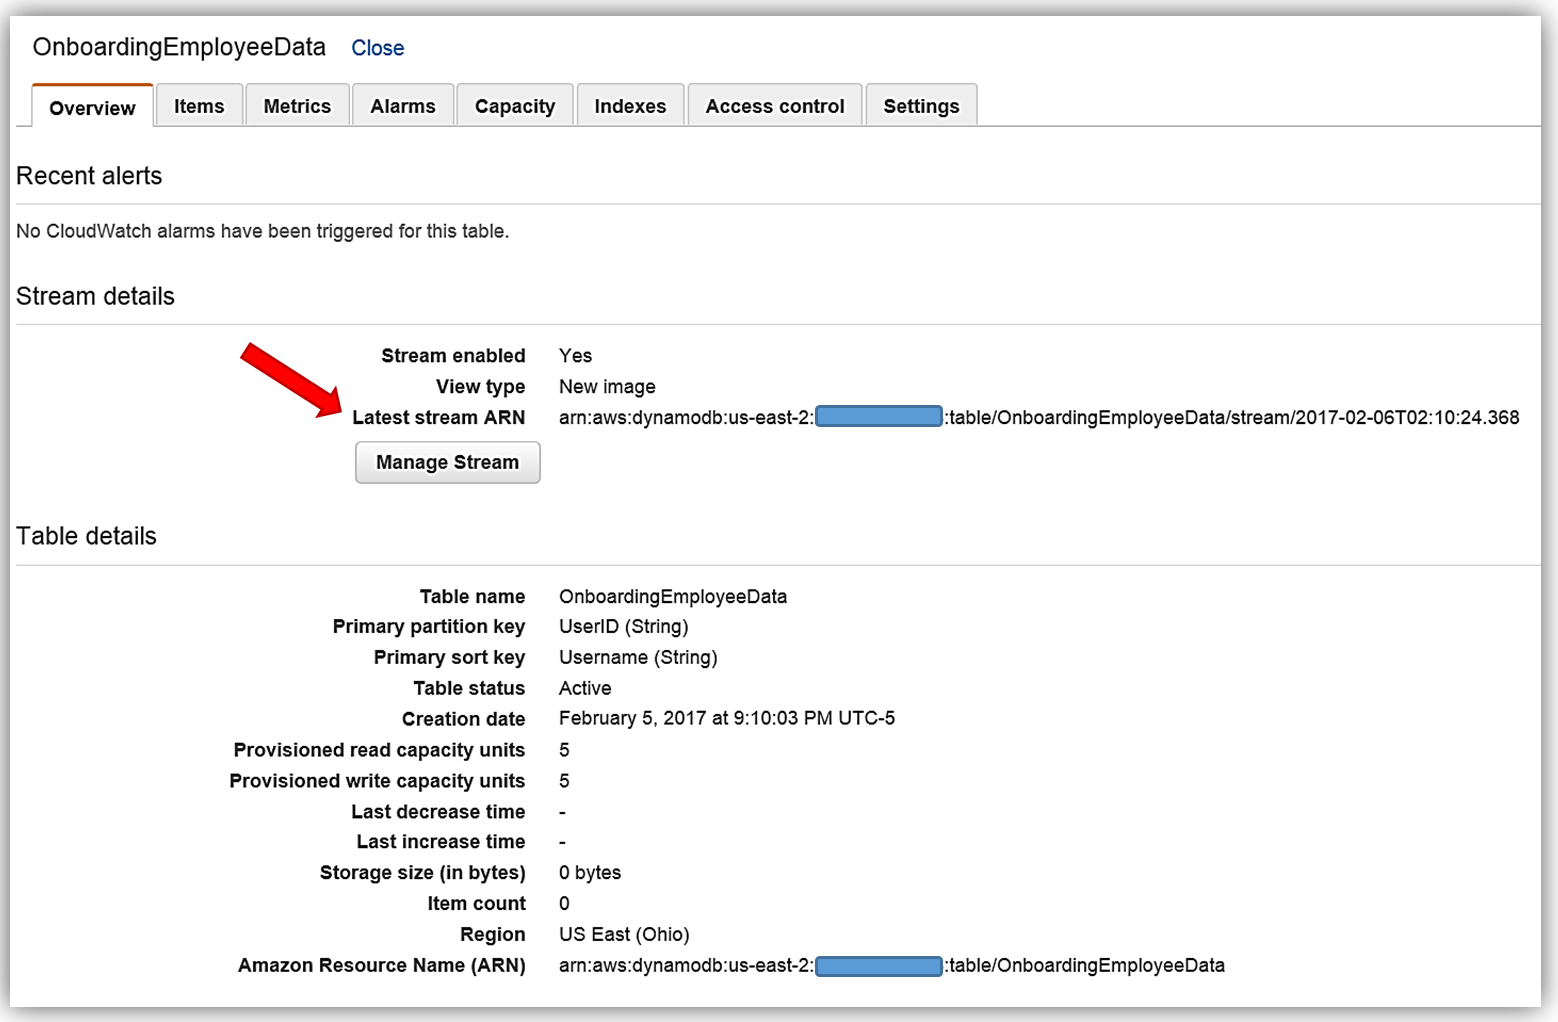
This table has a primary partition key, UserID, that is a string data type and a primary sort key, Username, which is also of a string data type. We will use the UserID as the document ID in Elasticsearch. You will also notice that on this table, streams are enabled and the stream view type is New image. A stream that is set to a New image view type will have stream records that display the entire item record after it has been updated. You also have the option to have the stream present records that provide data items before modification, provide only the items’ key attributes, or provide old and new item information. If you opt to use the AWS CLI to create your DynamoDB table, the key information to capture is the Latest Stream ARN shown underneath the Stream Details section. A DynamoDB stream has a unique ARN identifier that is outside of the ARN of the DynamoDB table. The stream ARN will be needed to create the IAM policy for access permissions between the stream and the Lambda function.

IAM Policy
The first thing that is essential for any service implementation is getting the correct permissions in place. Therefore, I will first go to the IAM console to create a role and a policy for my Lambda function that will provide permissions for DynamoDB and Elasticsearch.
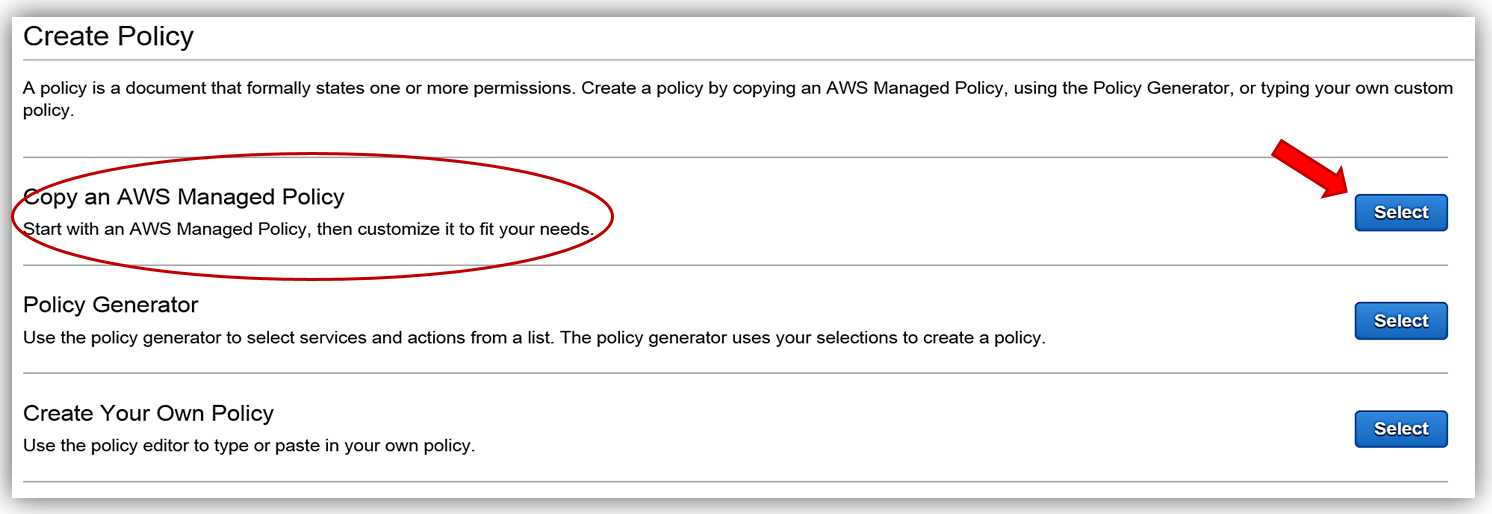
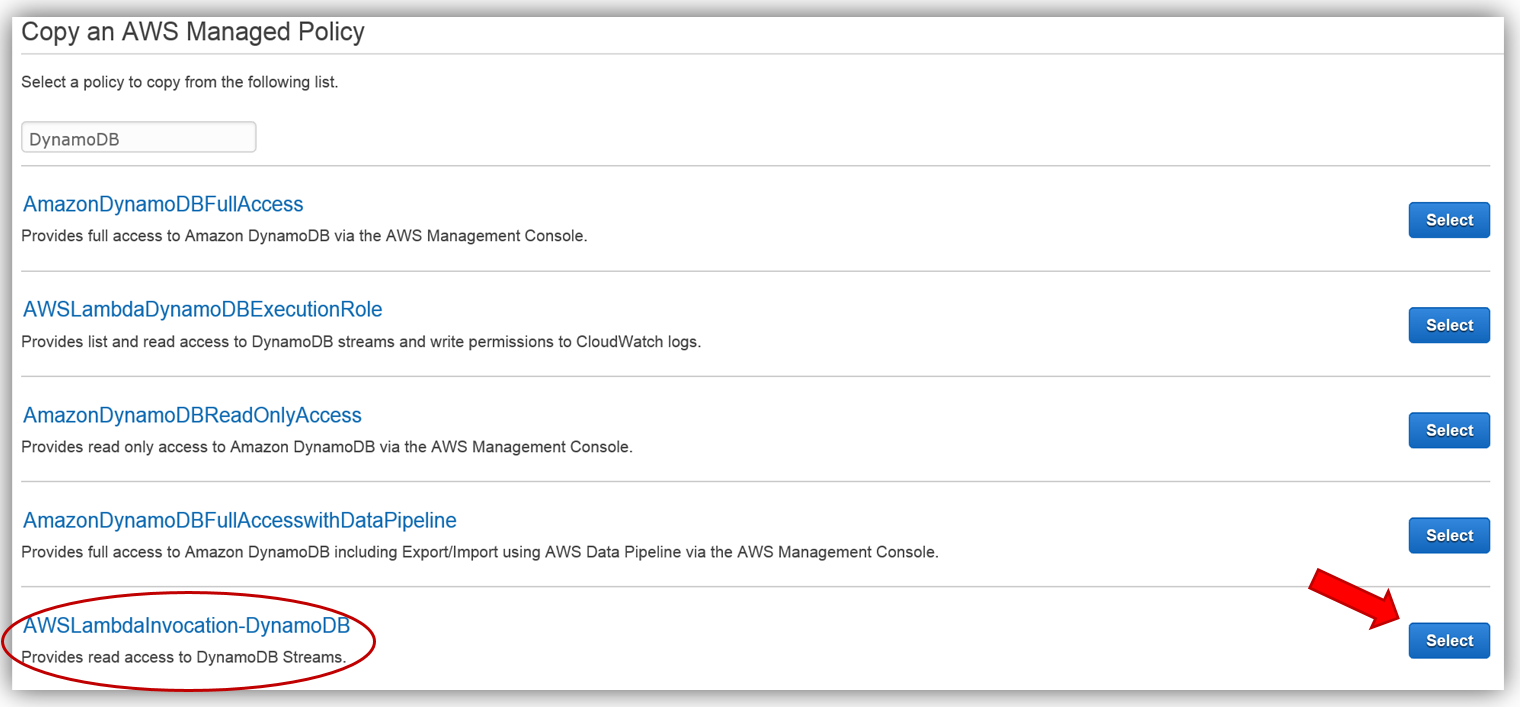
First, I will create a policy based upon an existing managed policy for Lambda execution with DynamoDB Streams.
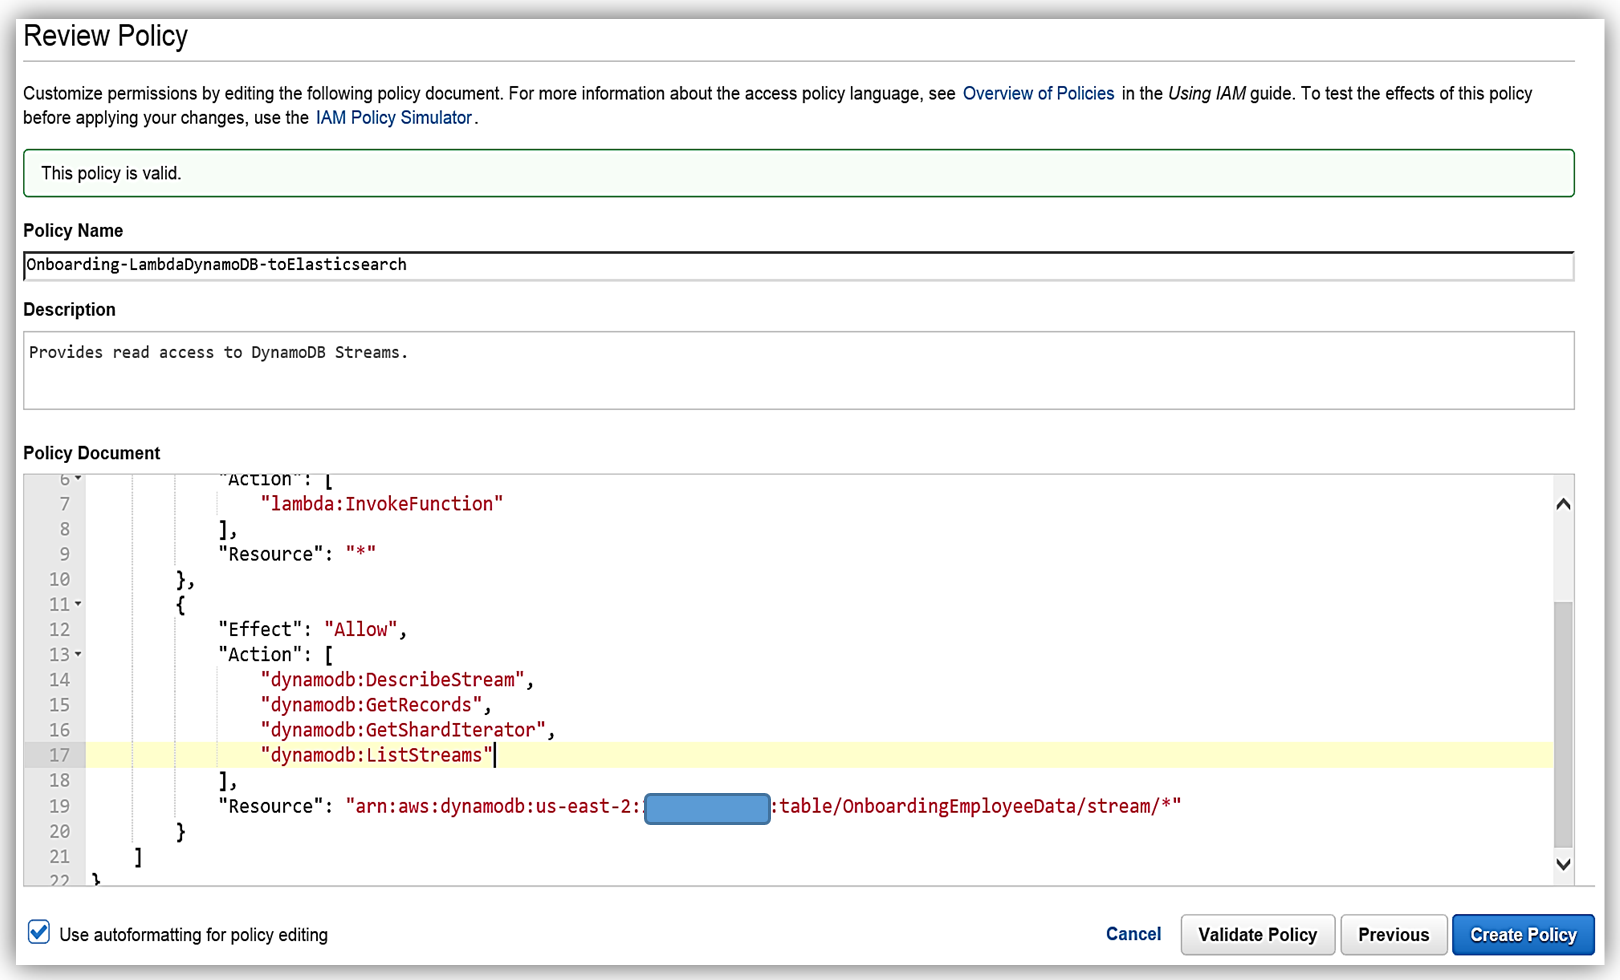
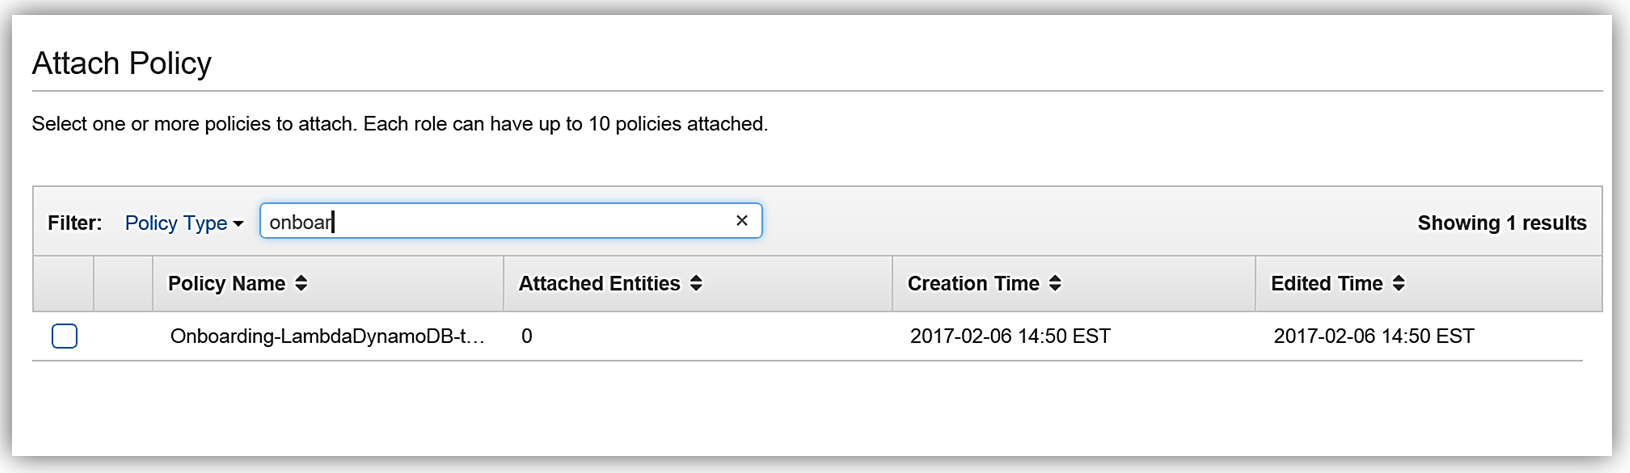
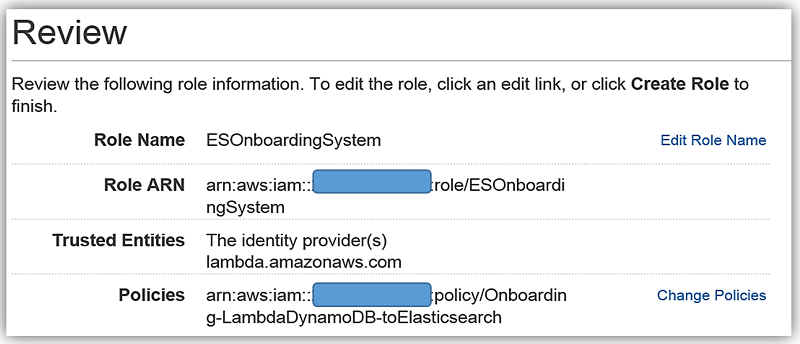
This will take us to the Review Policy screen, which will have the selected managed policy details. I’ll name this policy, Onboarding-LambdaDynamoDB-toElasticsearch, and then customize the policy for my solution. The first thing you should notice is that the current policy allows access to all streams, however, the best practice would be to have this policy only access the specific DynamoDB Stream by adding the Latest Stream ARN. Hence, I will alter the policy and add the ARN for the DynamoDB table, OnboardingEmployeeData, and validate the policy. The altered policy is as shown below.
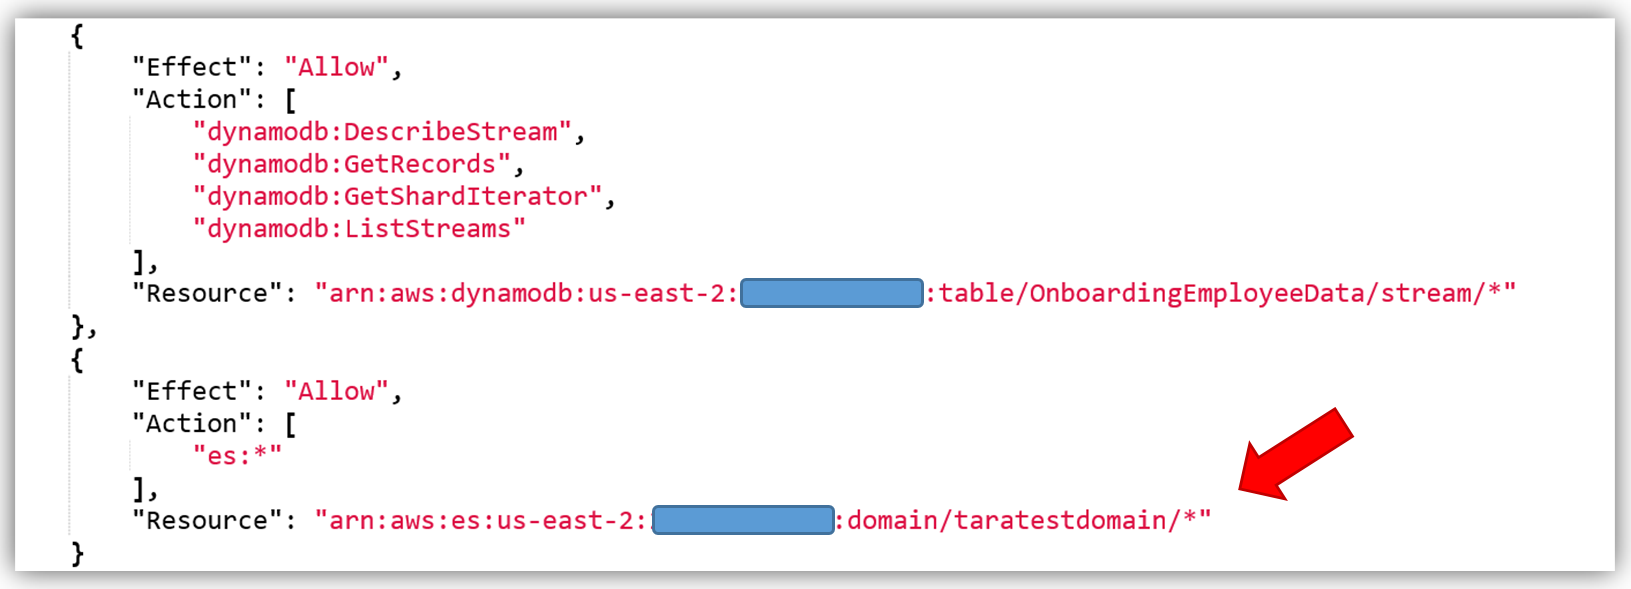
The only thing left is to add the Amazon Elasticsearch Service permissions in the policy. The core policy for Amazon Elasticsearch Service access permissions is as shown below:
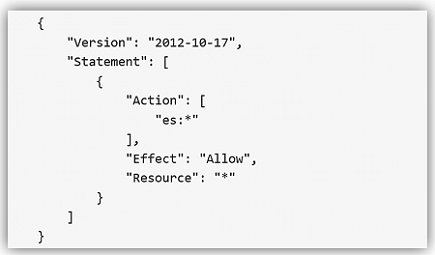
I will use this policy and add the specific Elasticsearch domain ARN as the Resource for the policy. This ensures that I have a policy that enforces the Least Privilege security best practice for policies. With the Amazon Elasticsearch Service domain added as shown, I can validate and save the policy.
The best way to create a custom policy is to use the IAM Policy Simulator or view the examples of the AWS service permissions from the service documentation. You can also find some examples of policies for a subset of AWS Services here. Remember you should only add the ES permissions that are needed using the Least Privilege security best practice, the policy shown above is used only as an example.
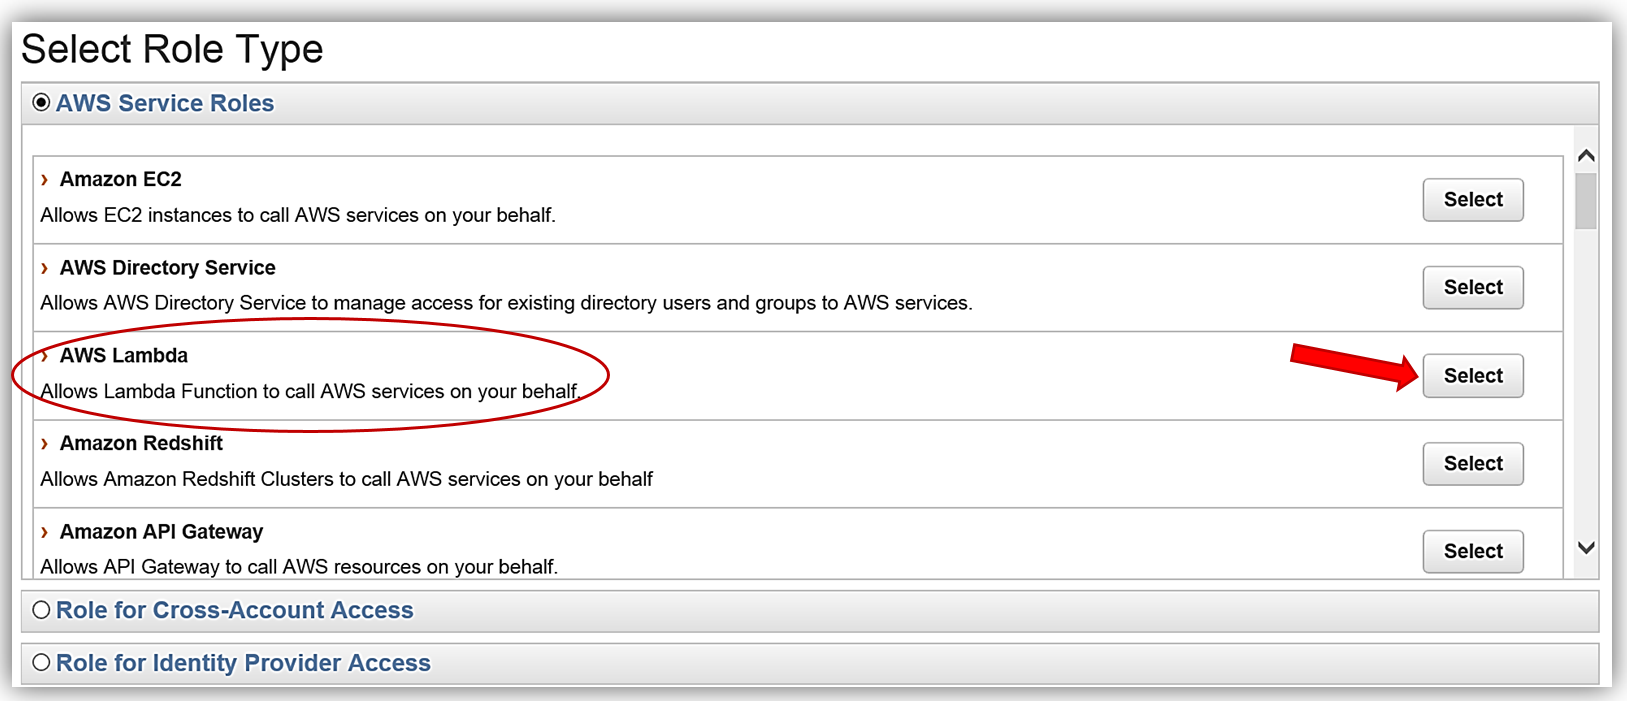
We will create the role for our Lambda function to use to grant access and attach the aforementioned policy to the role.
AWS Lambda: DynamoDB triggered Lambda function
AWS Lambda is the core of Amazon Web Services serverless computing offering. With Lambda, you can write and run code using supported languages for almost any type of application or backend service. Lambda will trigger your code in response to events from AWS services or from HTTP requests. Lambda will dynamically scale based upon workload and you only pay for your code execution.
We will have DynamoDB streams trigger a Lambda function that will create an index and send data to Elasticsearch. Another option for this is to use the Logstash plugin for DynamoDB. However, since several of the Logstash processors are now included in Elasticsearch 5.1 core and with the improved performance optimizations, I will opt to use Lambda to process my DynamoDB stream and load data to Amazon Elasticsearch Service.
Now let us head over to the AWS Lambda console and create the lambda function for loading employee data to Amazon Elasticsearch Service.
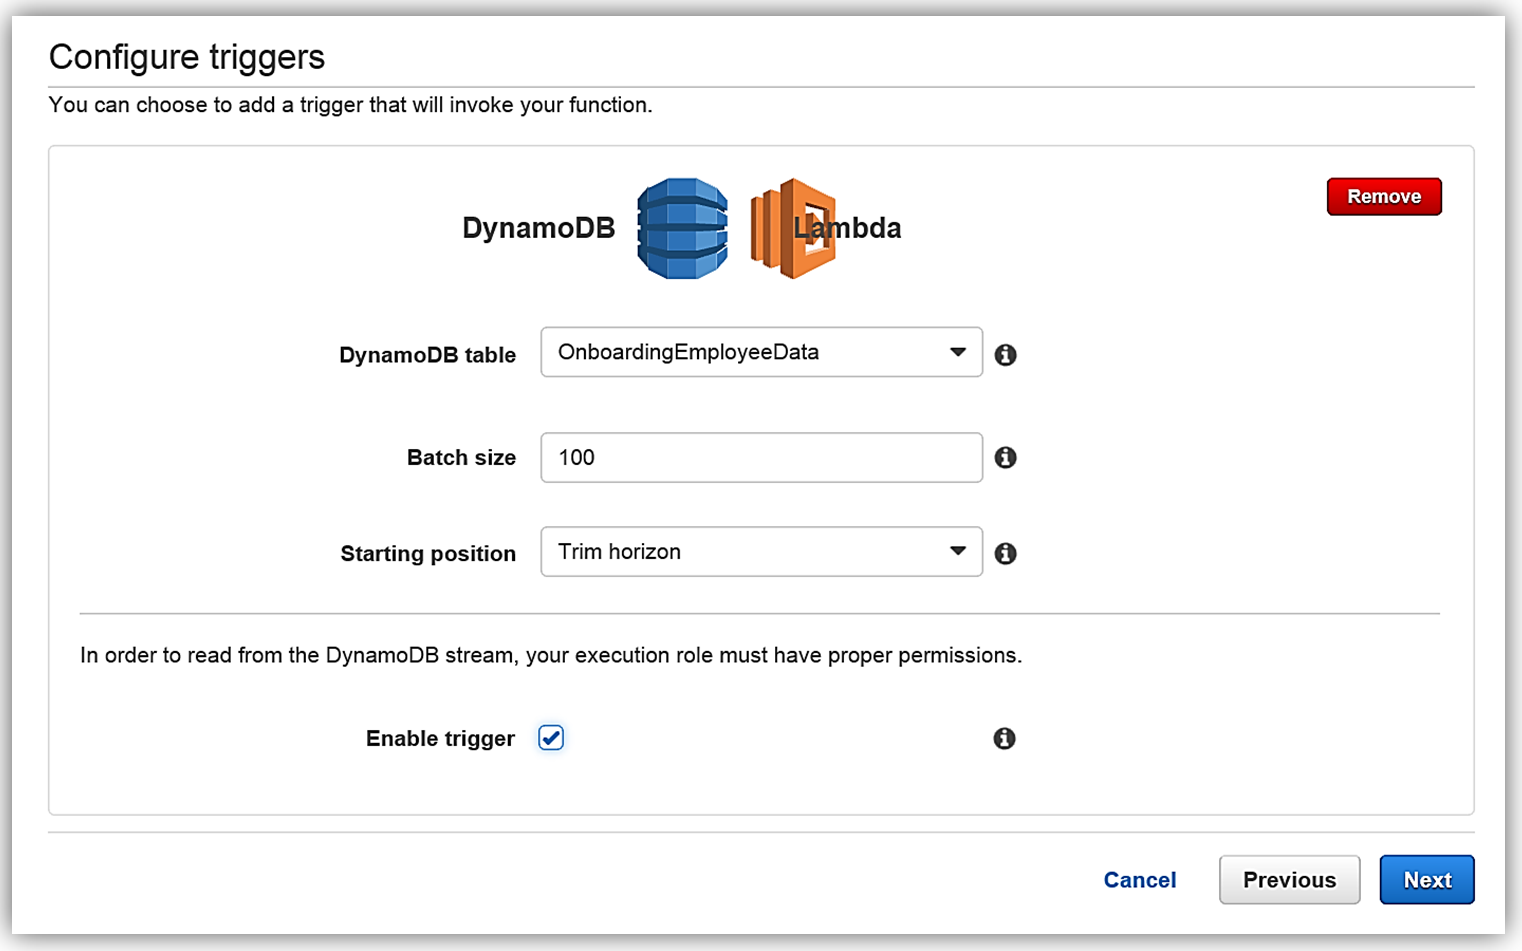
Once in the console, I will create a new Lambda function by selecting the Blank Function blueprint that will take me to the Configure Trigger page. Once on the trigger page, I will select DynamoDB as the AWS service which will trigger Lambda, and I provide the following trigger related options:
- Table: OnboardingEmployeeData
- Batch size: 100 (default)
- Starting position: Trim Horizon
I hit Next button, and I am on the Configure Function screen. The name of my function will be ESEmployeeLoad and I will write this function in Node.4.3.
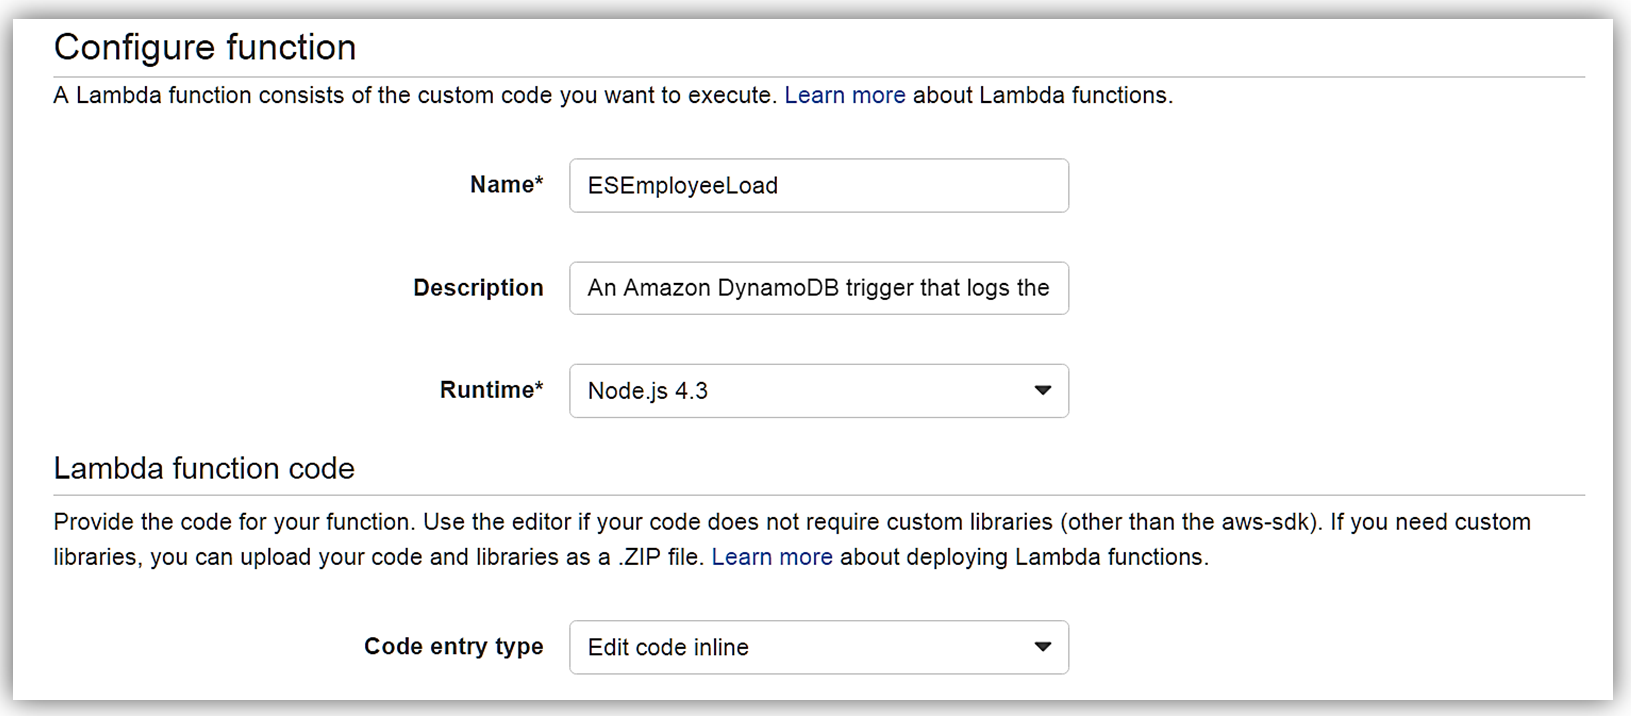
The Lambda function code is as follows:
var AWS = require('aws-sdk');
var path = require('path');
//Object for all the ElasticSearch Domain Info
var esDomain = {
region: process.env.RegionForES,
endpoint: process.env.EndpointForES,
index: process.env.IndexForES,
doctype: 'onboardingrecords'
};
//AWS Endpoint from created ES Domain Endpoint
var endpoint = new AWS.Endpoint(esDomain.endpoint);
//The AWS credentials are picked up from the environment.
var creds = new AWS.EnvironmentCredentials('AWS');
console.log('Loading function');
exports.handler = (event, context, callback) => {
//console.log('Received event:', JSON.stringify(event, null, 2));
console.log(JSON.stringify(esDomain));
event.Records.forEach((record) => {
console.log(record.eventID);
console.log(record.eventName);
console.log('DynamoDB Record: %j', record.dynamodb);
var dbRecord = JSON.stringify(record.dynamodb);
postToES(dbRecord, context, callback);
});
};
function postToES(doc, context, lambdaCallback) {
var req = new AWS.HttpRequest(endpoint);
req.method = 'POST';
req.path = path.join('/', esDomain.index, esDomain.doctype);
req.region = esDomain.region;
req.headers['presigned-expires'] = false;
req.headers['Host'] = endpoint.host;
req.body = doc;
var signer = new AWS.Signers.V4(req , 'es'); // es: service code
signer.addAuthorization(creds, new Date());
var send = new AWS.NodeHttpClient();
send.handleRequest(req, null, function(httpResp) {
var respBody = '';
httpResp.on('data', function (chunk) {
respBody += chunk;
});
httpResp.on('end', function (chunk) {
console.log('Response: ' + respBody);
lambdaCallback(null,'Lambda added document ' + doc);
});
}, function(err) {
console.log('Error: ' + err);
lambdaCallback('Lambda failed with error ' + err);
});
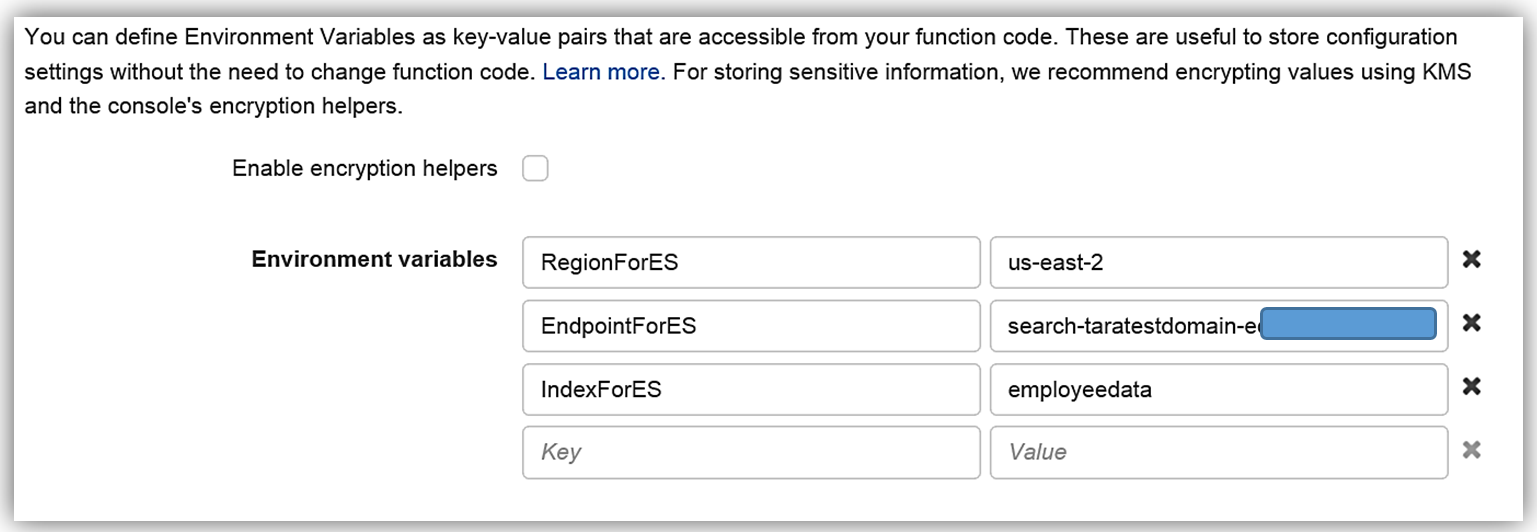
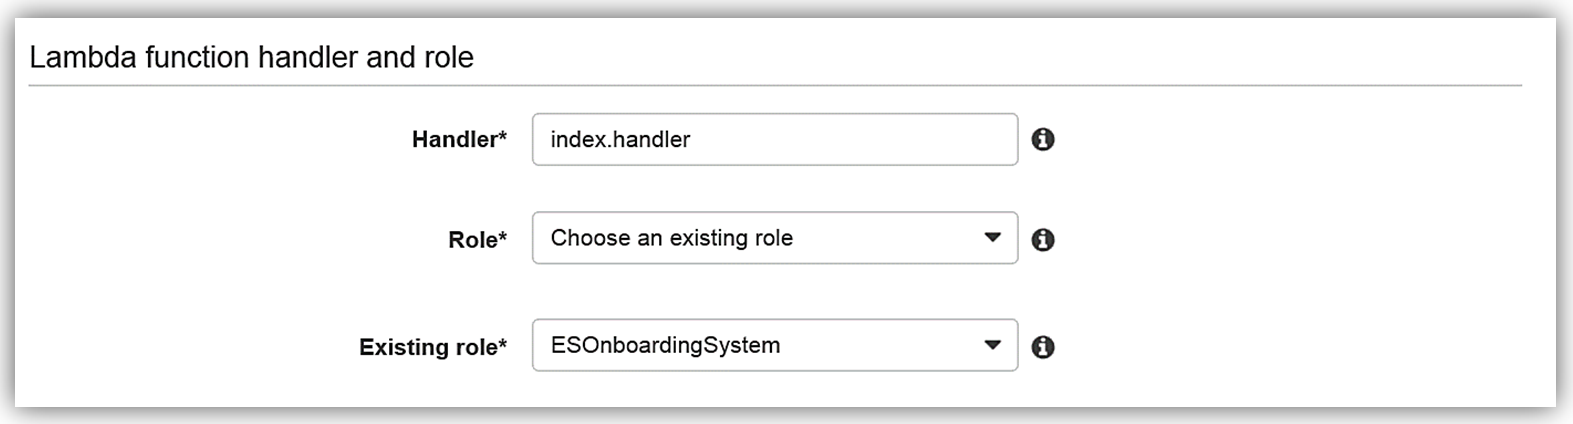
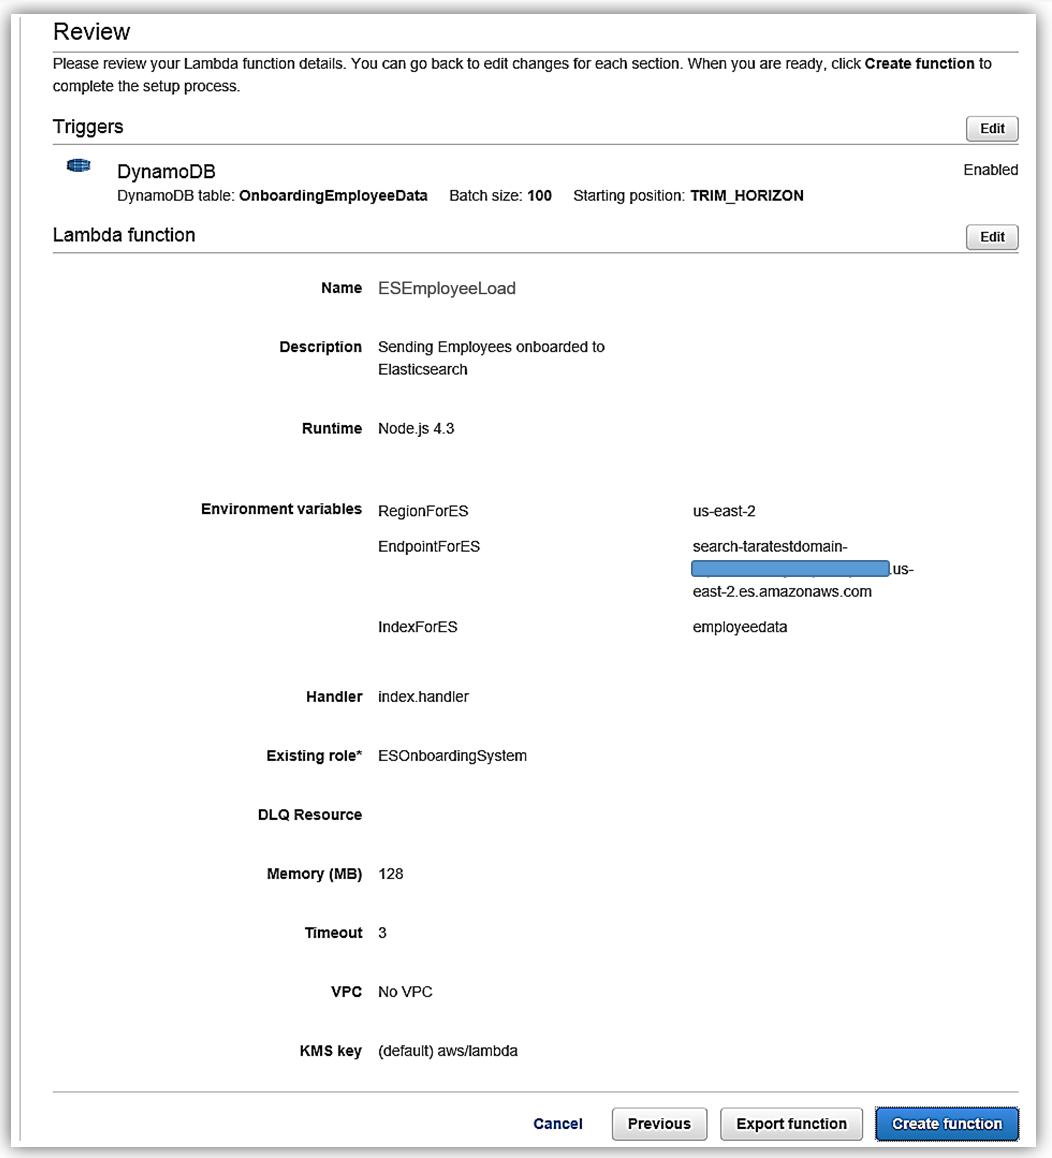
}The Lambda function Environment variables are:
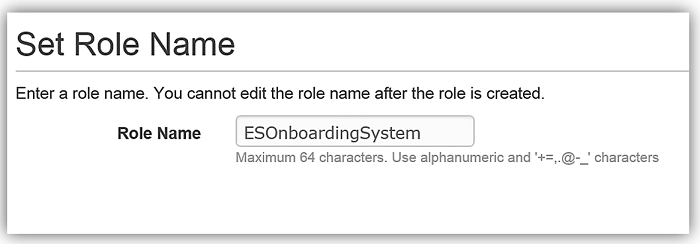
I will select an Existing role option and choose the ESOnboardingSystem IAM role I created earlier.
Upon completing my IAM role permissions for the Lambda function, I can review the Lambda function details and complete the creation of ESEmployeeLoad function.
I have completed the process of building my Lambda function to talk to Elasticsearch, and now I test my function my simulating data changes to my database.
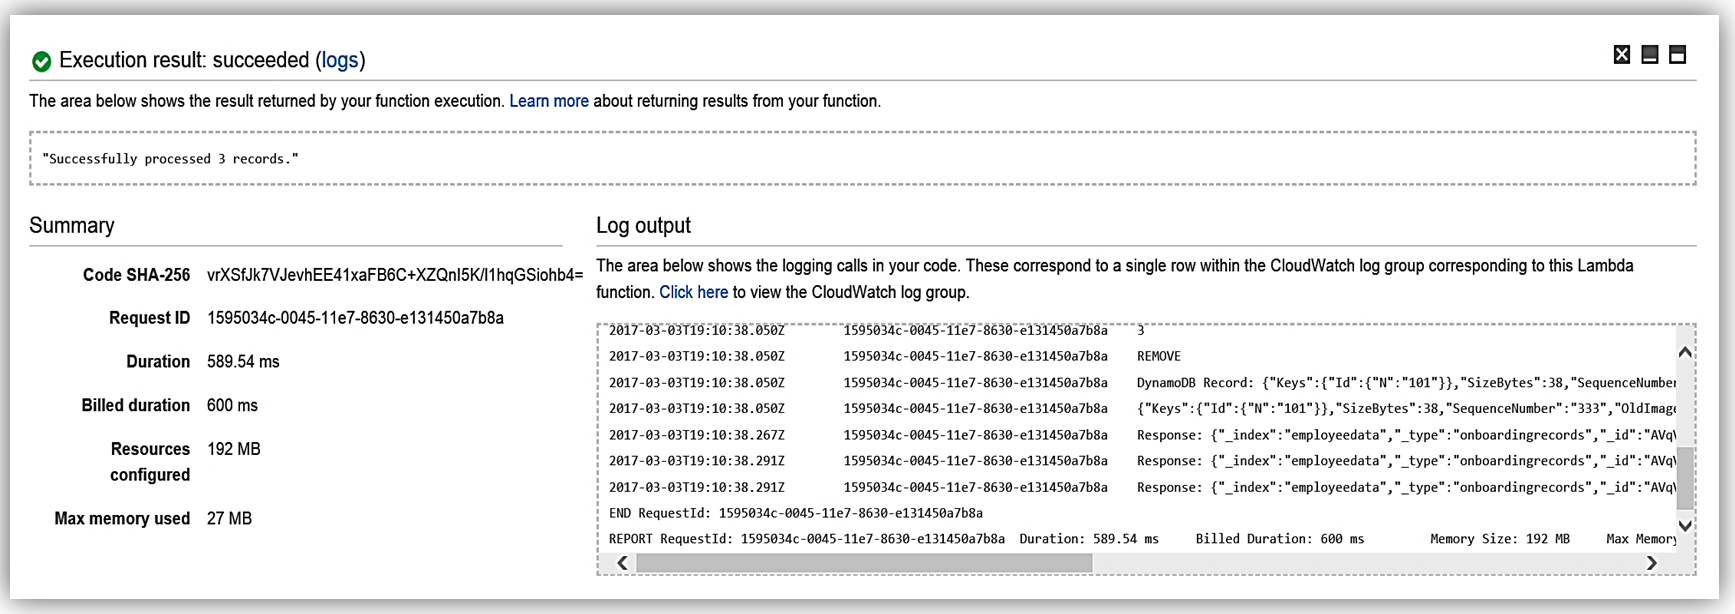
Now my function, ESEmployeeLoad, will execute upon changes to the data in my database from my onboarding system. Additionally, I can review the processing of the Lambda function to Elasticsearch by reviewing the CloudWatch logs.
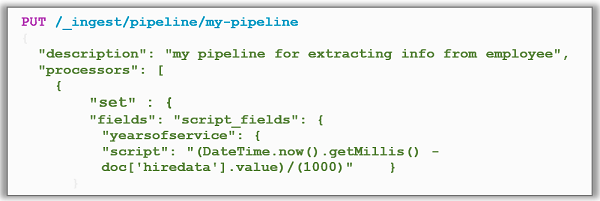
Now I can alter my Lambda function to take advantage of the new features or go directly to Elasticsearch and utilize the new Ingest Mode. An example of this would be to implement a pipeline for my Employee record documents.
I can replicate this function for handling the badge updates to the employee record, and/or leverage other preprocessors against the employee data. For instance, if I wanted to do a search of data based upon a data parameter in the Elasticsearch document, I could use the Search API and get records from the dataset.

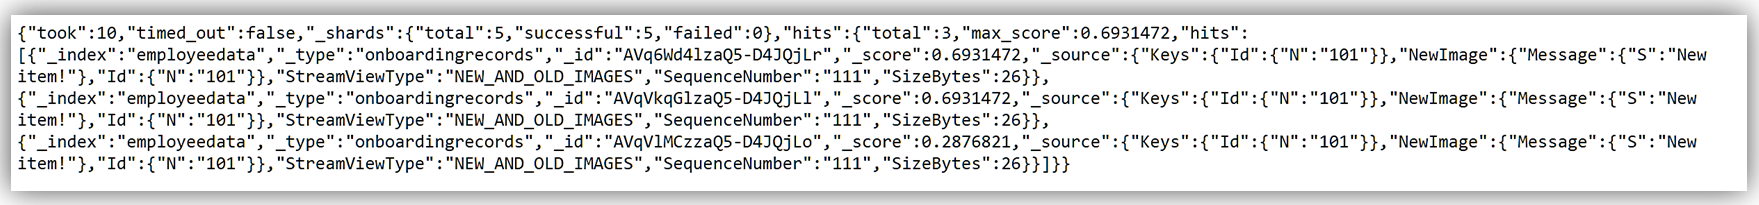
The possibilities are endless, and you can get as creative as your data needs dictate while maintaining great performance.
Amazon Elasticsearch Service: Kibana 5.1
All Amazon Elasticsearch Service domains using Elasticsearch 5.1 are bundled with Kibana 5.1, the latest version of the open-source visualization tool.
The companion visualization and analytics platform, Kibana, has also been enhanced in the Kibana 5.1 release. Kibana is used to view, search or and interact with Elasticsearch data with a myriad of different charts, tables, and maps. In addition, Kibana performs advanced data analysis of large volumes of the data. Key enhancements of the Kibana release are as follows:
- Visualization tool new design: Updated color scheme and maximization of screen real-estate
- Timelion: visualization tool with a time-based query DSL
- Console: formerly known as Sense is now part of the core, using the same configuration for free-form requests to Elasticsearch
- Scripted field language: ability use new Painless scripting language in the Elasticsearch cluster
- Tag Cloud Visualization: 5.1 adds a word base graphical view of data sized by importance
- More Charts: return of previously removed charts and addition of advanced view for X-Pack
- Profiler UI:1 provides an enhancement to profile API with tree view
- Rendering performance improvement: Discover performance fixes, decrease of CPU load
Summary
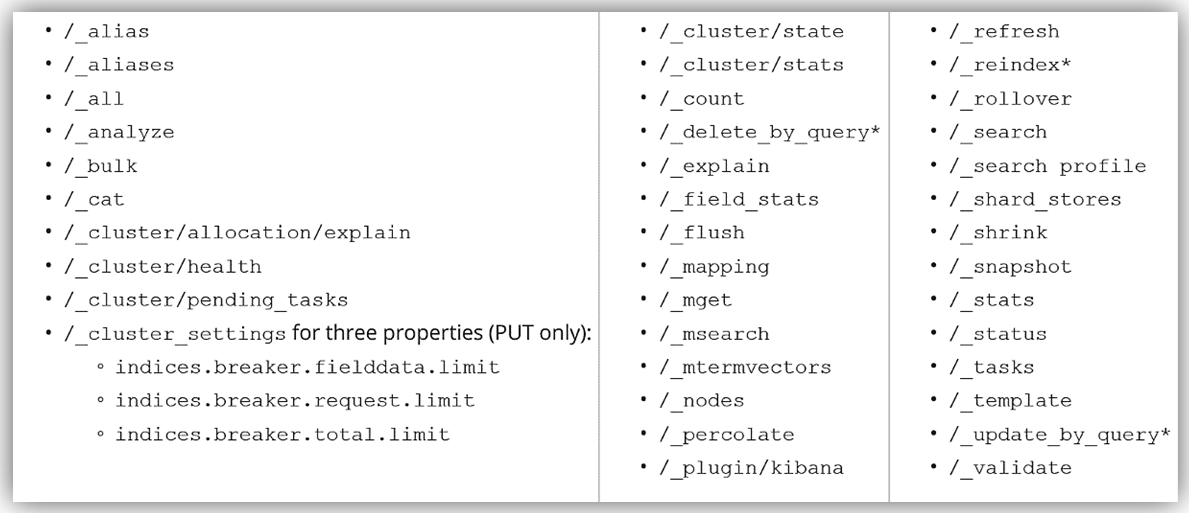
As you can see this release is expansive with many enhancements to assist customers in building Elasticsearch solutions. Amazon Elasticsearch Service now supports 15 new Elasticsearch APIs and 6 new plugins. Amazon Elasticsearch Service supports the following operations for Elasticsearch 5.1:
You can read more about the supported operations for Elasticsearch in the Amazon Elasticsearch Developer Guide, and you can get started by visiting the Amazon Elasticsearch Service website and/or sign into the AWS Management Console.
– Tara
Amazon Kinesis Update – Amazon Elasticsearch Service Integration, Shard-Level Metrics, Time-Based Iterators
Amazon Kinesis makes streaming data easy in the cloud.The Amazon Kinesis platform is comprised of three distinct services: Kinesis Streams allows developers to build their own stream processing applications; Kinesis Firehose simplifies the process of loading streaming data into AWS for storage and analytics; Kinesis Analytics supports the analysis of streaming data using standard SQL queries.
Many AWS customers use Kinesis Streams and Kinesis Firehose as a component of their real-time streaming data ingestion and processing systems. They appreciate the ease of use that comes with a fully managed service, and invest their development time in their application instead of spending time managing their own streaming data infrastructure.
Today we are announcing three new features for Amazon Kinesis Streams and Amazon Kinesis Firehose:
- Elasticsearch Integration – Amazon Kinesis Firehose can now stream data to an Amazon Elasticsearch Service cluster.
- Enhanced Metrics – Amazon Kinesis now sends shard-level metrics to CloudWatch each minute.
- Flexibility – Amazon Kinesis now allows you to retrieve records using time-based shard iterators.
Amazon Elasticsearch Service Integration
Elasticsearch is a popular open-source search and analytics engine. Amazon Elasticsearch Service is a managed service that makes it easy for you to deploy, run, and scale Elasticsearch in the AWS Cloud. You can now arrange to deliver your Kinesis Firehose data stream to an Amazon Elasticsearch Cluster. This will allow you to index and analyze server logs, clickstreams, and social media traffic.
The incoming records (Elasticsearch documents) are buffered in Kinesis Firehose according to a configuration that you specify, and then automatically added to the cluster using a bulk request that indexes multiple documents simultaneously. The data must be UTF-8 encoded and flattened into single JSON object before it is sent to Firehose (see my recent blog post, Amazon Kinesis Agent Update – New Data Preprocessing Feature, to learn more about how to do this).
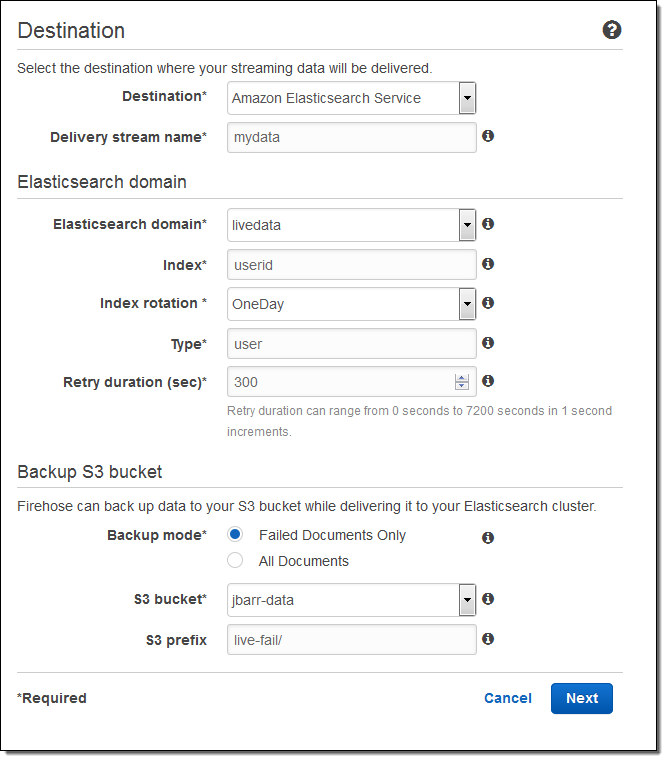
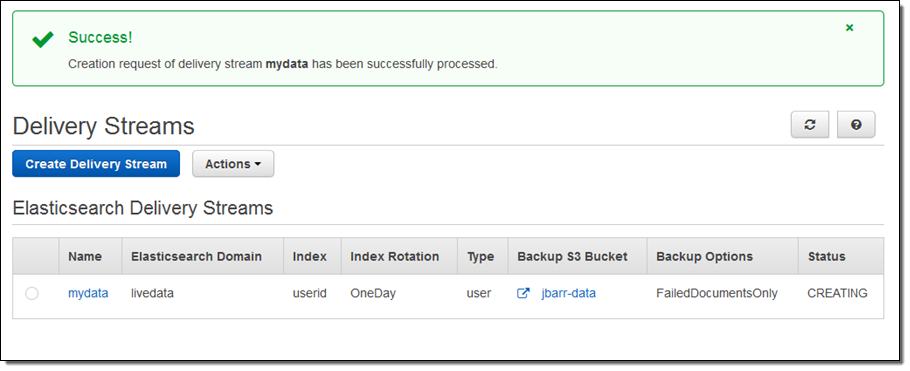
Here’s how to set this up using the AWS Management Console. I choose the destination (Amazon Elasticsearch Service) and set the delivery stream name, then I choose one of my Elasticsearch domains (livedata in this example), set up the index, and choose the index rotation (none, hourly, daily, weekly, or monthly). I also designate an S3 bucket that will receive a backup of either all documents or failed documents (my choice):
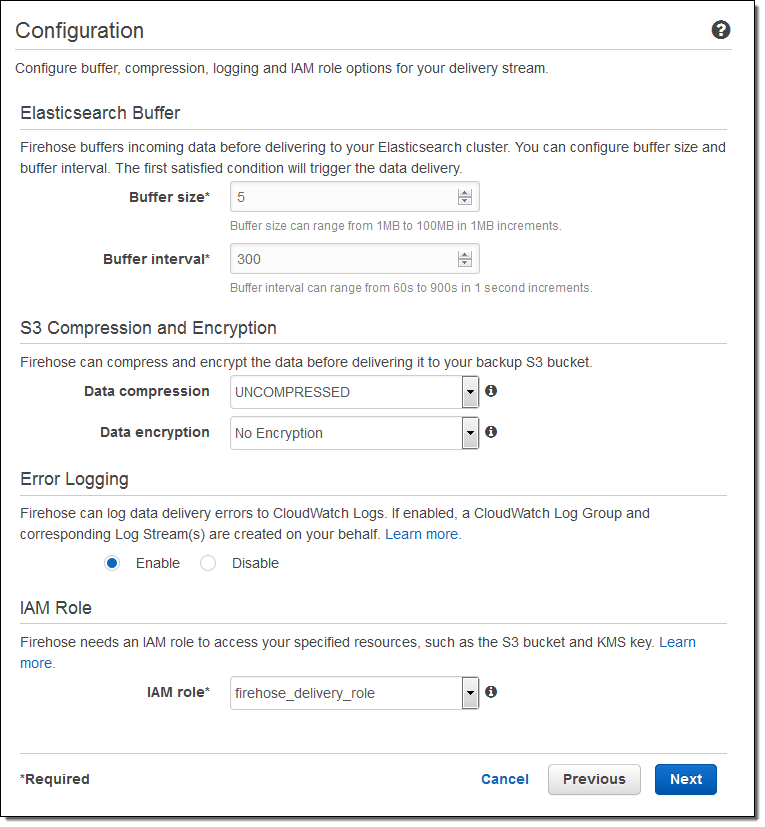
Then I set the buffer size, choose some compression and encryption options for the data that will be sent to my S3 bucket, set up logging (if desired), and pick an appropriate IAM role:
The stream will be ready for use in a minute or so:
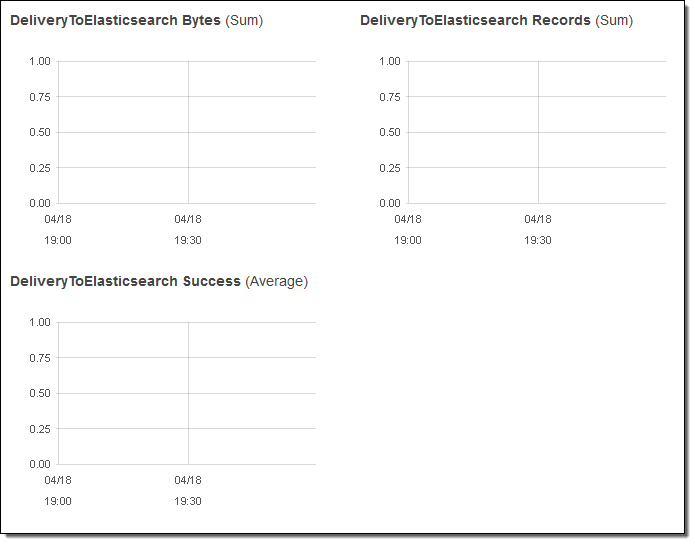
I can view the delivery metrics in the Console:
Once the data starts to arrive in Elasticsearch I can explore it visually using Kibana or by writing queries in the Elasticsearch query language.
Putting this all together, this integration greatly simplifies the process of capturing and delivering your streaming data to your Elasticsearch cluster. There’s no need to write any code or to build your own data ingestion tools.
Shard-Level Metrics
Each Kinesis stream is composed of one or more shards, each of which provides a fixed amount of read and write capacity. Each time you add a shard to a stream, you increase the capacity of the stream.
In order to provide you with increased visibility into the performance of each shard, you can now enable a set of shard-level metrics. There are 6 metrics per shard, each reported once per minute and charged at the usual per-metric CloudWatch pricing. These metrics will allow you to see if a particular shard is running hotter than the others and to locate and root out any inefficiencies in your end-to-end streaming data delivery pipeline. For example, you can identify the shard(s) that are receiving records at a rate too high too handle and the shard(s) that are being read by applications at lower throughput than expected.
Here are the new metrics:
IncomingBytes – The number of bytes that have been successfully PUT to the shard.
IncomingRecords – The number of records that have been successfully PUT to the shard.
IteratorAgeMilliseconds – The age (in milliseconds) of the last record returned by a GetRecords call against a shard. A value of 0 means that the records being read are completely caught up with the stream.
OutgoingBytes – The number of bytes that have been retrieved from the shard.
OutgoingRecords – The number of records that have been retrieved from the shard.
ReadProvisionedThroughputExceeded -The number of GetRecords calls that have been throttled for exceeding the 5 reads per second or 2 MB per second shard limits.
WriteProvisionedThroughputExceeded – The number of records that have been rejected due to throttling for exceeding the 1000 records per second or 1 MB per second shard limits.
You can enable these metrics by calling the EnableEnhancedMonitoring function. As always, you can use the CloudWatch APIs to aggregate them across any desired time period.
Time-Based Iterators
Your application reads data from a Kinesis stream by creating an iterator on the desired shard using the GetShardIterator function and specifying the desired starting point. In addition to the existing starting point options (at or after a sequence number, oldest record, or newest record) you can now specify a timestamp. The value (specified in Unix epoch format) indicates the timestamp of the oldest record that you would like to read and process.
— Jeff;
Learn About the newest AWS Services – Attend our October Webinars
If you attended AWS re:Invent, you were among the first to know about Amazon QuickSight, AWS IoT, Kinesis Firehose, and our other new offerings. Perhaps you had time to attend a session to learn more about the new service or services that were of interest to you. If you didn’t attend re:Invent or missed a session or two and are ready to learn more, I’ve got you covered. We will be running nine new-product webinars later this month. Each webinar is designed to provide you with the information that you need to have in order to be up and running as quickly as possible.
Here’s what we have for you! The webinars are free but “seating” is limited and you should definitely sign up ahead of time if you want to attend (all times are Pacific):
Tuesday, October 27
QuickSight is a fast, cloud-powered business intelligence tool. You can build visualizations, perform ad-hoc analysis, and get business insights from your data.
- Webinar: Introducing Amazon QuickSight (9 – 10 AM).
- Blog Post: Amazon QuickSight – Fast & Easy to Use Business Intelligence for Big Data at 1/10th the Cost of Traditional Solutions.
AWS IoT is a managed cloud platform that lets connected devices easily and securely interact with cloud applications and other devices.
- Webinar: Getting Started with AWS IoT (10:30 – 11:30 AM).
- Blog Post: AWS IoT – Cloud Services for Connected Devices.
Amazon Kinesis Firehose is the easiest way to load streaming data into AWS.
- Webinar: Introducing Amazon Kinesis Firehose (Noon – 1 PM).
- Blog Post: Amazon Kinesis Firehose – Simple & Highly Scalable Data Ingestion.
Wednesday, October 28
Spot Blocks allow you to launch Spot instances that will run for a finite duration (1 to 6 hours).
- Webinar: Introducing Spot Blocks (9 – 10 AM).
- Blog Post: New – EC2 Spot Blocks for Defined-Duration Workloads.
AWS WAF is a web application firewall that helps protect your web applications from common exploits.
- Webinar: Introducing AWS WAF (10:30 – 11:30 AM).
- Blog Post: New AWS WAF.
Amazon Elasticsearch Service is a managed service that makes it easy to deploy, operate, and scale Elasticsearch in the AWS Cloud.
- Webinar: Introducing Amazon Elasticsearch Service (Noon – 1 PM).
- Blog Post: New – Amazon Elasticsearch Service.
Thursday, October 29
AWS Lambda lets you run code in the cloud without provisioning or managing servers.
- Webinar: AWS Lambda Best Practices: Python, Scheduled Jobs, and More (9 – 10 AM).
- Blog Post: AWS Lambda Update – Python, VPC, Increased Function Duration, Scheduling, and More.
AWS Mobile Hub provides an integrated console that helps you build, test, and monitor your mobile apps.
- Webinar: Introducing AWS Mobile Hub (10:30 – 11:30 AM).
- Blog Post: AWS Mobile Hub – Build, Test, and Monitor Mobile Applications.
AWS Import/Export Snowball is a petabyte-scale data transport solution that uses secure appliances to transfer large amounts of data into and out of AWS.
- Webinar: Introducing AWS Import/Export Snowball (Noon – 1 PM).
- Blog Post: AWS Import/Export Snowball – Transfer 1 Petabyte Per Week Using Amazon-Owned Storage Appliances.
— Jeff;
New – Amazon Elasticsearch Service
Elasticsearch is a real-time, distributed search and analytics engine that fits nicely into a cloud environment. It is document-oriented and does not require a schema to be defined up-front. It supports structured, unstructured, and time-series queries and serves as a substrate for other applications and visualization tools including Kibana.
Today we are launching the new Amazon Elasticsearch Service (Amazon ES for short). You can launch a scalable Elasticsearch cluster from the AWS Management Console in minutes, point your client at the cluster’s endpoint, and start to load, process, analyze, and visualize data shortly thereafter.
Creating a Domain
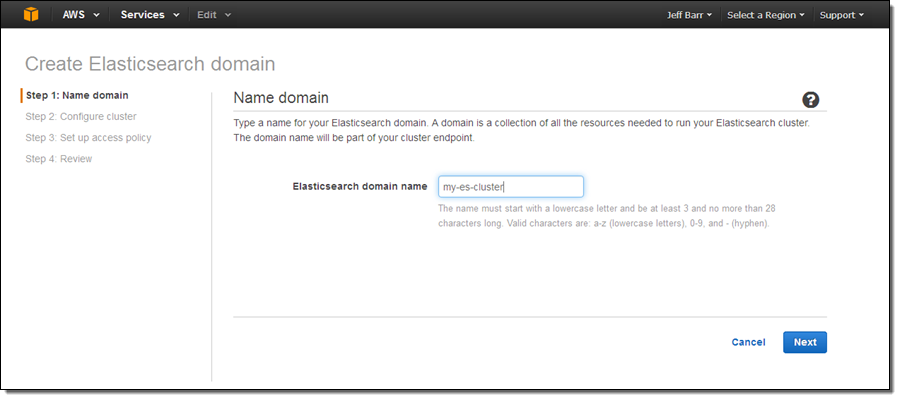
Let’s go ahead and create an Amazon ES domain (as usual, you also can do this using the AWS Command Line Interface (CLI), AWS Tools for Windows PowerShell, or the Amazon Elasticsearch Service API). Simply click on the Get Started button on the splash page and enter a name for your domain (I chose my-es-cluster):
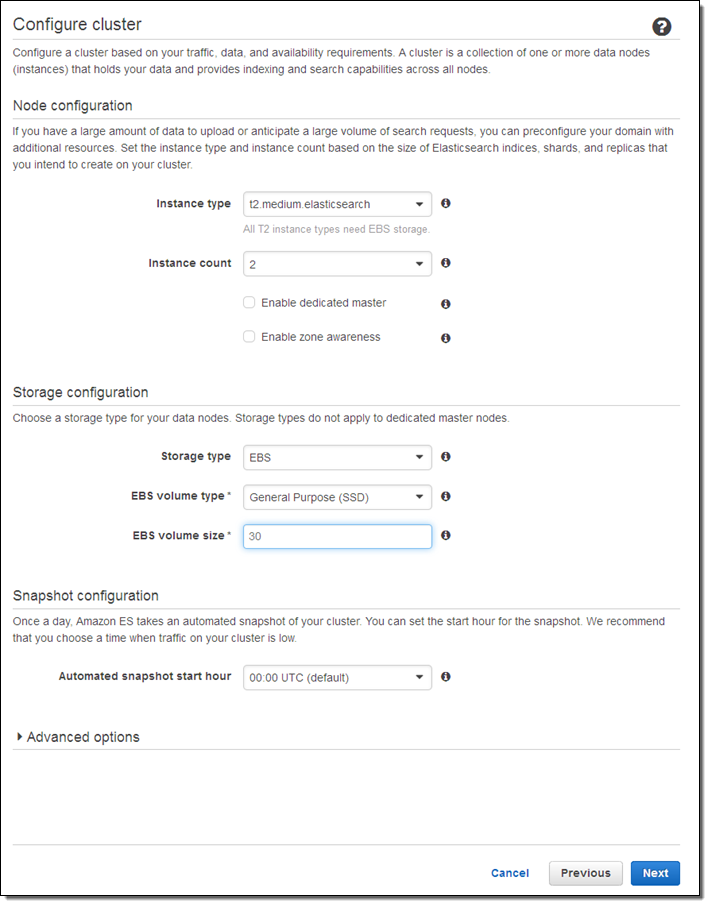
Select an instance type and an instance count (both can be changed later if necessary):
Here are some guidelines to help you to choose appropriate instance types:
- T2 – Dev and test (also good for dedicated master nodes).
- R3 – Processing loads that are read-heavy or that have complex queries (e.g. nested aggregations).
- I2 – High-write, large-scale data storage.
- M3 – Balanced read/write loads.
If you check Enable dedicated master, Amazon ES will create a separate master node for the cluster. This node will not hold data or respond to upload requests. We recommend that you enable this option and use at least three master nodes to ensure maximum cluster stability. Also, clusters should always have an odd number of master nodes in order to protect against split-brain scenarios.
If you check Enable zone awareness, Amazon ES will distribute the nodes across multiple Availability Zones in the region to increase availability. If you choose to do this, you will also need to set up replicas using the Elasticsearch Index API; you can also use the same API to do this when you create new indexes (learn more).
I chose to use EBS General Purpose (SSD) storage for my data nodes. I could have chosen to store the data on the instance, or to use another type of EBS volume. Using EBS allows me to store more data and to run on less costly instances; however on-instance storage will offer better write performance. Large data sets can run on I2 instances (they have up to 1.6 terabytes of SSD storage per node).
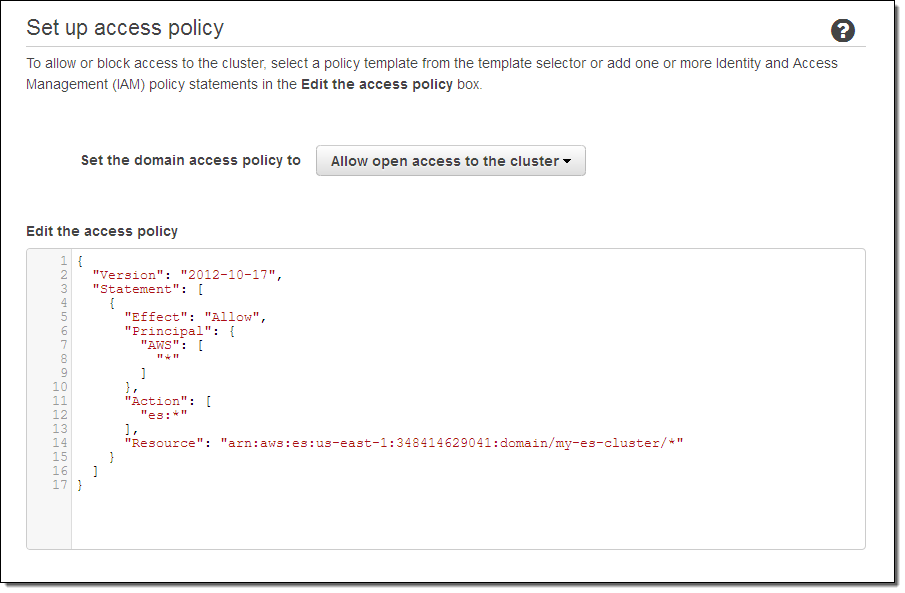
Next, set the access policy. I chose to make mine wide-open in order to simplify testing (don’t do this for your cluster); I could have used one of the IP-based or user-based templates and a wizard to create a more restrictive policy.
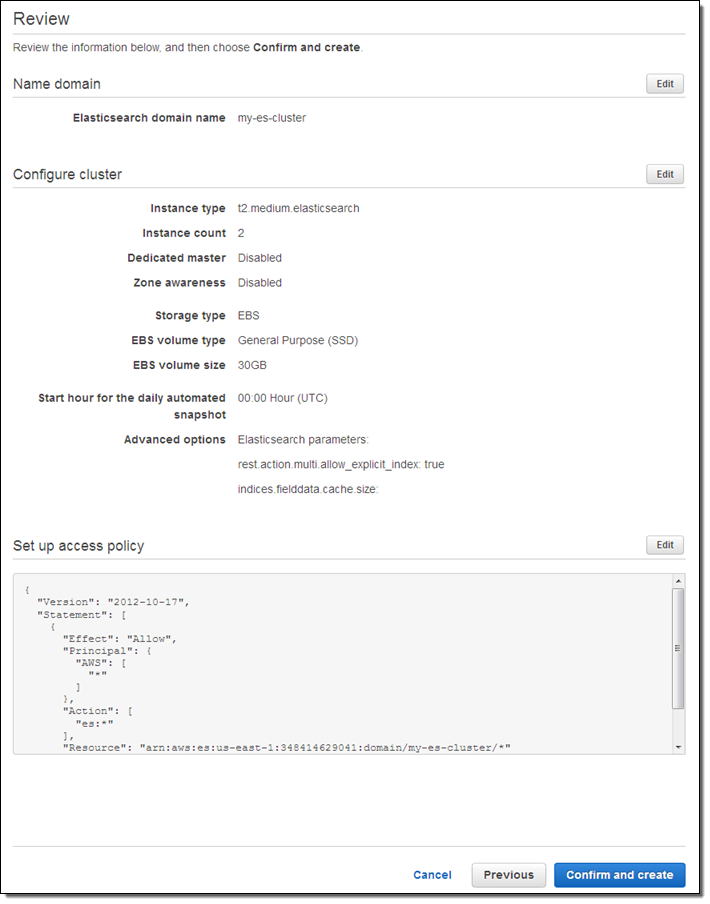
Finally, review the settings and click on Confirm and create:
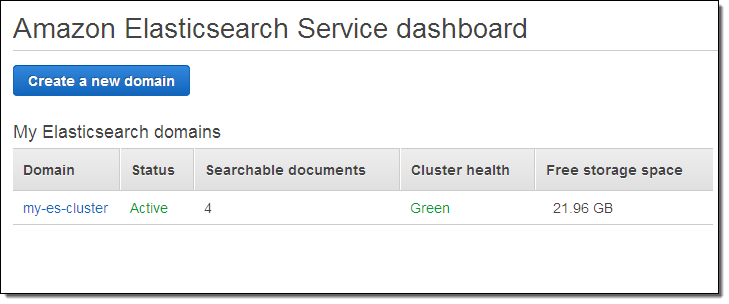
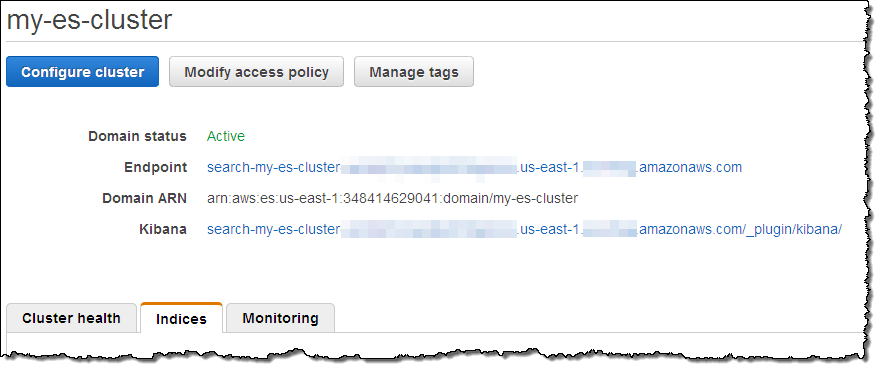
The cluster will be created in a couple of minutes, and will be listed on the Elasticsearch Service dashboard (I added some documents before I took this screenshot):
And that’s it!
Loading Documents
I knew next to nothing about Elasticsearch before I started to write this blog post, but that didn’t stop me from trying it out. Following the steps in Having Fun: Python and Elasticsearch, Part 1, I installed the Python library for Elasticsearch, and returned to the AWS Management Console to locate the endpoint for my cluster.
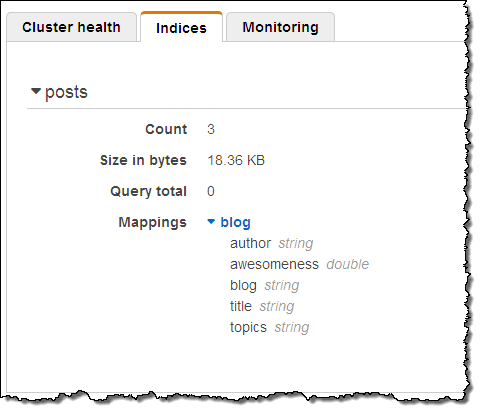
I performed the status check outlined in the blog post, and everything worked as described therein. Then I pasted the Python code from the post into a file, and ran it to create some sample data. I was able to see the new index in the Console:
That was easy!
Querying Documents
With the data successfully loaded, I clicked on the Kibana link for my cluster to see what else I could do:
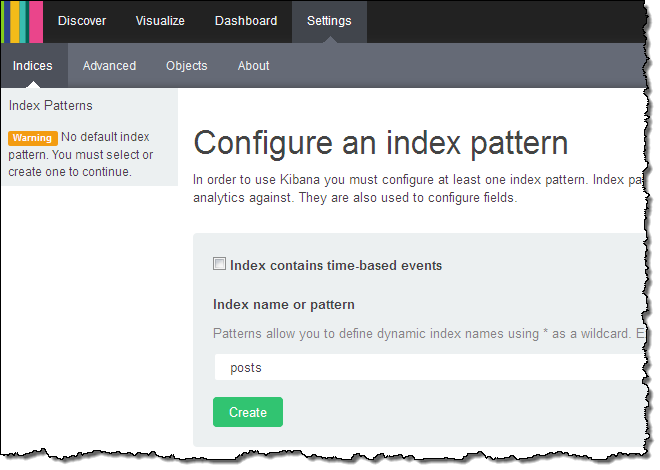
Kibana (v4) opened in another browser tab and I configured it to index my posts:
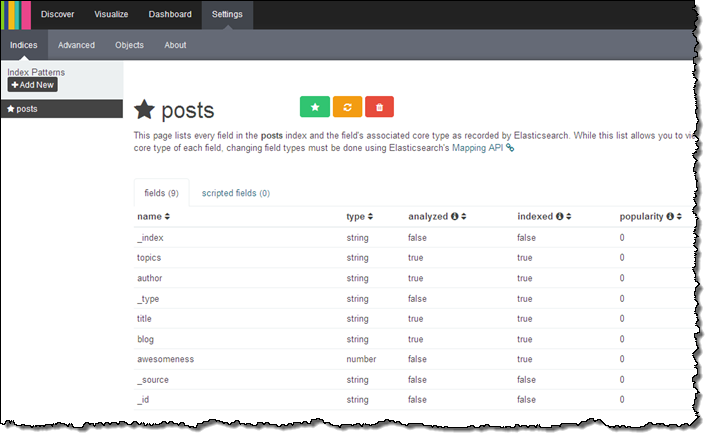
Kibana confirmed the fields in the domain:
From there (if I had more time and actually knew what I was doing) I could visualize my data using Kibana.
Version 3 of Kibana is also available. To access it, simply append _plugin/kibana3/ to the endpoint of your cluster.
Other Goodies
You can scale your cluster using the CLI (aws es update-elasticsearch-domain-configuration), API (UpdateElasticsearchDomainConfig), or the console. You simply set the new configuration and Amazon ES will create the new cluster and copy your the data to it with no down time.
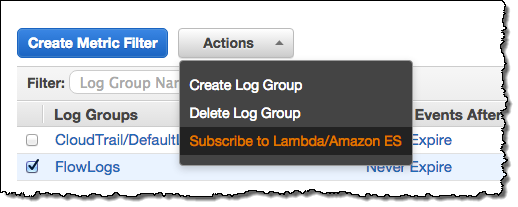
As part of today’s launch of Amazon ES, we are launching integration with CloudWatch Logs. You can arrange to route your CloudWatch Logs to Amazon ES by creating an Amazon ES domain, navigating to the Cloudwatch Logs Console and clicking on Subscribe to Lambda / Amazon ES, then stepping through the wizard:
The wizard will help you to set up a subscription filter pattern for the incoming logs (the pattern is optional, but having one allows you to define a schema for the logs). Here are some sample Kibana dashboards that you can use to view several different types of logs, along with the filter patterns that you’ll need to use when you route the logs to Amazon ES:
- VPC Flow Dashboard – use this filter pattern to map the log entries:
[version, account_id, interface_id, srcaddr, dstaddr, srcport, dstport,.
protocol, packets, bytes, start, end, action, log_status] - Lambda Dashboard – use this filter pattern to map the log entries:
[timestamp=*Z, request_id="*-*", event]. - CloudTrail Dashboard – no filter pattern is needed; the log entries are in self-identifying JSON form.
Amazon ES supports the ICU Analysis Plugin and the Kuromoji plugin. You can configure these normally through the Elasticsearch Mapping API. Amazon ES does not currently support commercial plugins like Shield or Marvel. The AWS equivalents for these plugins are AWS Identity and Access Management (IAM) and CloudWatch.
Amazon ES automatically takes a snapshot of your cluster every day and stores it durably for 14 days. You can contact us to restore your cluster from a stored backup. You can set the hour of the day during which that backup occurs via the “automated snapshot hour.” You can also use the Elasticsearch Snapshot API to take a snapshot of your cluster and store it in your S3 bucket or restore an Elasticsearch snapshot (Amazon ES or self-managed) to an Amazon ES cluster from your S3 bucket.
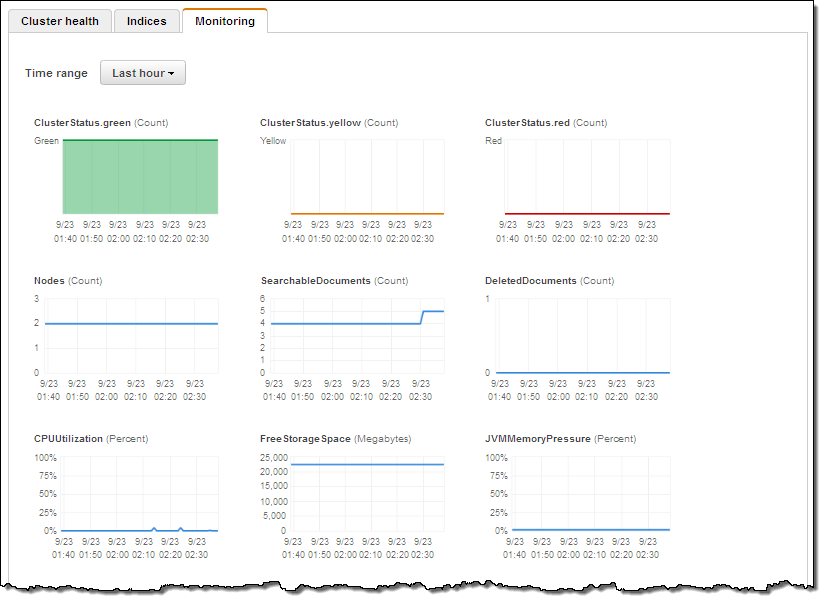
Each Amazon ES domain also forwards 17 separate metrics to CloudWatch. You can view these metrics on the Amazon ES console’s monitoring tab or in the CloudWatch console. The cluster Status metrics (green, yellow, and red) expose the underlying cluster’s status: green means all shards are assigned to a node; yellow means that at least one replica shard is not assigned to any node; red means that at least one primary shard is not assigned to a node. One common occurrence is for a cluster to go yellow when it has a single data node and replication is set to 1 (Logstash does that by default). The simple fix is to add another node to the cluster.
CPU Utilization is most directly affected by request processing (reads or writes). When this metric is high you should increase replication and add instances to the cluster to allow for additional parallel processing. Similarly for JVM Memory pressure, increase instance count or change to R3 instances. You should set CloudWatch alarms on these metrics, to keep 10-20% free storage, and free CPU at all times.
Available Now
You can create your own Amazon ES clusters today in the US East (Northern Virginia), US West (Northern California), US West (Oregon), Asia Pacific (Tokyo), Asia Pacific (Singapore), Asia Pacific (Sydney), South America (São Paulo), EU (Ireland), and EU (Frankfurt) regions.
If you qualify for the AWS Free Tier, you can use a t2.micro.elasticsearch node for up to 750 hours per month, along with up to 10 gigabytes of Magnetic or SSD-Backed EBS storage at no charge.
— Jeff;