Category: Amazon Kinesis
New: Server-Side Encryption for Amazon Kinesis Streams
In this age of smart homes, big data, IoT devices, mobile phones, social networks, chatbots, and game consoles, streaming data scenarios are everywhere. Amazon Kinesis Streams enables you to build custom applications that can capture, process, analyze, and store terabytes of data per hour from thousands of streaming data sources. Since Amazon Kinesis Streams allows applications to process data concurrently from the same Kinesis stream, you can build parallel processing systems. For example, you can emit processed data to Amazon S3, perform complex analytics with Amazon Redshift, and even build robust, serverless streaming solutions using AWS Lambda.
Kinesis Streams enables several streaming use cases for consumers, and now we are making the service more effective for securing your data in motion by adding server-side encryption (SSE) support for Kinesis Streams. With this new Kinesis Streams feature, you can now enhance the security of your data and/or meet any regulatory and compliance requirements for any of your organization’s data streaming needs.
In fact, Kinesis Streams is now one of the AWS Services in Scope for the Payment Card Industry Data Security Standard (PCI DSS) compliance program. PCI DSS is a proprietary information security standard administered by the PCI Security Standards Council founded by key financial institutions. PCI DSS compliance applies to all entities that store, process, or transmit cardholder data and/or sensitive authentication data which includes service providers. You can request the PCI DSS Attestation of Compliance and Responsibility Summary using AWS Artifact. But the good news about compliance with Kinesis Streams doesn’t stop there. Kinesis Streams is now also FedRAMP compliant in AWS GovCloud. FedRAMP stands for Federal Risk and Authorization Management Program and is a U.S. government-wide program that delivers a standard approach to the security assessment, authorization, and continuous monitoring for cloud products and services. You can learn more about FedRAMP compliance with AWS Services here.
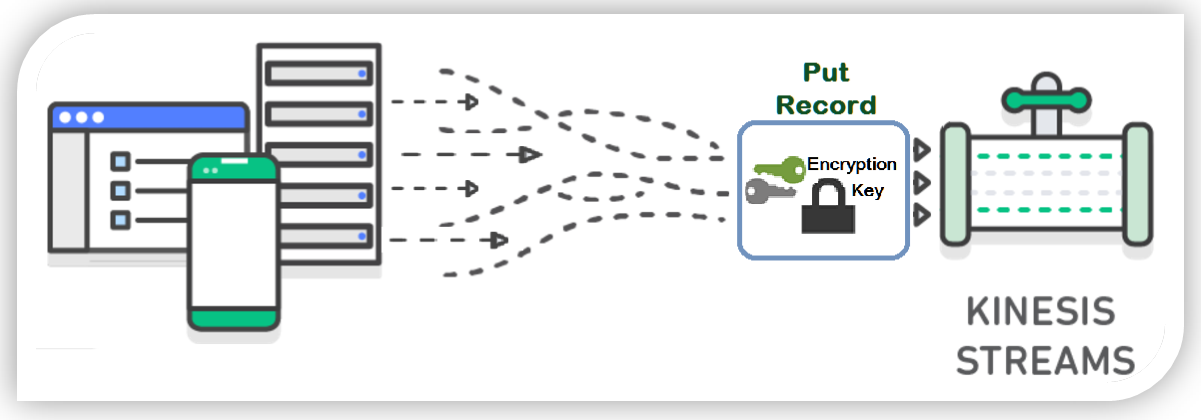
Now are you ready to get into the keys? Get it, instead of get into the weeds. Okay a little corny, but it was the best I could do. Coming back to discussing SSE for Kinesis Streams, let me explain the flow of server-side encryption with Kinesis. Each data record and partition key put into a Kinesis Stream using the PutRecord or PutRecords API is encrypted using an AWS Key Management Service (KMS) master key. With the AWS Key Management Service (KMS) master key, Kinesis Streams uses the 256-bit Advanced Encryption Standard (AES-256 GCM algorithm) to add encryption to the incoming data.
In order to enable server-side encryption with Kinesis Streams for new or existing streams, you can use the Kinesis management console or leverage one of the available AWS SDKs. Additionally, you can audit the history of your stream encryption, validate the encryption status of a certain stream in the Kinesis Streams console, or check that the PutRecord or GetRecord transactions are encrypted using the AWS CloudTrail service.
Walkthrough: Kinesis Streams Server-Side Encryption
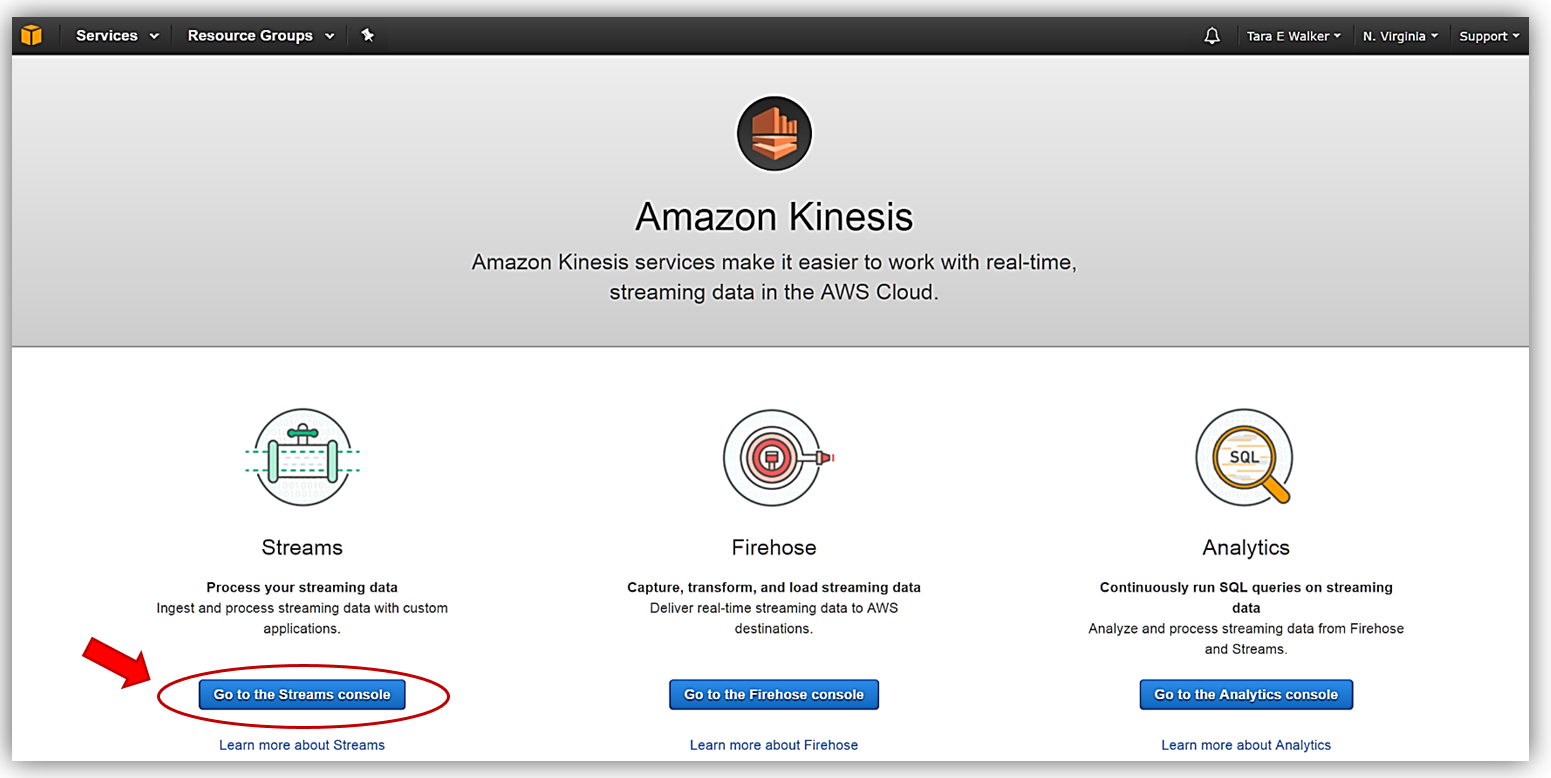
Let’s do a quick walkthrough of server-side encryption with Kinesis Streams. First, I’ll go to the Amazon Kinesis console and select the Streams console option.
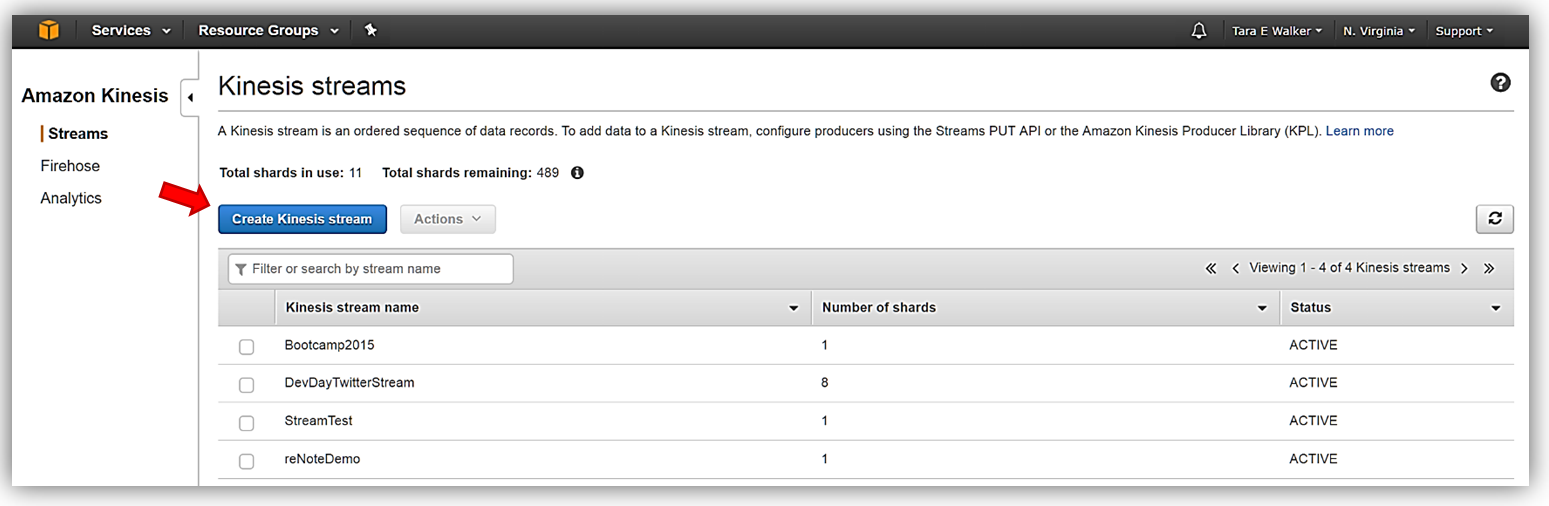
Once in the Kinesis Streams console, I can add server-side encryption to one of my existing Kinesis streams or opt to create a new Kinesis stream. For this walkthrough, I’ll opt to quickly create a new Kinesis stream, therefore, I’ll select the Create Kinesis stream button.
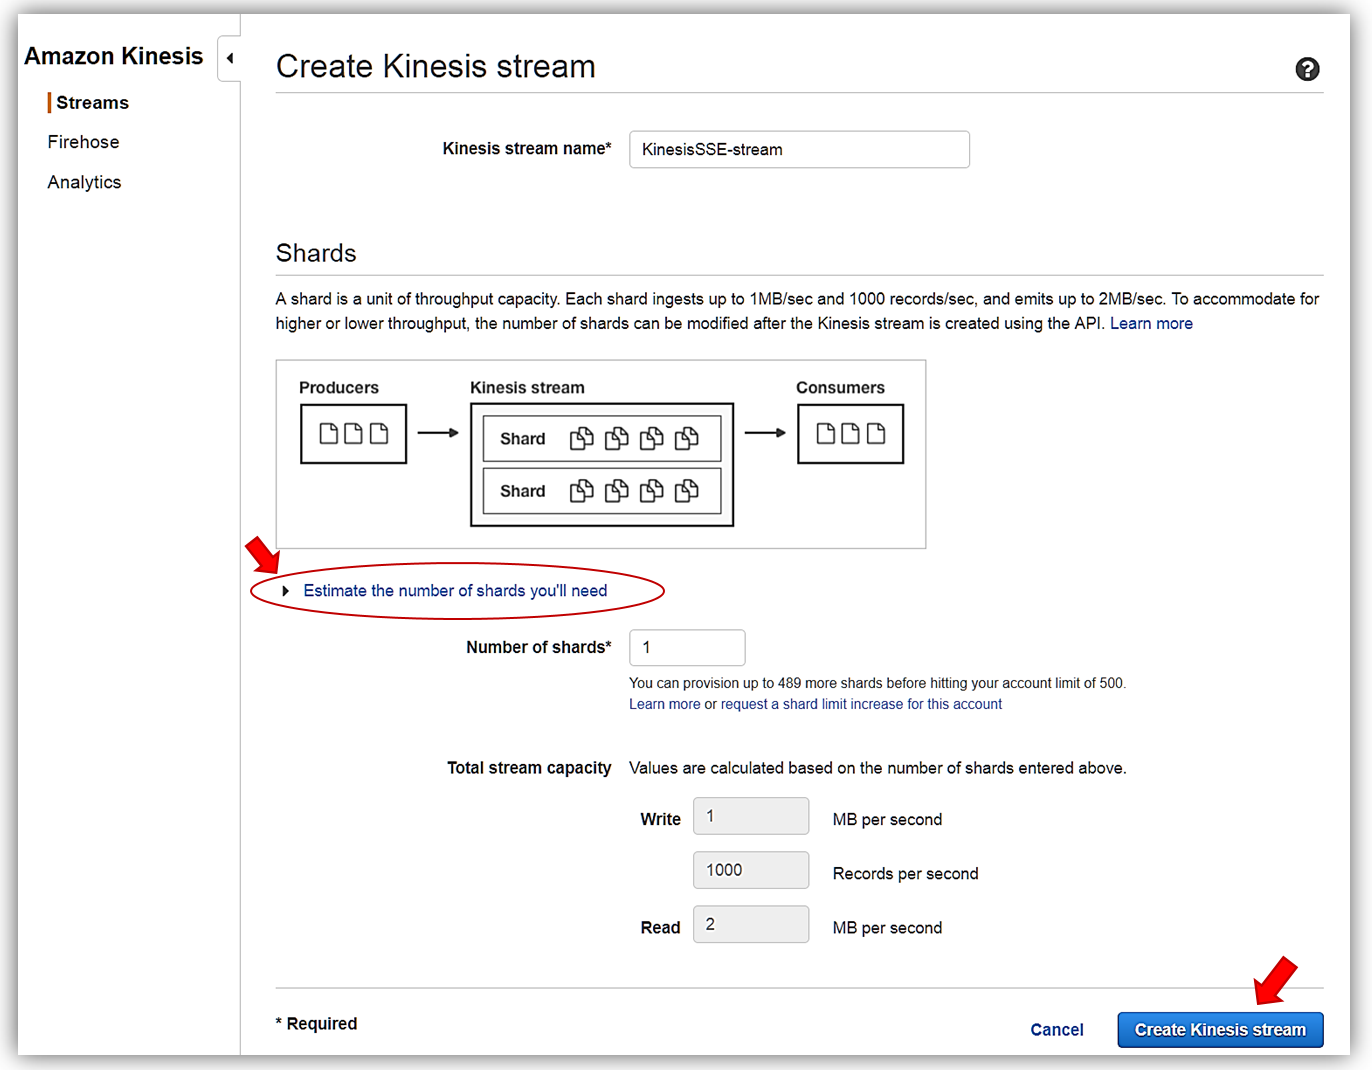
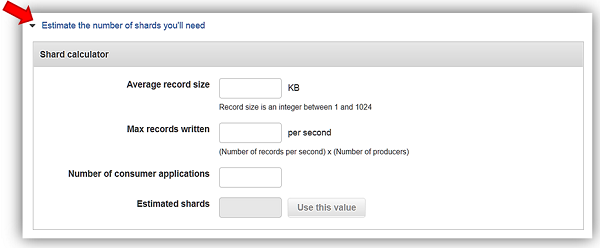
I’ll name my stream, KinesisSSE-stream, and allocate one shard for my stream. Remember that the data capacity of your stream is calculated based upon the number of shards specified for the stream. You can use the Estimate the number of shards you’ll need dropdown within the console or read more calculations to estimate the number of shards in a stream here. To complete the creation of my stream, now I click the Create Kinesis stream button.
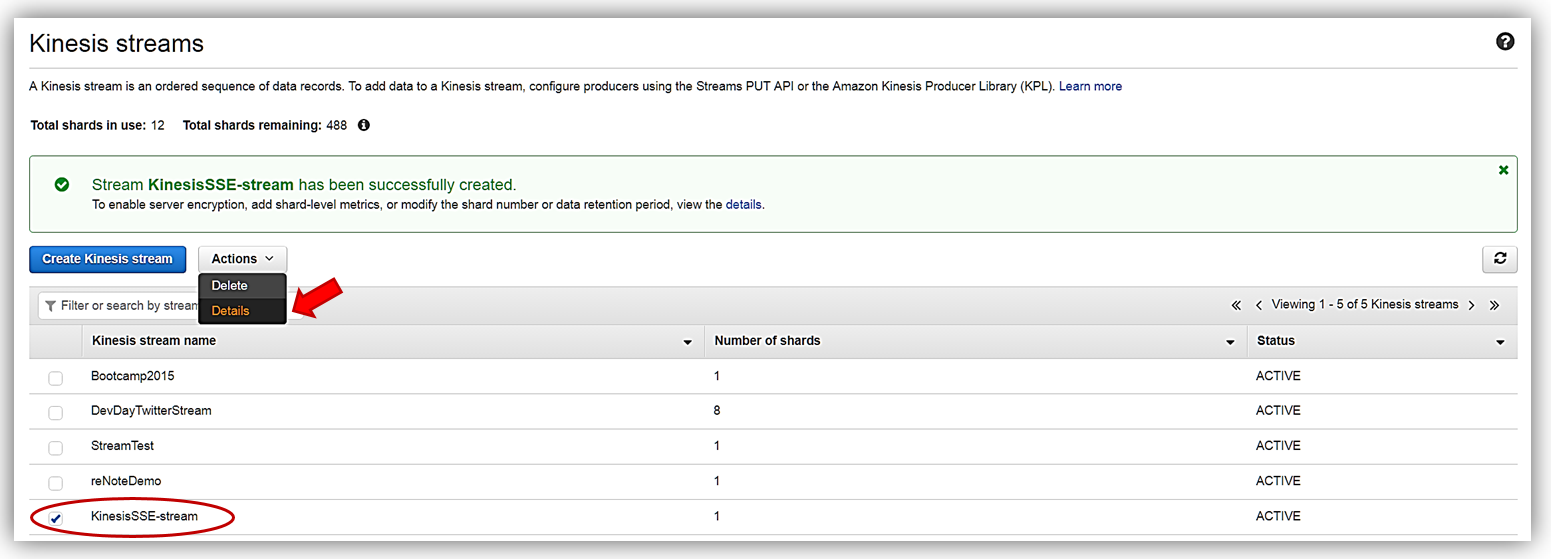
With my KinesisSSE-stream created, I will select it in the dashboard and choose the Actions dropdown and select the Details option.
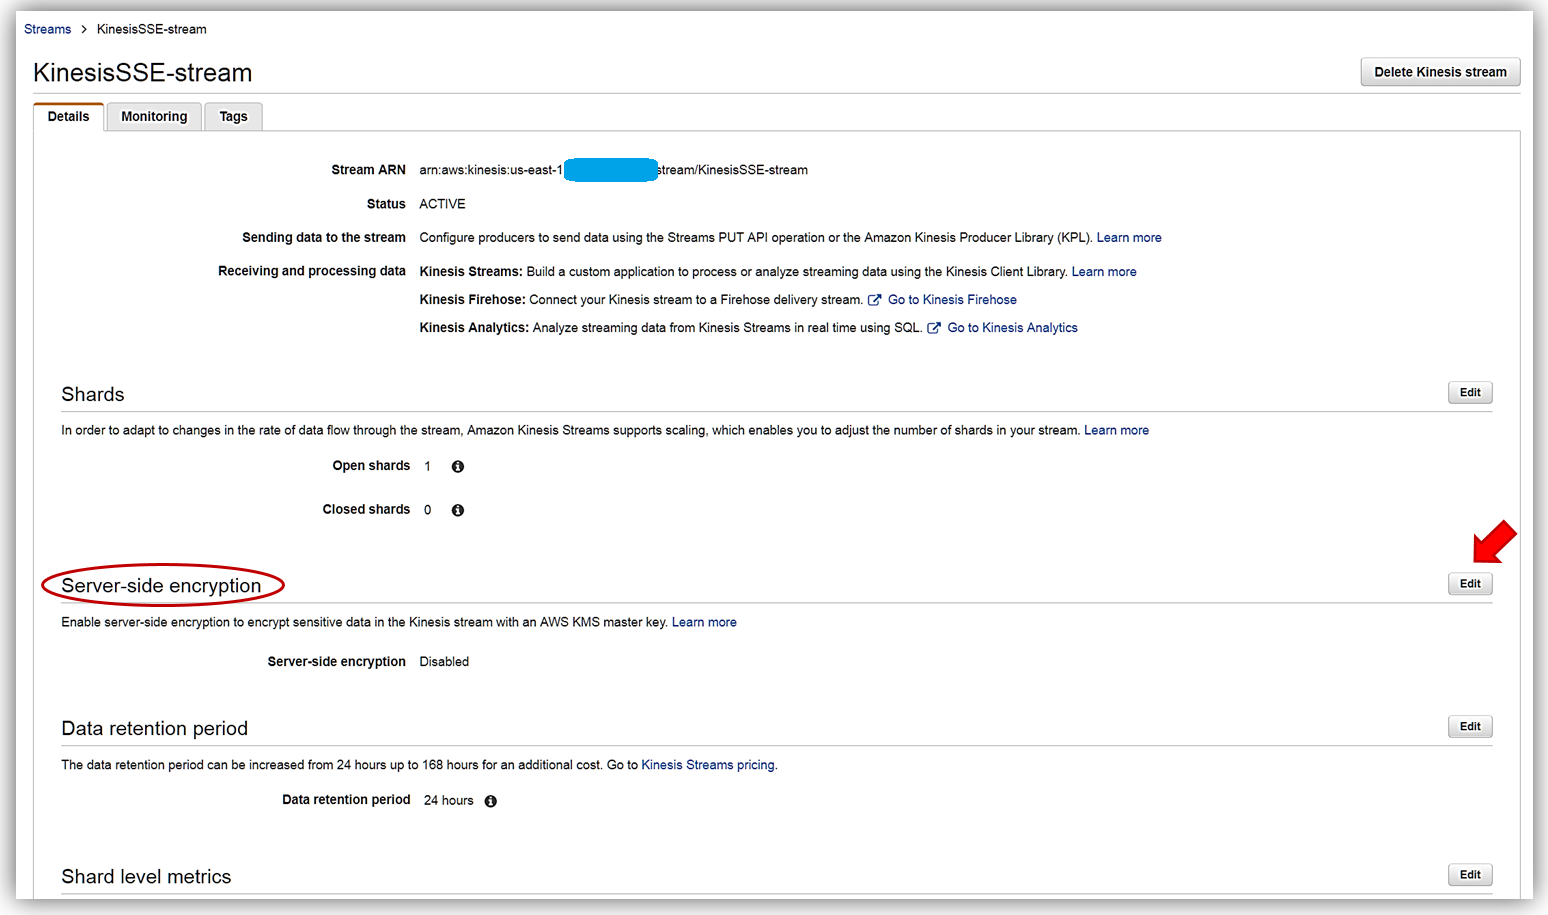
On the Details page of the KinesisSSE-stream, there is now a Server-side encryption section. In this section, I will select the Edit button.
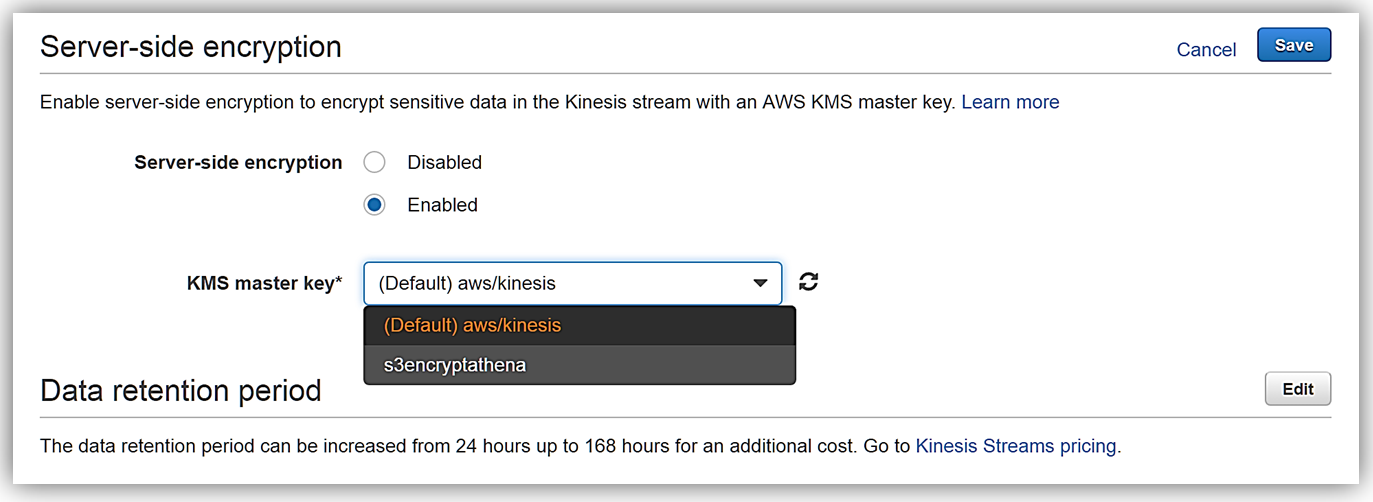
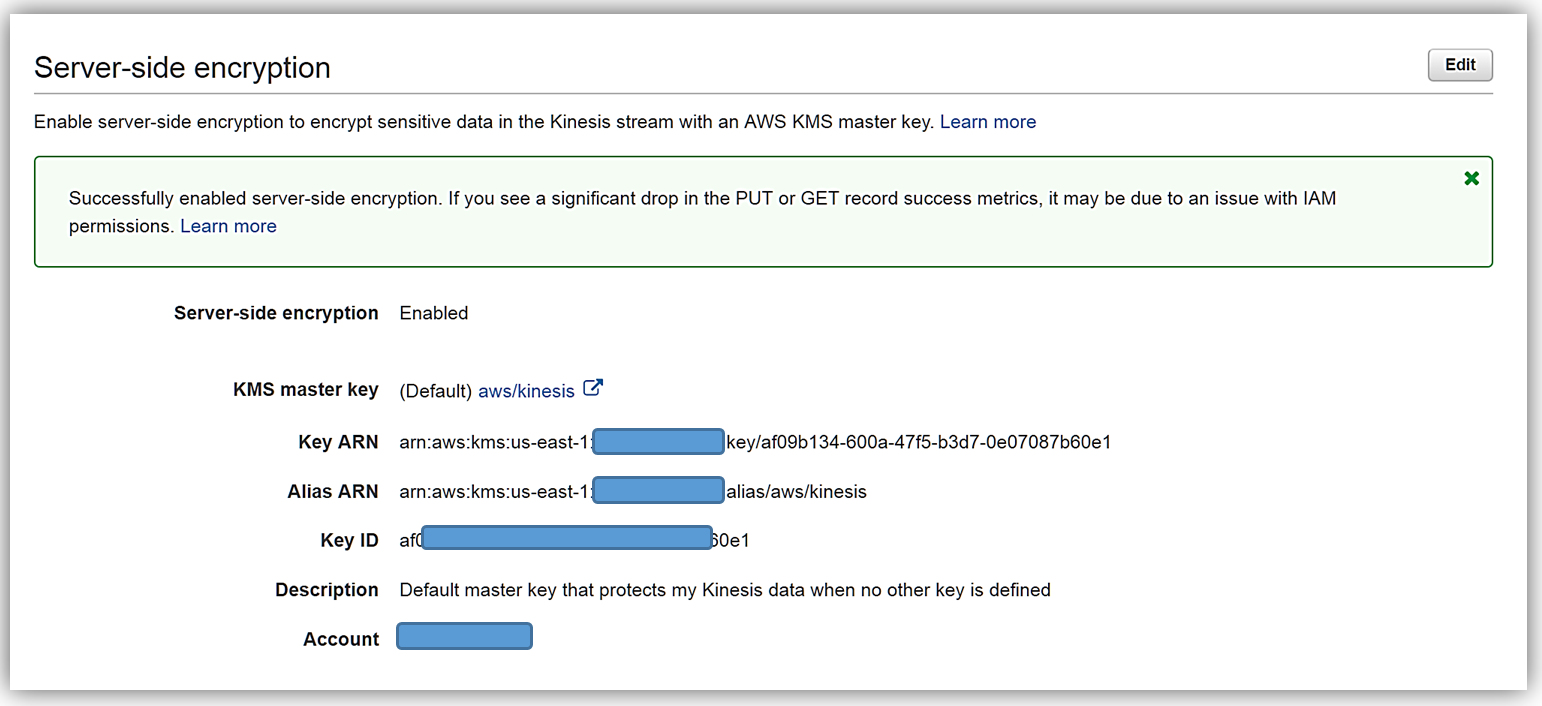
Now I can enable server-side encryption for my stream with an AWS KMS master key, by selecting the Enabled radio button. Once selected I can choose which AWS KMS master key to use for the encryption of data in KinesisSSE-stream. I can either select the KMS master key generated by the Kinesis service, (Default) aws/kinesis, or select one of my own KMS master keys that I have previously generated. I’ll select the default master key and all that is left is for me to click the Save button.
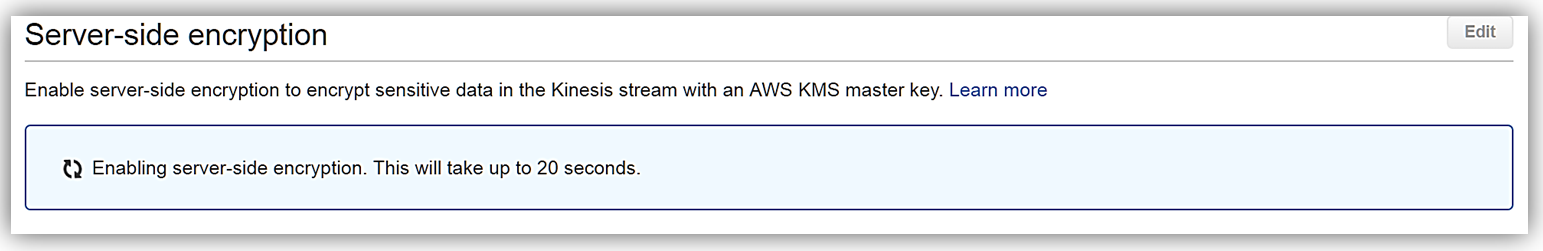
That’s it! As you can see from my screenshots below, after only about 20 seconds, server-side encryption was added to my Kinesis stream and now any incoming data into my stream will be encrypted. One thing to note is server-side encryption only encrypts incoming data after encryption has been enabled. Preexisting data that is in a Kinesis stream prior to server-side encryption being enabled will remain unencrypted.
Summary
Kinesis Streams with Server-side encryption using AWS KMS keys makes it easy for you to automatically encrypt the streaming data coming into your stream. You can start, stop, or update server-side encryption for any Kinesis stream using the AWS management console or the AWS SDK. To learn more about Kinesis Server-Side encryption, AWS Key Management Service, or about Kinesis Streams review the Amazon Kinesis getting started guide, the AWS Key Management Service developer guide, or the Amazon Kinesis product page.
Enjoy streaming.
– Tara
Amazon Kinesis- Setting up a Streaming Data Pipeline
Ray Zhu from the Amazon Kinesis team wrote this great post about how to set up a streaming data pipeline. He carefully shows you step by step how he set it all up and how you can do it too.
-Ana
Consumer demand for better experiences is ever increasing today. Companies across different industry segments are looking for ways to differentiate their products and services. Data is a key ingredient for providing differentiated products and services, and this is no longer a secret but rather a well adopted practice. Almost all companies at meaningful size are using some sort of data technologies, which means being able to collect and use data is no longer enough as a differentiating factor. Then what? How fast you can collect and use your data becomes the key to stay competitive.
Streaming data technologies shorten the time to analyze and use your data from hours and days to minutes and seconds. Let’s walk through an example of using Amazon Kinesis Firehose, Amazon Redshift, and Amazon QuickSight to set up a streaming data pipeline and visualize Maryland traffic violation data in real time.
Data Flow Overview

Step 1 Set up Redshift database and table
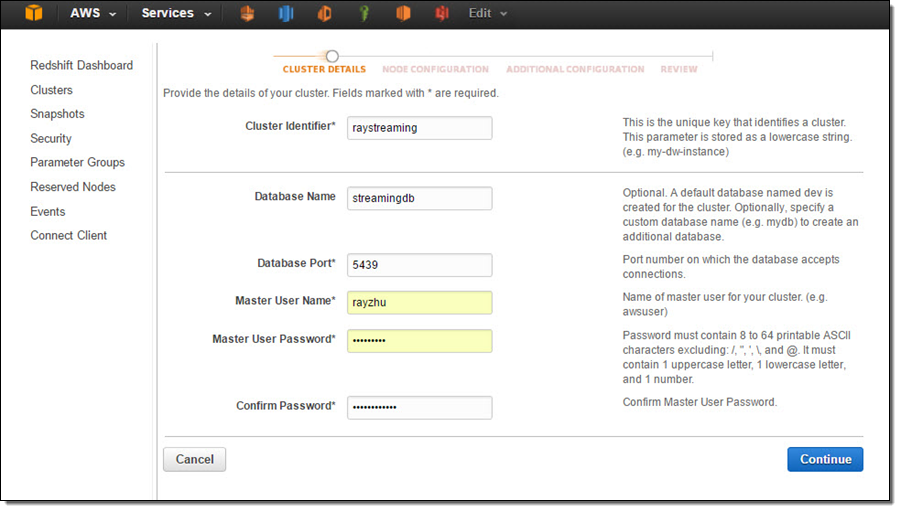
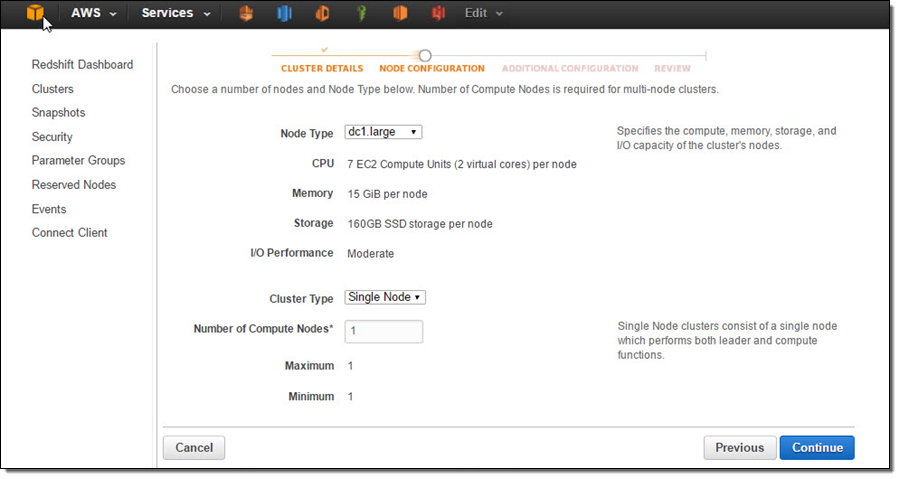
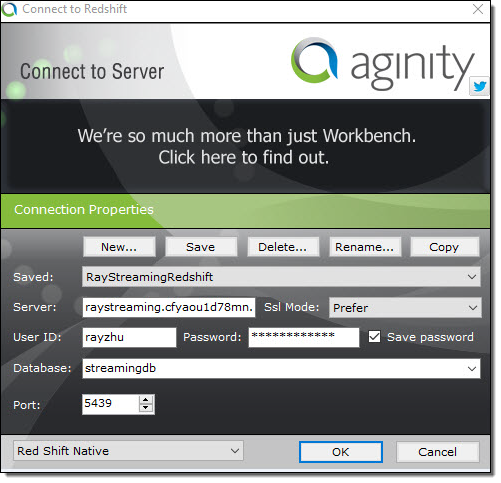
In this step, I’ll set up a Redshift table for Kinesis Firehose to continuously load streaming data into. I first start a single node Redshift cluster and name it “raystreaming.”
Under “Additional Configuration”, I make the cluster publicly accessible so that Kinesis Firehose and QuickSight can connect to my cluster.
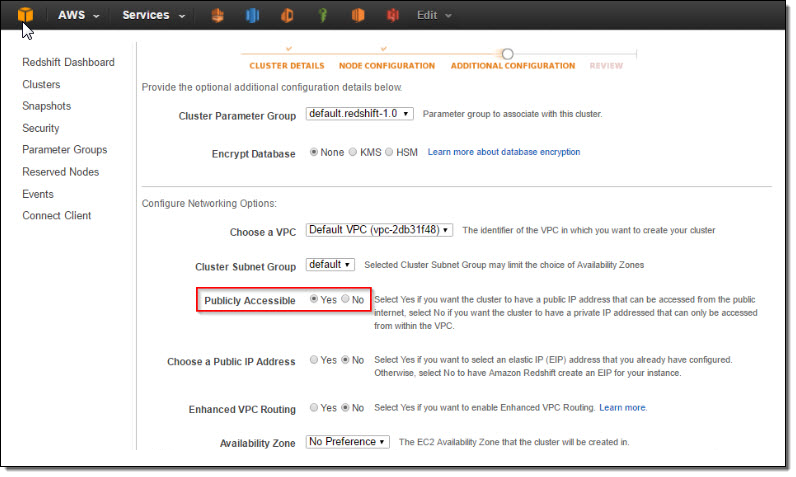
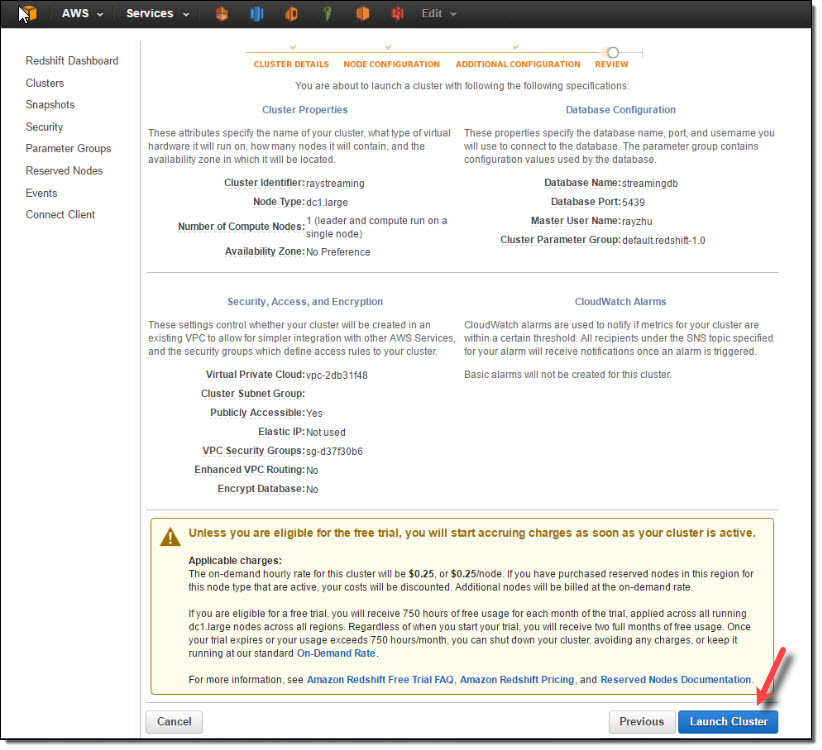
After reviewing all configurations, I click on “Launch Cluster”.
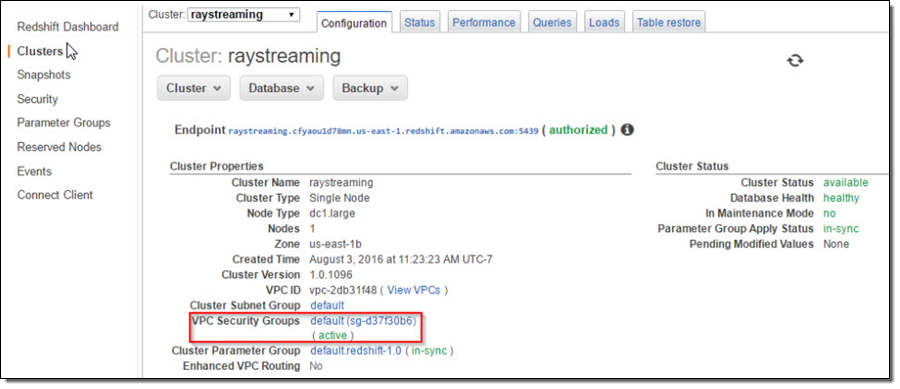
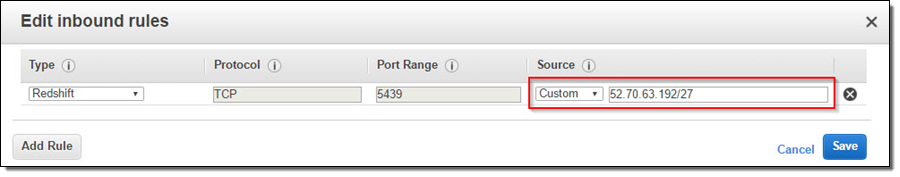
Once the cluster is active, I go to the cluster’s VPC Security Groups to add inbound access for Kinesis Firehose service IPs and outbound access for QuickSight service IPs.
Kinesis Firehose service IPs:
| US East (N. Virginia) | 52.70.63.192/27 |
| US West (Oregon) | 52.89.255.224/27 |
| EU (Ireland) | 52.19.239.192/27 |
QuickSight service IPs:
| US East (N. Virginia) | 52.23.63.224/27 |
| US West (Oregon) (us-west-2) | 54.70.204.128/27 |
| EU (Ireland) (eu-west-1) | 52.210.255.224/27 |
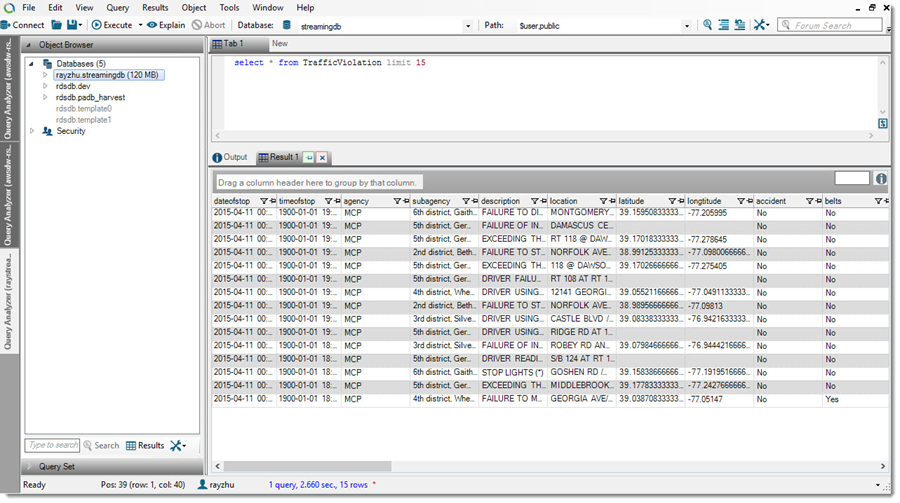
Now the cluster is setup and configured. I’ll use a JDBC tool and the SQL statement below to create a table for storing Maryland traffic violation data.
create table TrafficViolation(
 dateofstop date,
 timeofstop timestamp,
 agency varchar(100),
 subagency varchar(100),
 description varchar(300),
 location varchar(100),
 latitude varchar(100),
 longtitude varchar(100),
 accident varchar(100),
 belts varchar(100),
 personalinjury varchar(100),
 propertydamage varchar(100),
 fatal varchar(100),
 commlicense varchar(100),
 hazmat varchar(100),
 commvehicle varchar(100),
 alcohol varchar(100),
 workzone varchar(100),
 state varchar(100),
 veichletype varchar(100),
 year varchar(100),
 make varchar(100),
 model varchar(100),
 color varchar(100),
 violation varchar(100),
 type varchar(100),
 charge varchar(100),
 article varchar(100),
 contributed varchar(100),
 race varchar(100),
 gender varchar(100),
 drivercity varchar(100),
 driverstate varchar(100),
 dlstate varchar(100),
 arresttype varchar(100),
 geolocation varchar(100));
Step 2 Set up Kinesis Firehose delivery stream
In this step, I’ll set up a Kinesis Firehose delivery stream to continuously deliver data to the “TrafficViolation” table created above.
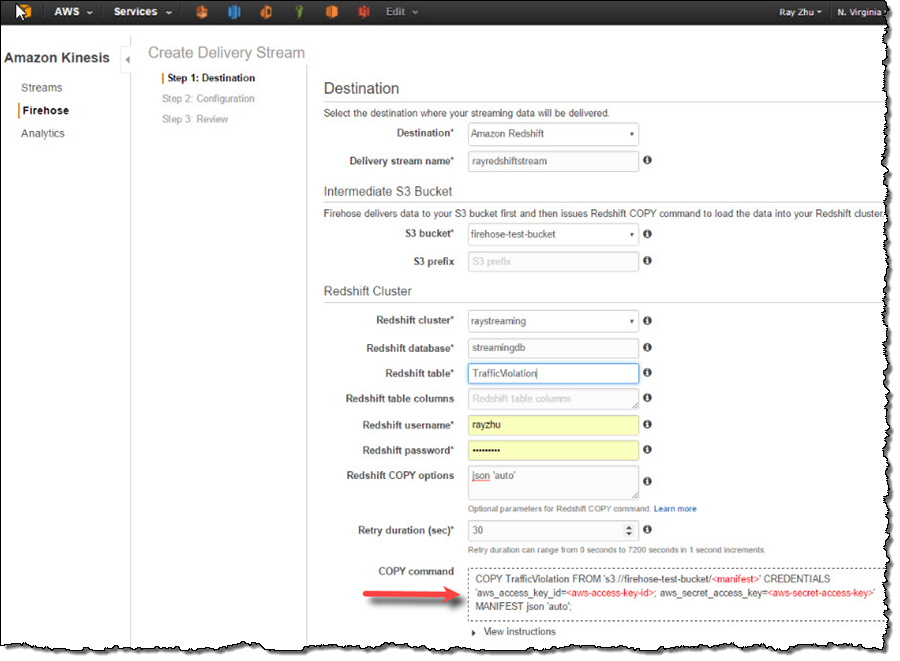
I name my Firehose delivery stream “rayredshiftstream”. Under destination configurations, I choose “Amazon Redshift” as destination and configure an intermediate S3 bucket. Kinesis Firehose will first load my streaming data to this intermediate buckets and then COPY it to Redshift. Loading data from S3 to Redshift is efficient and preserves resources on Redshift for queries. Also, I always have a backup of my data in S3 for other batch processes or in case my Redshift cluster is not accessible (e.g. under maintenance).
Subsequently, I enter the Redshift cluster, database, and table names along with Redshift user name and password. This user needs to have Redshift INSERT permission. I also specify “json ‘auto’” under COPY options to parse JSON formatted sample data.
I set retry duration to 30 seconds. In cases when data load to my Redshift cluster fails, Kinesis Firehose will retry for 30 seconds. The failed data is always in the intermediate S3 bucket for backfill. At the bottom, the exact COPY command Kinesis Firehose will use is generated for testing purposes.
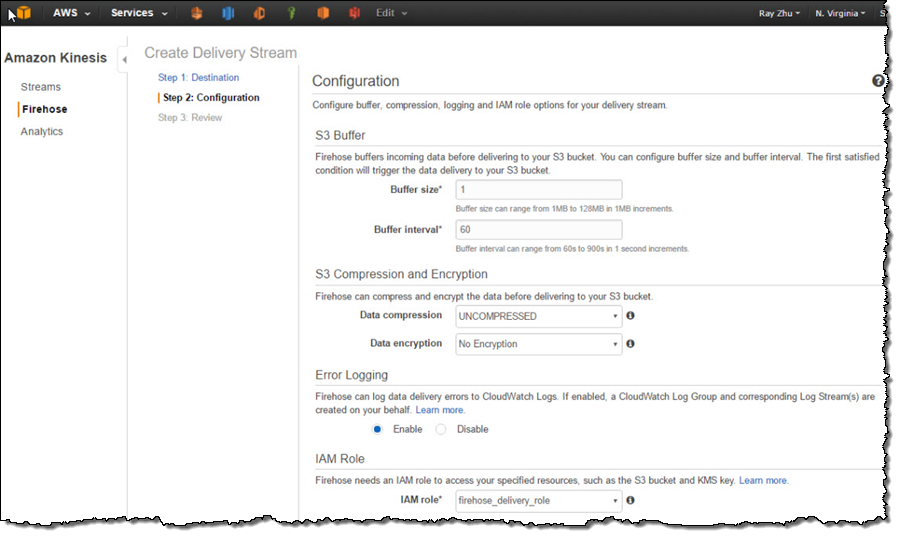
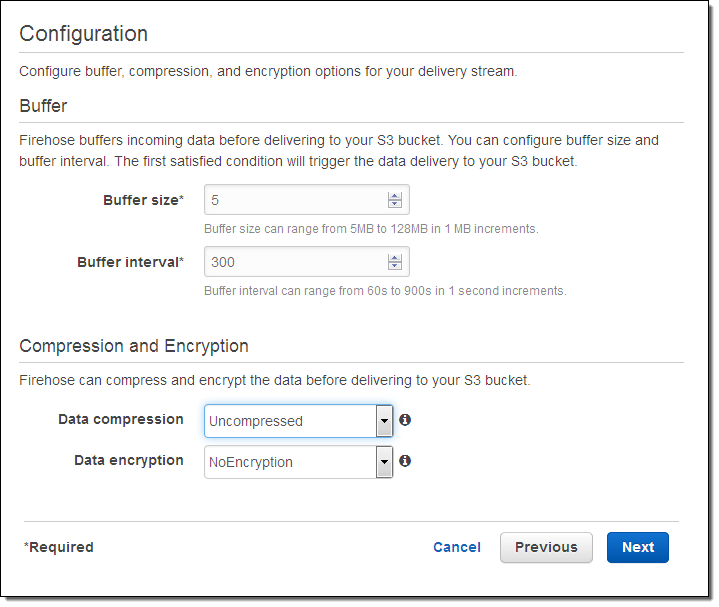
On the next page, I specify buffer size and buffer interval. Kinesis Firehose buffers streaming data to a certain size or for a certain period of time before loading it to S3. Kinesis Firehose’s buffering feature reduces S3 PUT requests and cost significantly and generates relatively larger S3 object size for efficient data load to Redshift. I’m using the smallest buffer size (1MB) and shortest buffer interval (60 seconds) in this example in order to have data delivered sooner.
You can also optionally configure Kinesis Firehose to compress the data in GZIP format before loading it to S3 and use a KMS key to encrypt the data in S3. In this example, I configure my data to be uncompressed and unencrypted. Please note that if you enable GZIP compression, you’ll also need to add “gzip” under Redshift COPY options.
I also enable error logging for Kinesis Firehose to log any delivery errors to my CloudWatch Log group. The error messages are viewable from Kinesis Firehose console as well and are particularly useful for troubleshooting purpose.
Finally, I configure a default IAM role to allow Kinesis Firehose to access the resources I configured in the delivery stream.
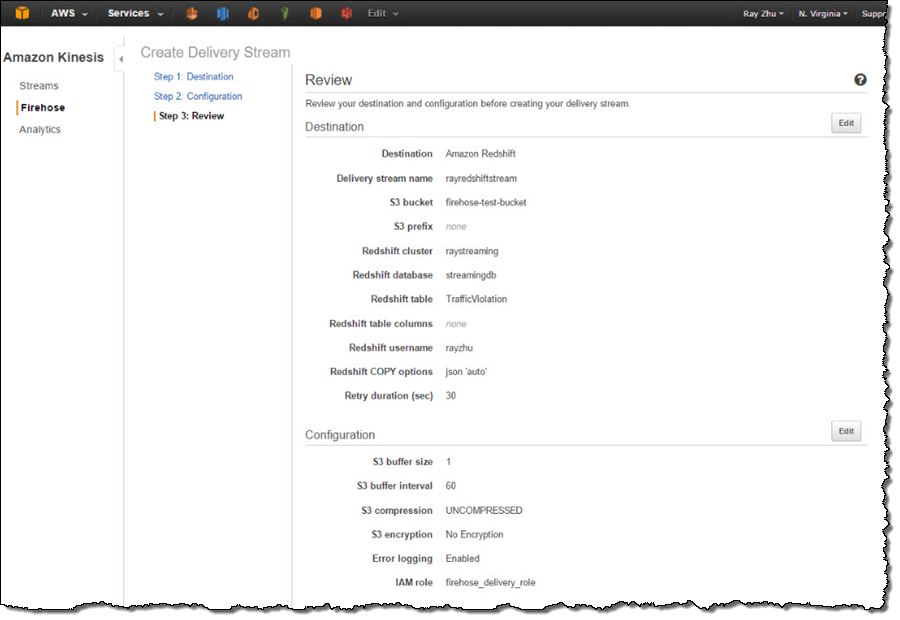
After reviewing all configurations, I click on “Create Delivery Stream”.
Step 3 Send data to Kinesis Firehose delivery stream
Now my Firehose delivery stream is set up and pointing to my Redshift table “TrafficViolation”. In this example, I’m using the Traffic Violations dataset from US Government Open Data. I use the Kinesis Firehose sample from AWS Java SDK to parse records from local csv file and send each record to my delivery stream.
In real streaming use cases, you can imagine that each data record is pushed to the delivery stream from police officer’s cellular devices through Firehose’s PutRecord() or PutRecordBatch() APIs as soon as a violation ticket is recorded.
A sample of the data looks like the following and includes information such as time of stop, vehicle type, driver gender, and so forth.
09/30/2014,23:51:00,MCP,"1st district, Rockville",\
  DRIVER FAILURE TO STOP AT STEADY CIRCULAR RED SIGNAL,\
  PARK RD AT HUNGERFORD DR,,,No,No,No,No,No,No,No,No,No,No,\
  MD,02 - Automobile,2014,FORD,MUSTANG,BLACK,Citation,21-202(h1),\
  Transportation Article,No,BLACK,M,ROCKVILLE,MD,MD,A - Marked Patrol,
Step 4 Visualize the data from QuickSight
As I continuously push data records to my delivery stream “rayredshiftstream”, I can see these data gets populated to my Redshift table “TrafficViolation” continuously.
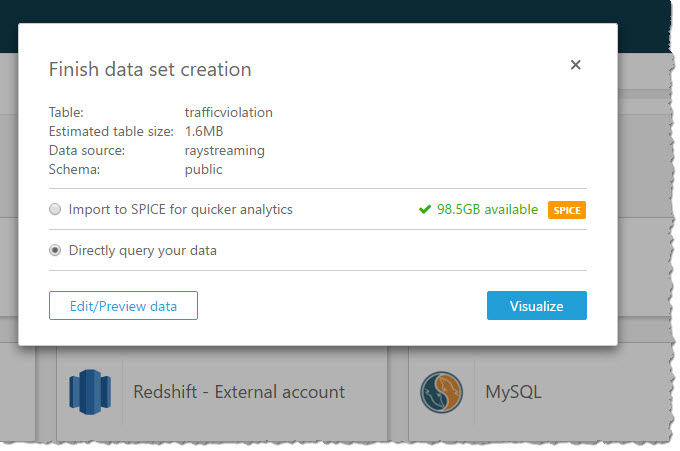
Now I’m going to use QuickSight to analyze and visualize the data from my Redshift table “TrafficViolation”. I create a new analysis and a new data set pointing to my Redshift table “TrafficViolation”.
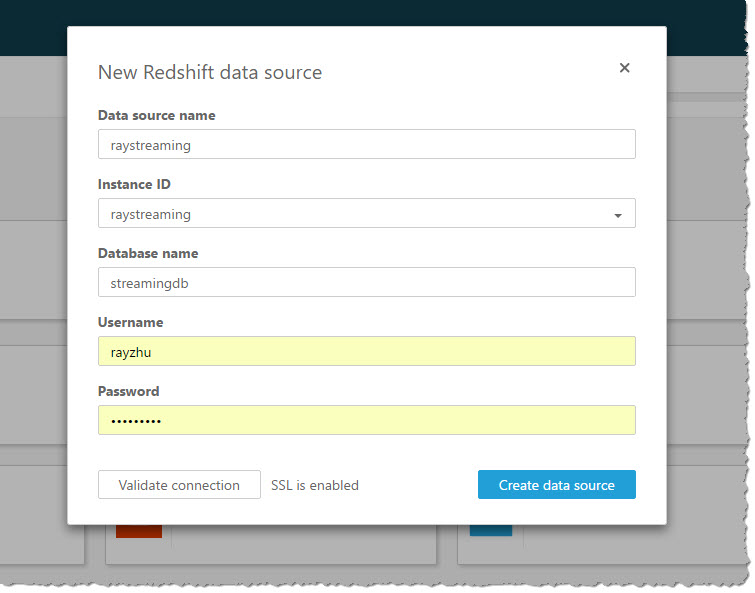
I use “Query” mode to directly retrieve data from my Redshift cluster so that new data is retrieved as they are continuously streamed from Kinesis Firehose.
With a few clicks, I create a bar chart graph that displays number of traffic violations by gender and hour of the day. There are a few interesting patterns: 1) Male drivers have significantly more traffic violations than female drivers during morning hours. 2) Noon has the lowest number of violations. 3) From 2pm to 4pm, the number of violations gap between male and female drivers narrows.
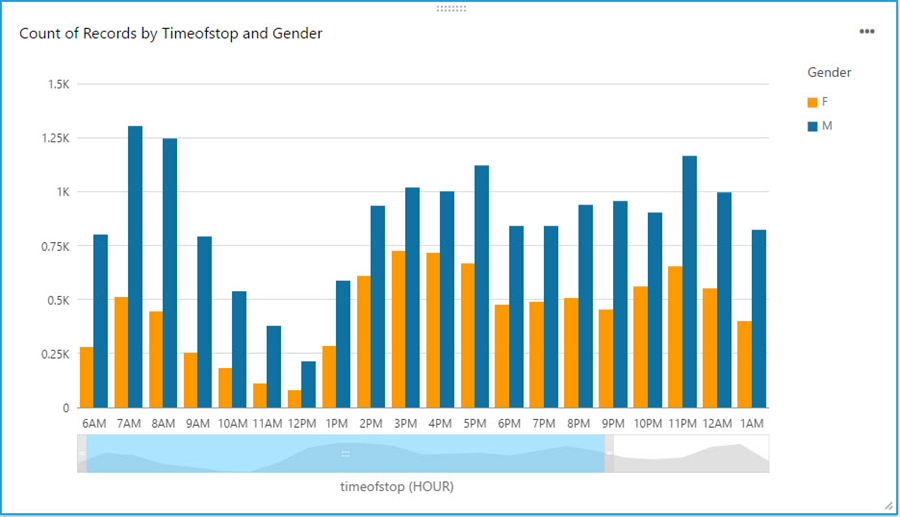
With a live dashboard, this graph will keep updating itself throughout the day as new data continuously gets streamed from police officer’s devices to Redshift through Kinesis Firehose. Another interesting live dashboard to build will be a map graph that shows a heat map of traffic violations across different districts of Maryland over time. I’ll leave this exercise to the readers of this blog and you can use your favorite Business Intelligent tools to do so.
That’s it!
Hopefully through reading this blog and trying it out yourself, you’ve got some inspirations about streaming data and a sense of how easy it is to get started with streaming data analytics on AWS. I cannot wait to see what streaming data analytics pipelines and applications you can build for your organizations!
-Ray Zhu
New – Sending Metrics for Amazon Simple Email Service (SES)
Amazon Simple Email Service (SES) focuses on deliverability – getting email through to the intended recipients. In my launch blog post (Introducing the Amazon Simple Email Service), I noted that several factors influence delivery, including the level of trust that you have earned with multiple Internet Service Providers (ISPs) and the number of complaints and bounces that you generate.
Today we are launching a new set of sending metrics for SES. There are two aspects to this feature:
Event Stream – You can configure SES to publish a JSON-formatted record to Amazon Kinesis Firehose each time a significant event (sent, rejected, delivered, bounced, or complaint generated) occurs.
Metrics – You can configure SES to publish aggregate metrics to Amazon CloudWatch. You can add one or more tags to each message and use them as CloudWatch dimensions. Tagging messages gives you the power to track deliverability based on campaign, team, department, and so forth. You can then use this information to fine-tune your messages and your email strategy.
To learn more, read about Email Sending Metrics on the Amazon Simple Email Service Blog.
— Jeff;
Streaming Real-time Data into an S3 Data Lake at MeetMe
In today’s guest post, Anton Slutsky of MeetMe describes the implementation process for their Data Lake.
— Jeff;

Modern Big Data systems often include structures called Data Lakes. In the industry vernacular, a Data Lake is a massive storage and processing subsystem capable of absorbing large volumes of structured and unstructured data and processing a multitude of concurrent analysis jobs. Amazon Simple Storage Service (S3) is a popular choice nowadays for Data Lake infrastructure as it provides a highly scalable, reliable, and low-latency storage solution with little operational overhead. However, while S3 solves a number of problems associated with setting up, configuring and maintaining petabyte-scale storage, data ingestion into S3 is often a challenge as types, volumes, and velocities of source data differ greatly from one organization to another.
In this blog, I will discuss our solution, which uses Amazon Kinesis Firehose to optimize and streamline large-scale data ingestion at MeetMe, which is a popular social discovery platform that caters to more than a million active daily users. The Data Science team at MeetMe needed to collect and store approximately 0.5 TB per day of various types of data in a way that would expose it to data mining tasks, business-facing reporting and advanced analytics. The team selected Amazon S3 as the target storage facility and faced a challenge of collecting the large volumes of live data in a robust, reliable, scalable and operationally affordable way.
The overall aim of the effort was to set up a process to push large volumes of streaming data into AWS data infrastructure with as little operational overhead as possible. While many data ingestion tools, such as Flume, Sqoop and others are currently available, we chose Amazon Kinesis Firehose because of its automatic scalability and elasticity, ease of configuration and maintenance, and out-of-the-box integration with other Amazon services, including S3, Amazon Redshift, and Amazon Elasticsearch Service.
Business Value / Justification
![]() As it is common for many successful startups, MeetMe focuses on delivering the most business value at the lowest possible cost. With that, the Data Lake effort had the following goals:
As it is common for many successful startups, MeetMe focuses on delivering the most business value at the lowest possible cost. With that, the Data Lake effort had the following goals:
- Empowering business users with high-level business intelligence for effective decision making.
- Enabling the Data Science team with data needed for revenue generating insight discovery.
When considering commonly used data ingestion tools, such as Scoop and Flume, we estimated that, the Data Science team would need to add an additional full-time BigData engineer in order to set up, configure, tune and maintain the data ingestion process with additional time required from engineering to enable support redundancy. Such operational overhead would increase the cost of the Data Science efforts at MeetMe and would introduce unnecessary scope to the team affecting the overall velocity.
Amazon Kinesis Firehose service alleviated many of the operational concerns and, therefore, reduced costs. While we still needed to develop some amount of in-house integration, scaling, maintaining, upgrading and troubleshooting of the data consumers would be done by Amazon, thus significantly reducing the Data Science team size and scope.
Configuring an Amazon Kinesis Firehose Stream
Kinesis Firehose offers the ability to create multiple Firehose streams each of which could be aimed separately at different S3 locations, Redshift tables or Amazon Elasticsearch Service indices. In our case, our primary goal was to store data in S3 with an eye towards other services mentioned above in the future.
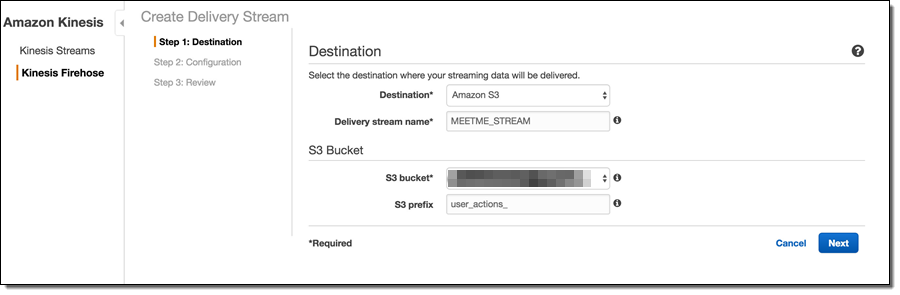
Firehose delivery stream setup is a 3-step process. In Step 1, it is necessary to choose the destination type, which lets you define whether you want your data to end up in an S3 bucket, a Redshift table or an Elasticsearch index. Since we wanted the data in S3, we chose “Amazon S3” as the destination option. If S3 is chosen as the destination, Firehose prompts for other S3 options, such as the S3 bucket name. As described in the Firehose documentation, Firehose will automatically organize the data by date/time and the “S3 prefix” setting serves as the global prefix that will be prepended to all S3 keys for a given Firehose stream object. It is possible to change the prefix at a later date even on a live stream that is in the process of consuming data, so there is little need to overthink the naming convention early on.
The next step of the process is the stream configuration. Here, it is possible to override various defaults and specify other meaningful values. For example, selecting GZIP compression instead of the uncompressed default will greatly reduce the S3 storage footprint and, consequently, the S3 costs. Enabling Data encryption will encrypt the data at rest, which is important for sensitive data.
One important note is that the choice of the compression algorithm affects the resulting filenames (S3 keys) for the stream objects. Therefore, while it is possible to change these settings later on a live stream, it may be prudent to settle on the compression/encryption approach early to avoid possible issues with processing scripts.
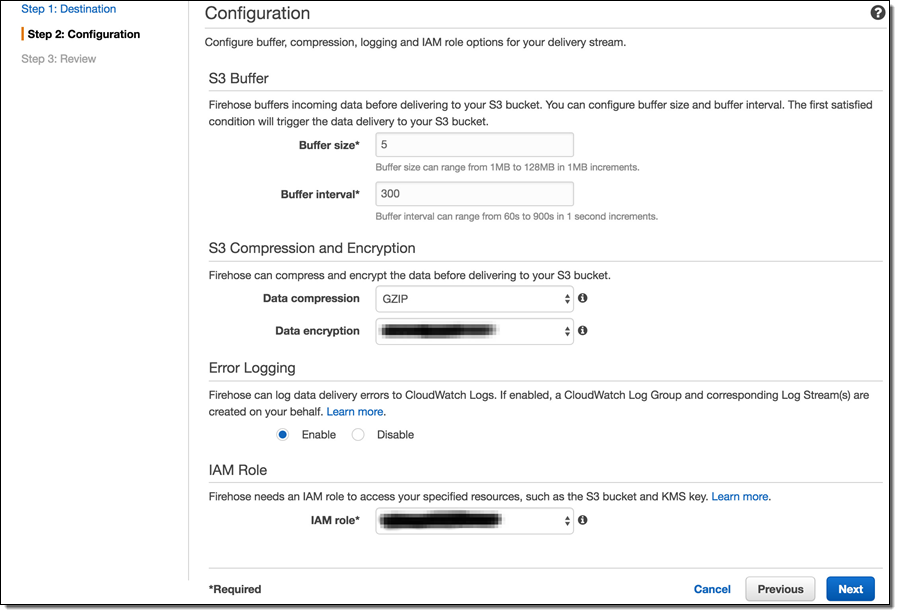
As mentioned in Amazon Kinesis Firehose Limits, Kinesis Firehose has a set of default throughput quotas. Once those quotas are exceeded, Firehose will respond with an error message “ServiceUnavailableException: Slow down.” and will drop data. Therefore, in order to avoid data loss, it is important to estimate individual throughput requirements. If those requirements are likely to exceed the default quotas, it is possible to request additional throughput by submitting a limit increase request as described in the limits.
The final step (not shown) is to review the desired configuration and create the stream.
Setting up the Upload Process
At MeetMe, RabbitMQ serves as a service bus for most of the data that flows through the system. Therefore, the task of data collection for the most part amounts to consuming large volumes of RabbitMQ messages and uploading them to S3 with the help of Firehose streams. To accomplish this, we developed lightweight RabbitMQ consumers. While RabbitMQ consumers are implemented elsewhere (such as Flume), we opted to develop our own versions to enable integration with Firehose API.
Firehose provides two ways of upload data – single record and bulk. With the single record approach, each individual record is packaged into Amazon Firehose API framework objects and each object is serialized to a Firehose end-point via HTTP/Rest. While this approach may be appropriate for some applications, we achieved better performance by using the bulk API methods. The bulk methods allow up to 500 records to be uploaded to Firehose with a single request.
To upload a batch of messages, the lightweight RabbitMQ consumer maintains a small internal buffer, which gets serialized to Firehose as often as possible by a predefined set of processor threads. Here’s the code:
new Thread(new Runnable()
{
  public void run()
  {
    logger.info("Kinesis writer thread started.  Waiting for records to process...");
    while(true)
    {
      try
      {
        if(!recordsQueue.isEmpty())
        {
           if(logger.isDebugEnabled())
             logger.debug("Uploading current batch to AWS: "+recordsQueue.size());

           List<MMMessage> records = recordsQueue;
           recordsQueue = new CopyOnWriteArrayList<MMMessage>();

           final int uploadThreshold = 499;

           List<Record> buffer = new ArrayList<Record>(uploadThreshold);

           for(int i = 0; i < records.size(); i++)
           {
             // Get a proprietary message object from an internal queue
             MMessage mmmessage = records.get(i);

             // Get the bytes
             String message = new String(mmmessage.body, "UTF-8");

             // Check for new line and tab characters in data to avoid
             // issues with Hadoop/Spark processing line-based processing
             // later on
             message = CharMatcher.anyOf("\n").replaceFrom(message, "\\n");
             message = CharMatcher.anyOf("\t").replaceFrom(message, "\\t");

             // Wrap the message bytes with Amazon Firehose API wrapper
             Record record = new Record().withData(ByteBuffer.wrap(message.getBytes()));

             buffer.add(record);

             // If the current buffer is large enough,
             if(buffer.size() == uploadThreshold)
             {
               // send it to Firehose
               uploadBuffer(buffer);
               // and instantiate a new buffer
               buffer = new ArrayList<Record>(uploadThreshold);
             }
           }
           // don't forget to upload last buffer!
           uploadBuffer(buffer);
         }
       }
       catch(Exception e)
      {
        logger.error("Error in sending to Kinesis:"+e.getMessage(), e);
      }
    }
  }
}).start();
The uploadBuffer method is a simple wrapper over the bulk upload Firehose API:
private void uploadBuffer(final List<Record> buffer)
{
  // Make a new request object
  PutRecordBatchRequest request = new PutRecordBatchRequest();
  // Specify the stream name
  request.setDeliveryStreamName("MEETME_STREAM");

  // Set the data buffer
  request.setRecords(buffer);

  // Attempt to send to Firehose
  PutRecordBatchResult result = getAmazonClient().putRecordBatch(request);

  // Always check for failures!
  Integer failed = result.getFailedPutCount();
  if (failed != null && failed.intValue() > 0)
  {
    // If there are failures, find out what caused them
    logger.warn("AWS upload of [" + buffer.size() + "] resulted in " + failed + " failures");

    // Dig into the responses to see if there are various kinds of failures
    List<PutRecordBatchResponseEntry> res = result.getRequestResponses();
    if (res != null)
    {
      for (PutRecordBatchResponseEntry r : res)
      {
        if (r != null)
        {
          logger.warn("Report " + r.getRecordId() + ", " + r.getErrorCode() + ", " + r.getErrorMessage()
                      + ", " + r.toString());
        }
        else
        {
          logger.warn("Report NULL");
        }
      }
    }
    else
    {
      logger.warn("BatchReport NULL");
    }
  }
}
Monitoring Firehose Streams
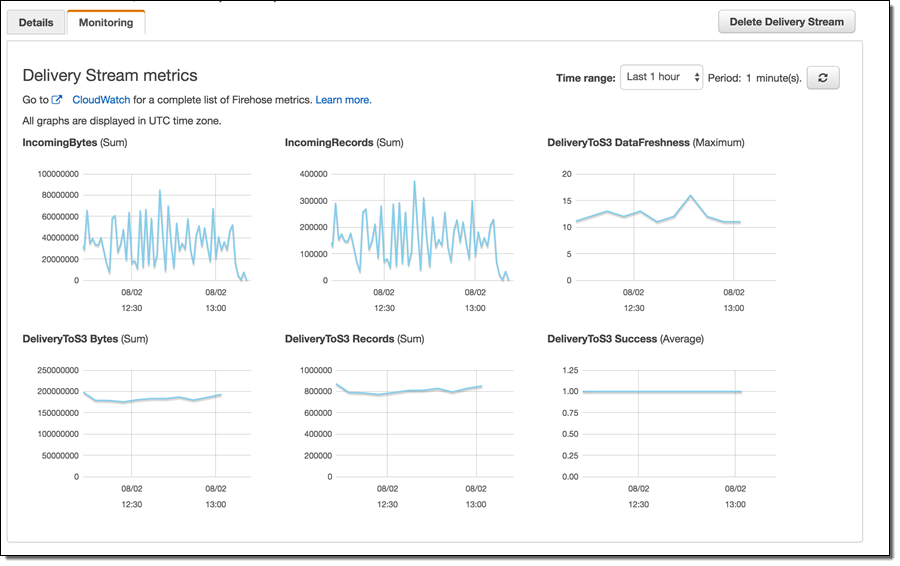
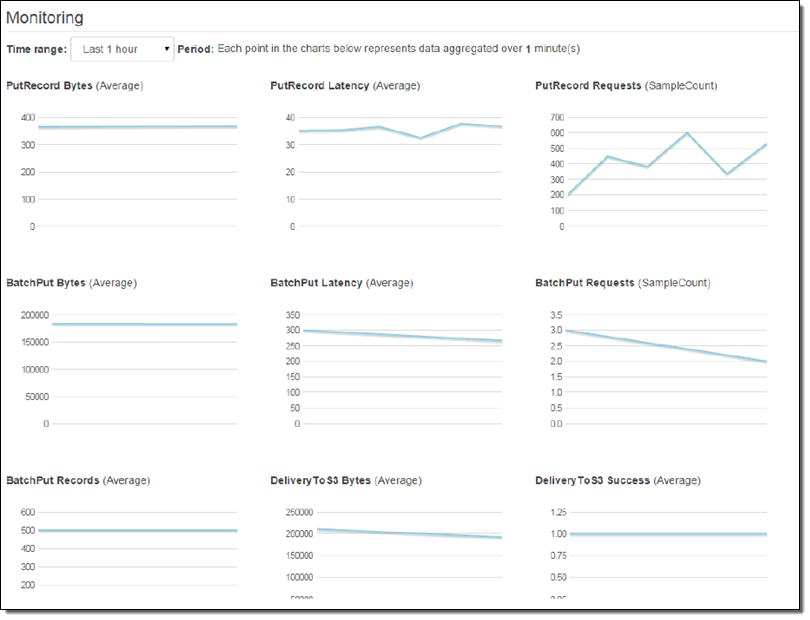
Once the Firehose streams are set up and internal consumer processes begin to send data, a common task is to attempt to monitor the data flow. Some of the reasons for paying attention to data flow are data volume considerations, potential error conditions, capturing failures among many others. With Amazon Firehose, monitoring is accomplished with the help of Amazon CloudWatch. Common delivery stream metrics are available under the Monitoring tab in each Firehose stream configuration with additional metrics available through the CloudWatch Console.
While AWS provides an extensive set of monitoring facilities, in our experience it turned out to be important to carefully monitor internal data producer logs for errors. Such close monitoring using the syslog facility, Splunk, and other log monitoring tools allowed us to capture and fix specific errors and reduce the number of individual record failures to tolerable levels. Further, internal log monitoring allowed us to recognize early that our volumes were quickly exceeding default Firehose throughput quotas (see above).
Anton Slutsky, Director of Data Science, MeetMe
Amazon Kinesis Analytics – Process Streaming Data in Real Time with SQL
As you may know, Amazon Kinesis greatly simplifies the process of working with real-time streaming data in the AWS Cloud. Instead of setting up and running your own processing and short-term storage infrastructure, you simply create a Kinesis Stream or Kinesis Firehose, arrange to pump data in to it, and then build an application to process or analyze it.
While it is relatively easy to build streaming data solutions using Kinesis Streams and Kinesis Firehose, we want to make it even easier. We want you, whether you are a procedural developer, a data scientist, or a SQL developer, to be able to process voluminous clickstreams from web applications, telemetry and sensor reports from connected devices, server logs, and more using a standard query language, all in real time!
Amazon Kinesis Analytics
 Today I am happy to be able to announce the availability of Amazon Kinesis Analytics. You can now run continuous SQL queries against your streaming data, filtering, transforming, and summarizing the data as it arrives. You can focus on processing the data and extracting business value from it instead of wasting your time on infrastructure. You can build a powerful, end-to-end stream processing pipeline in 5 minutes without having to write anything more complex than a SQL query.
When I think of running a series of SQL queries against a database table, I generally think of the data as staying more or less static while the queries come and go pretty quickly. Rows are added, changed, and deleted all the time, but this does not generally matter when considering a single query that runs at a particular point in time. Running a Kinesis Analytics query against streaming data turns this model sideways. The queries are long-running and the data changes many times per second as new records, observations, or log entries arrive. Once you wrap your head around this, you will see that the query processing model is very easy to understand: You build persistent queries that process records as they arrive.
In order to control the set of records that will be processed by a given query, you make use of a processing “window.” Kinesis Analytics supports three different types of windows:
Tumbling windows are used for periodic reports. You could use a tumbling window to summarize data over time. Perhaps you get thousands or millions of requests per second, and would like to know how many arrive each minute. When the current tumbling window closes, the next one begins after it. A new result is generated each time the window fills up.
Sliding windows are used for monitoring and other types of trend detection. For example, you could use a sliding window to compute a real-time moving average for an error rate. Records enter the window, contribute to the result as long as they are within it, and the window advances. A new result is generated each time a new record enters the window. You can adjust the size of the window to control the sensitive of the results.
Custom windows are used when the appropriate grouping is not strictly based on time. If you are processing clickstream data or server logs, you can use a custom window to perform an action known as sessionization. In other words, you can bound each query by the first and last actions performed by each user, as identified by a session identifier within the incoming data. You can write a query that computes the number of pages visited by each user or the time that they spend on your site.
While all of this might sound somewhat complicated, it is actually pretty easy to implement. Kinesis Analytics will analyze a sample of the incoming records and then propose a suitable schema. You can use it as-is, or you can fine-tune it to better reflect your actual data model. Once the schema has been defined, you can use the built-in SQL editor (complete with syntax checking and easy testing against live data). You can configure Kinesis Analytics to route the results of the query to up to four destinations including Amazon S3, Amazon Redshift, Amazon Elasticsearch Service, or an Amazon Kinesis Stream.
When you build your first Amazon Kinesis Analytics application you need to write a pair of cooperating SQL statements (more complex applications can use more, but all it takes is two to get up and running):
A statement to create an in-application stream to store intermediate SQL results (a stream is a like a SQL table that is continuously updated, which you can select from and insert into).
Your SQL query, which selects from one in-application stream and inserts into another in-application stream.
Your SQL statements can also JOIN the records to reference data that originates in S3. This can be handy when you want to enhance or modify the records to include additional, perhaps more descriptive, information.
Amazon Kinesis Analytics in Action
Let’s spend a few minutes looking at Amazon Kinesis Analytics in action!
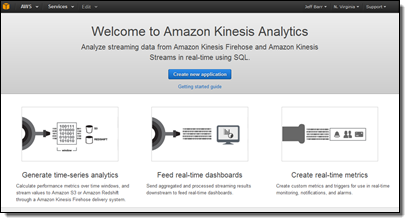
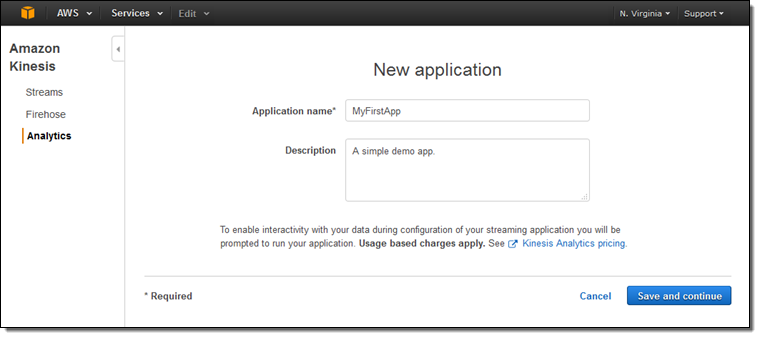
I log in to the Amazon Kinesis Analytics Console and clicking on Create new application. Then I enter a name and a description for my app:
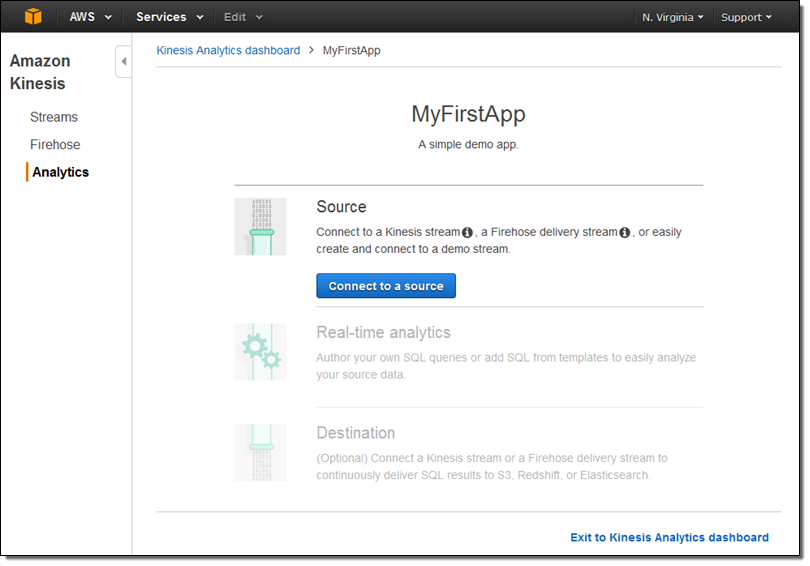
Now I can manage my data source, my queries, and the destination(s):
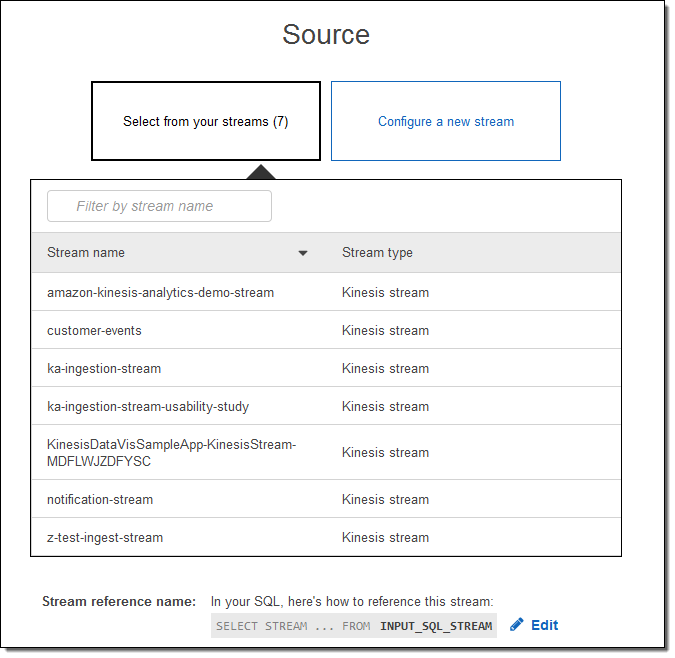
I can select one of my existing input streams:
Or I can configure a new one (I’ll do that):
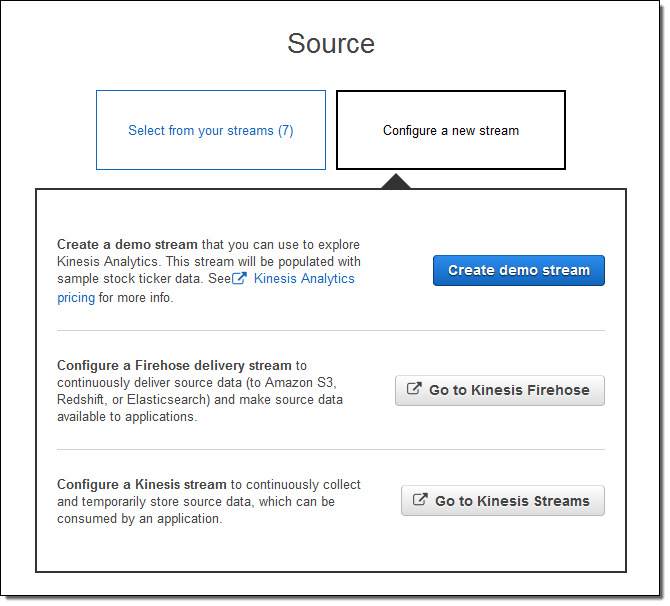
I click on Create demo stream to create a stream that will be populated with sample stock ticker data. This takes 30 to 40 seconds!
Kinesis Analytics peeks at the stream and proposes a schema. I can accept it as-is or fine tune it:
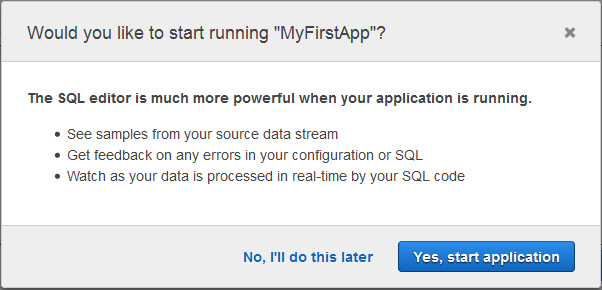
Then I hop over to the SQL editor. It offers to start my app. That seems like a good idea, so I agree and click on Yes, start application:
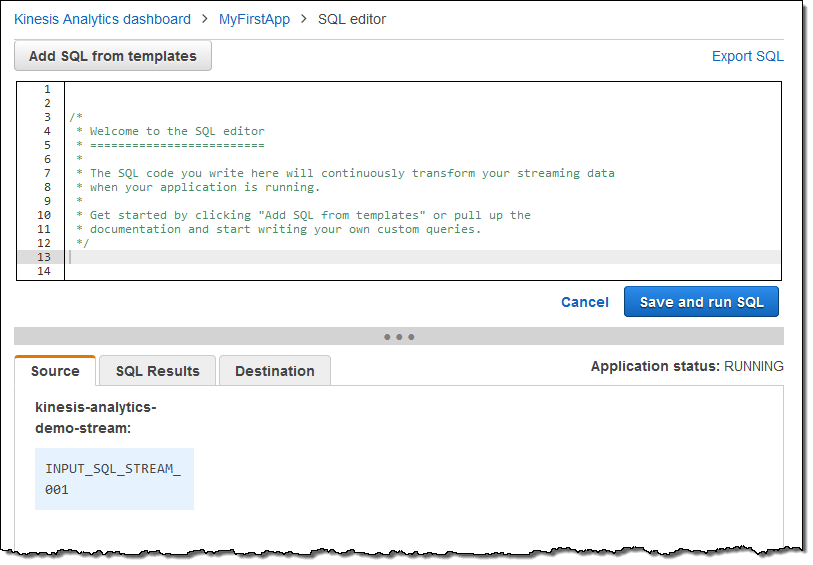
Here’s the actual SQL editor:
I can write my query from scratch or I can use a template:
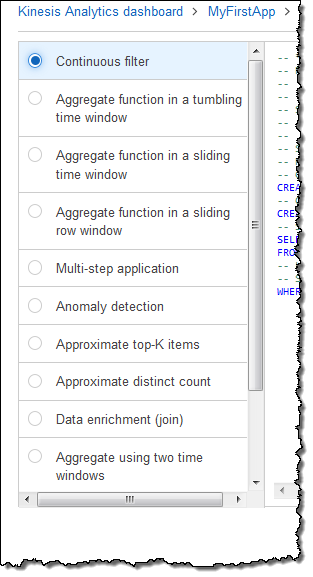
I picked Continuous filter; here’s the SQL:
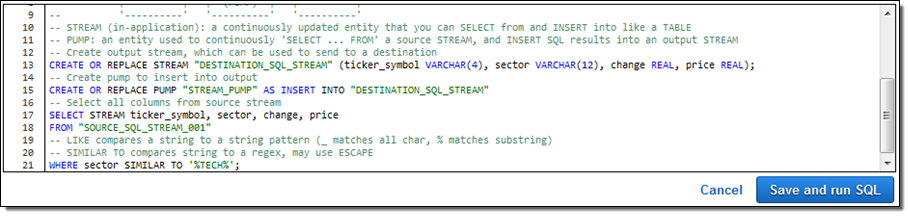
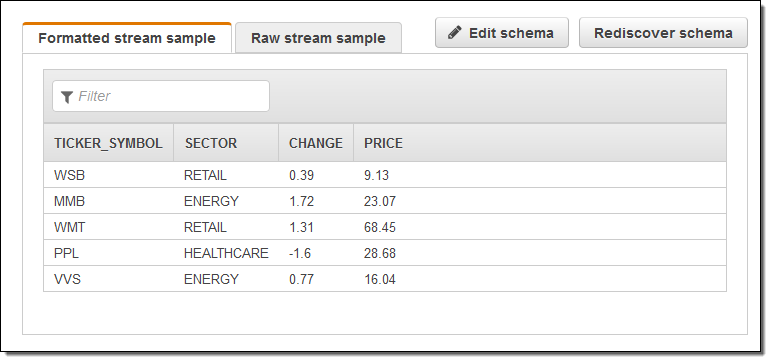
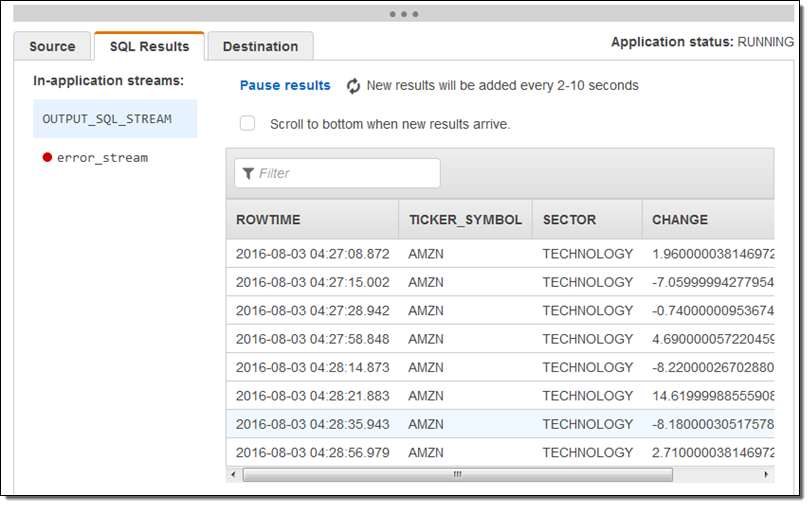
I inspected it, nodded in agreement, and then clicked on Save and run SQL. Within seconds, results began to flow in and were visible in the Console:
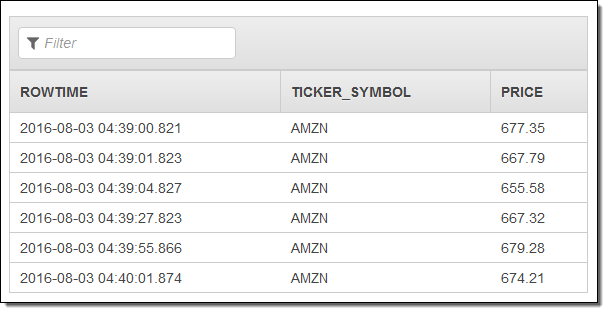
I used the SQL editor to modify the query to remove the sector and price columns and ran the query again. When I did this I learned that I needed to remove the columns from the CREATE STREAM statement (this is obvious in retrospect but it was the end of a long day).
Here’s the revised result set:
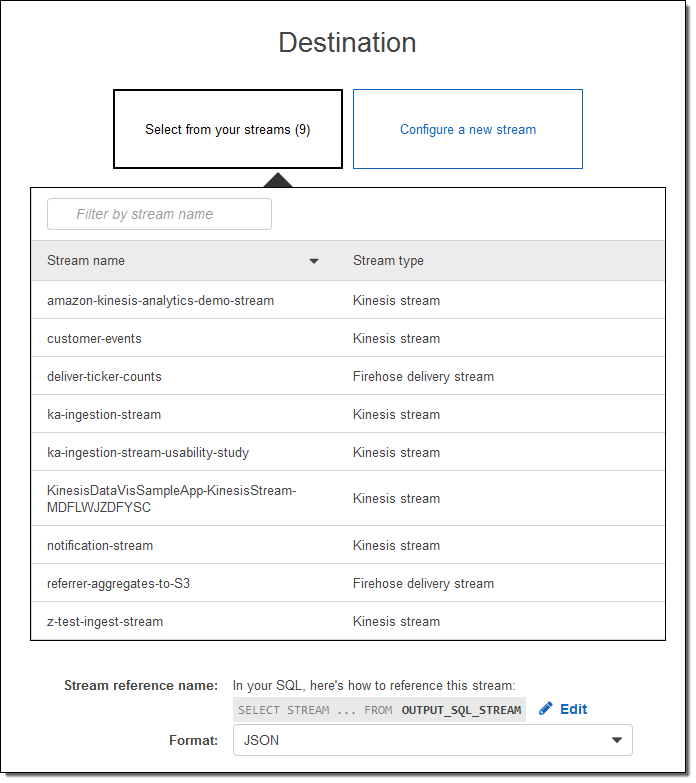
In most cases the next step would be to route the results to a new or existing stream. I can do that from the Console:
With just a couple of clicks and a little bit of typing, I have created an Amazon Kinesis Analytics app that is capable of process a production-scale stock ticker stream. This “demo” needs no changes whatsoever before being used in production. I think that’s kind of cool.
Learn More & Try it Yourself
As usual, I have barely scratched the surface of this exciting new service! To learn more, you should read the new post, Writing SQL on Streaming Data with Amazon Kinesis Analytics.
You should be able to replicate my steps above in 5 minutes or less and I strongly recommend that you do so. Create your application, customize the SQL query, and learn how to process streaming data at scale.
Available Now
Amazon Kinesis Analytics is available now and you can start running queries against your streaming data today!
— Jeff;
Amazon Kinesis Update – Amazon Elasticsearch Service Integration, Shard-Level Metrics, Time-Based Iterators
Amazon Kinesis makes streaming data easy in the cloud.The Amazon Kinesis platform is comprised of three distinct services: Kinesis Streams allows developers to build their own stream processing applications; Kinesis Firehose simplifies the process of loading streaming data into AWS for storage and analytics; Kinesis Analytics supports the analysis of streaming data using standard SQL queries.
Many AWS customers use Kinesis Streams and Kinesis Firehose as a component of their real-time streaming data ingestion and processing systems. They appreciate the ease of use that comes with a fully managed service, and invest their development time in their application instead of spending time managing their own streaming data infrastructure.
Today we are announcing three new features for Amazon Kinesis Streams and Amazon Kinesis Firehose:
- Elasticsearch Integration – Amazon Kinesis Firehose can now stream data to an Amazon Elasticsearch Service cluster.
- Enhanced Metrics – Amazon Kinesis now sends shard-level metrics to CloudWatch each minute.
- Flexibility – Amazon Kinesis now allows you to retrieve records using time-based shard iterators.
Amazon Elasticsearch Service Integration
Elasticsearch is a popular open-source search and analytics engine. Amazon Elasticsearch Service is a managed service that makes it easy for you to deploy, run, and scale Elasticsearch in the AWS Cloud. You can now arrange to deliver your Kinesis Firehose data stream to an Amazon Elasticsearch Cluster. This will allow you to index and analyze server logs, clickstreams, and social media traffic.
The incoming records (Elasticsearch documents) are buffered in Kinesis Firehose according to a configuration that you specify, and then automatically added to the cluster using a bulk request that indexes multiple documents simultaneously. The data must be UTF-8 encoded and flattened into single JSON object before it is sent to Firehose (see my recent blog post, Amazon Kinesis Agent Update – New Data Preprocessing Feature, to learn more about how to do this).
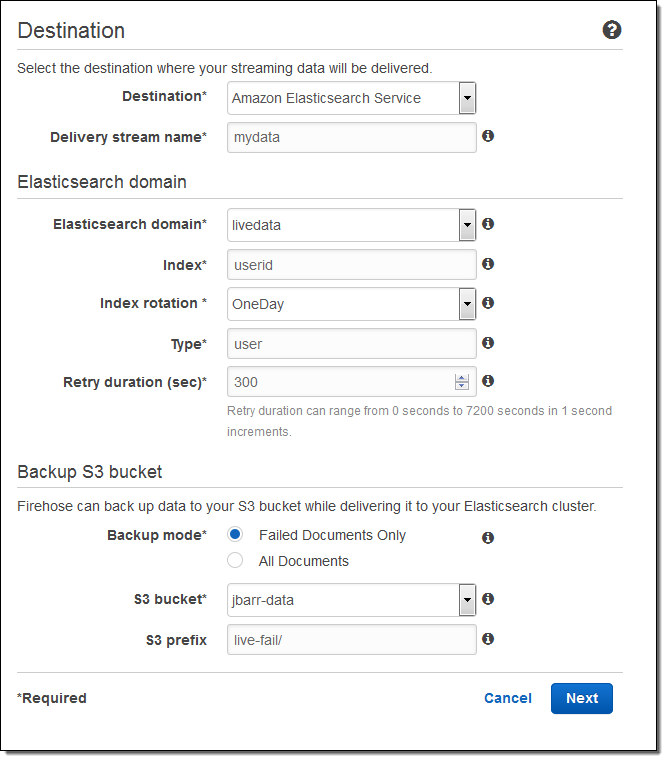
Here’s how to set this up using the AWS Management Console. I choose the destination (Amazon Elasticsearch Service) and set the delivery stream name, then I choose one of my Elasticsearch domains (livedata in this example), set up the index, and choose the index rotation (none, hourly, daily, weekly, or monthly). I also designate an S3 bucket that will receive a backup of either all documents or failed documents (my choice):
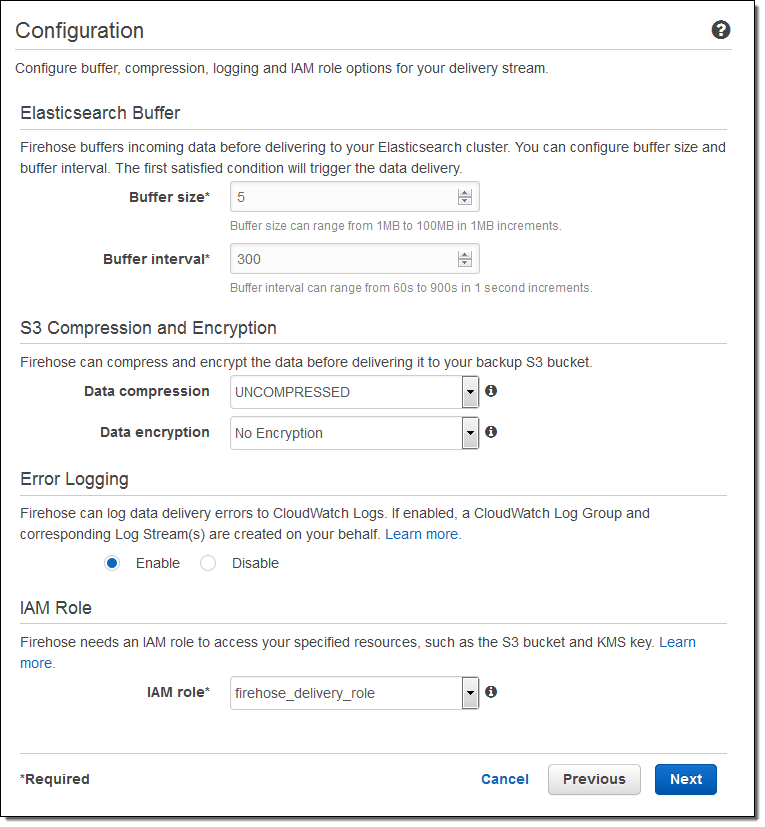
Then I set the buffer size, choose some compression and encryption options for the data that will be sent to my S3 bucket, set up logging (if desired), and pick an appropriate IAM role:
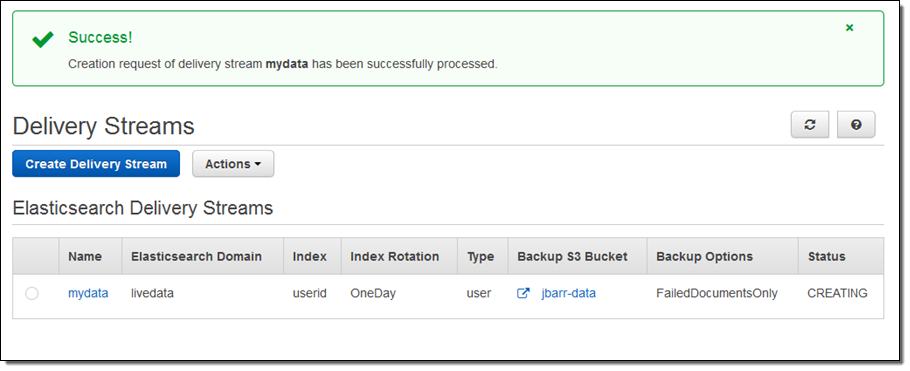
The stream will be ready for use in a minute or so:
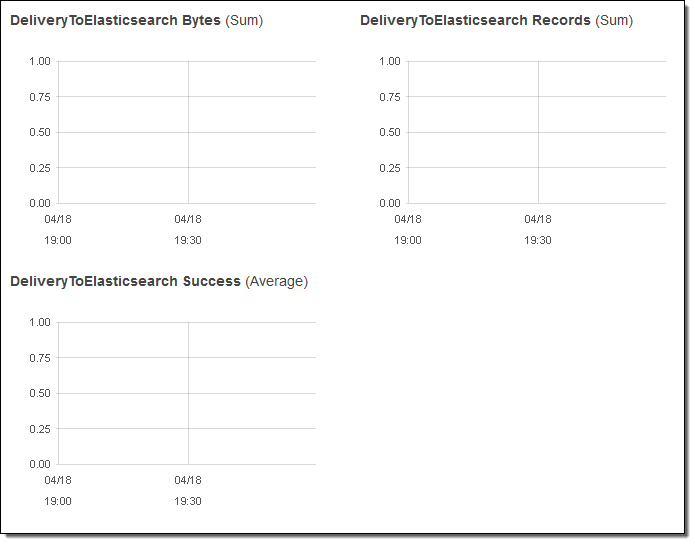
I can view the delivery metrics in the Console:
Once the data starts to arrive in Elasticsearch I can explore it visually using Kibana or by writing queries in the Elasticsearch query language.
Putting this all together, this integration greatly simplifies the process of capturing and delivering your streaming data to your Elasticsearch cluster. There’s no need to write any code or to build your own data ingestion tools.
Shard-Level Metrics
Each Kinesis stream is composed of one or more shards, each of which provides a fixed amount of read and write capacity. Each time you add a shard to a stream, you increase the capacity of the stream.
In order to provide you with increased visibility into the performance of each shard, you can now enable a set of shard-level metrics. There are 6 metrics per shard, each reported once per minute and charged at the usual per-metric CloudWatch pricing. These metrics will allow you to see if a particular shard is running hotter than the others and to locate and root out any inefficiencies in your end-to-end streaming data delivery pipeline. For example, you can identify the shard(s) that are receiving records at a rate too high too handle and the shard(s) that are being read by applications at lower throughput than expected.
Here are the new metrics:
IncomingBytes – The number of bytes that have been successfully PUT to the shard.
IncomingRecords – The number of records that have been successfully PUT to the shard.
IteratorAgeMilliseconds – The age (in milliseconds) of the last record returned by a GetRecords call against a shard. A value of 0 means that the records being read are completely caught up with the stream.
OutgoingBytes – The number of bytes that have been retrieved from the shard.
OutgoingRecords – The number of records that have been retrieved from the shard.
ReadProvisionedThroughputExceeded -The number of GetRecords calls that have been throttled for exceeding the 5 reads per second or 2 MB per second shard limits.
WriteProvisionedThroughputExceeded – The number of records that have been rejected due to throttling for exceeding the 1000 records per second or 1 MB per second shard limits.
You can enable these metrics by calling the EnableEnhancedMonitoring function. As always, you can use the CloudWatch APIs to aggregate them across any desired time period.
Time-Based Iterators
Your application reads data from a Kinesis stream by creating an iterator on the desired shard using the GetShardIterator function and specifying the desired starting point. In addition to the existing starting point options (at or after a sequence number, oldest record, or newest record) you can now specify a timestamp. The value (specified in Unix epoch format) indicates the timestamp of the oldest record that you would like to read and process.
— Jeff;
Amazon Kinesis Agent Update – New Data Preprocessing Features
My colleague Ray Zhu wrote the guest post below to introduce you to some new data preprocessing features for the Amazon Kinesis Agent.
— Jeff;
Amazon Kinesis Agent is a stand-alone Java software application that provides an easy and reliable way to send data to Amazon Kinesis Streams and Amazon Kinesis Firehose. The agent monitors a set of files for new data and then sends it to Kinesis Streams or Kinesis Firehose continuously. It handles file rotation, checkpointing, and retrial upon failures. It also supports Amazon CloudWatch so that you can closely monitor and troubleshoot the data flow from the agent.
Data Preprocessing with Kinesis Agent
Today we are adding data preprocessing capabilities to the agent so that your data can be well formatted before it is sent to Kinesis Streams or Kinesis Firehose. The agent currently supports the three processing options listed below. Because the agent is open source, you can further develop and extend these processing options.
SINGLELINE – This option converts a multi-line record to a single line record by removing newline characters, and leading and trailing spaces.
CSVTOJSON – This option converts a record from delimiter separated format to JSON format.
LOGTOJSON – This option converts a record from several commonly used log formats to JSON format. Currently supported log formats are Apache Common Log, Apache Combined Log, Apache Error Log, and RFC3164 (syslog).
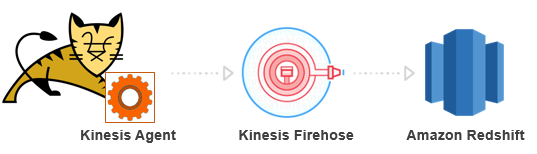
Analyze Apache Tomcat Access Log in Near Real-Time
Let’s look at an example of analyzing Tomcat access logs in near real-time using Kinesis Agent’s preprocessing feature, Amazon Kinesis Firehose, and Amazon Redshift. Here’s the overall flow:
First I need to create a table in my Redshift cluster to store the Tomcat access log. The following SQL statement is used to create the table:
CREATE TABLE logs(
host VARCHAR(40),
ident VARCHAR(25),
authuser VARCHAR(25),
datetime VARCHAR(60),
request VARCHAR(2048),
response SMALLINT NOT NULL,
bytes INTEGER,
referer VARCHAR(2048),
agent VARCHAR(256));
Then I need to create a Kinesis Firehose delivery stream that continuously delivers data to the Redshift table created above:
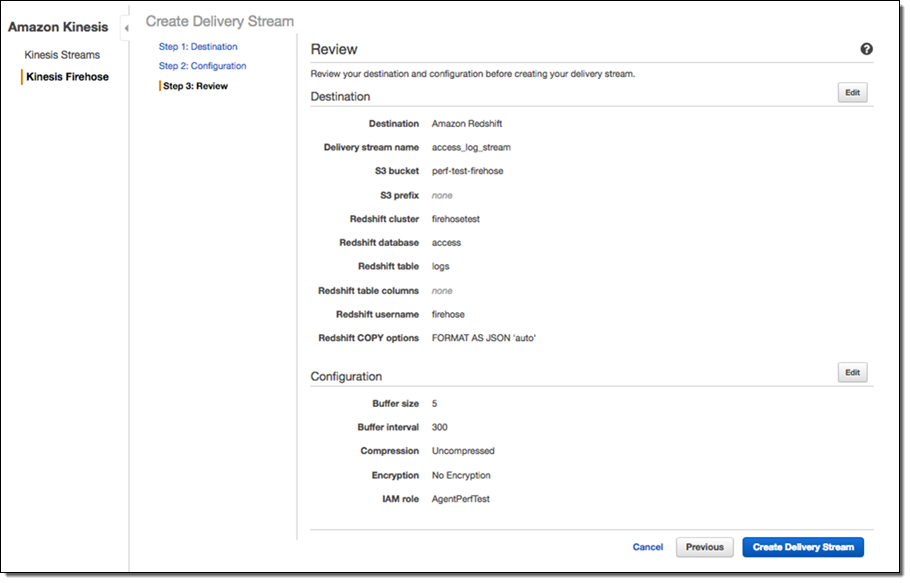
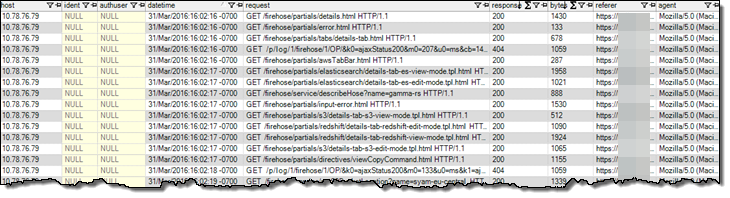
Now I’ve set up my Redshift table and Firehose delivery stream. Next I need to install the Kinesis Agent on my Tomcat server to monitor my Tomcat access log files and continuously send the log data to my delivery stream. Here is a screenshot of the raw Tomcat access log:
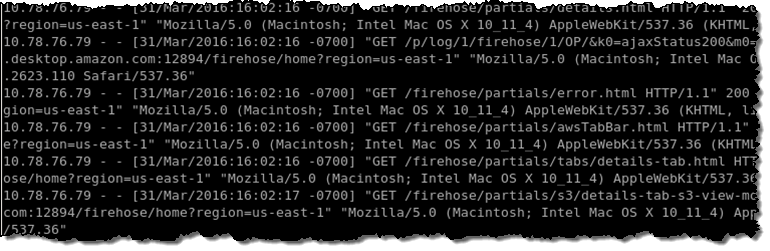
In the agent configuration, I use the LOGTOJSON processing option to convert raw Tomcat access log data to JSON format before sending the data to my delivery stream. Here’s how I set that up:
{
"cloudwatch.emitMetrics":true,
"flows":[
{
"filePattern":"/data/access.log*",
"deliveryStream":"access_log_stream",
"initialPosition":"START_OF_FILE",
"dataProcessingOptions":[
{
"optionName":"LOGTOJSON",
"logFormat":"COMBINEDAPACHELOG"
}
]
}
]
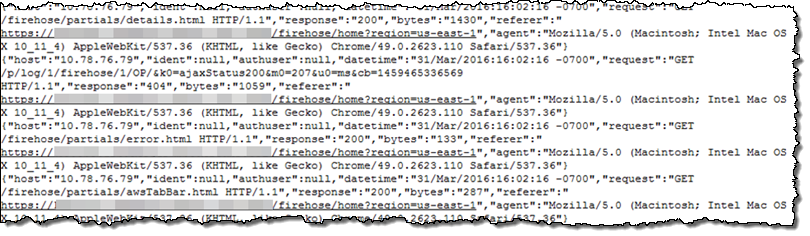
}Everything is set up now and let’s start the agent! After a minute or two, my Tomcat access log data shows up in my S3 bucket and Redshift table. Here is how the data looks like in my S3 bucket. Notice that the raw log data has been nicely formatted as JSON:
Here is how the data looks like in my Redshift table:
I can run SQL queries to analyze my Tomcat access log, or use the Business Intelligence tool of my choice to visualize the data:
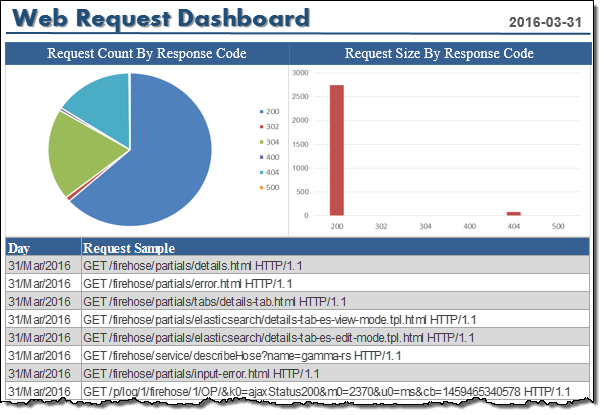
It took me less than an hour to set up the whole data pipeline. Now I can analyze and visualize access log data using my favorite Business Intelligence tool, only minutes after the data is generated on my Tomcat server!
Available Now
Kinesis Agent’s data preprocessing feature is available now and you can start using it today – visit the Amazon Kinesis Agent Repository! To learn more, read Use Agent to Preprocess Data in the Kinesis Firehose Developer Guide.
— Ray Zhu, Senior Product Manager
Learn About the newest AWS Services – Attend our October Webinars
If you attended AWS re:Invent, you were among the first to know about Amazon QuickSight, AWS IoT, Kinesis Firehose, and our other new offerings. Perhaps you had time to attend a session to learn more about the new service or services that were of interest to you. If you didn’t attend re:Invent or missed a session or two and are ready to learn more, I’ve got you covered. We will be running nine new-product webinars later this month. Each webinar is designed to provide you with the information that you need to have in order to be up and running as quickly as possible.
Here’s what we have for you! The webinars are free but “seating” is limited and you should definitely sign up ahead of time if you want to attend (all times are Pacific):
Tuesday, October 27
QuickSight is a fast, cloud-powered business intelligence tool. You can build visualizations, perform ad-hoc analysis, and get business insights from your data.
- Webinar: Introducing Amazon QuickSight (9 – 10 AM).
- Blog Post: Amazon QuickSight – Fast & Easy to Use Business Intelligence for Big Data at 1/10th the Cost of Traditional Solutions.
AWS IoT is a managed cloud platform that lets connected devices easily and securely interact with cloud applications and other devices.
- Webinar: Getting Started with AWS IoT (10:30 – 11:30 AM).
- Blog Post: AWS IoT – Cloud Services for Connected Devices.
Amazon Kinesis Firehose is the easiest way to load streaming data into AWS.
- Webinar: Introducing Amazon Kinesis Firehose (Noon – 1 PM).
- Blog Post: Amazon Kinesis Firehose – Simple & Highly Scalable Data Ingestion.
Wednesday, October 28
Spot Blocks allow you to launch Spot instances that will run for a finite duration (1 to 6 hours).
- Webinar: Introducing Spot Blocks (9 – 10 AM).
- Blog Post: New – EC2 Spot Blocks for Defined-Duration Workloads.
AWS WAF is a web application firewall that helps protect your web applications from common exploits.
- Webinar: Introducing AWS WAF (10:30 – 11:30 AM).
- Blog Post: New AWS WAF.
Amazon Elasticsearch Service is a managed service that makes it easy to deploy, operate, and scale Elasticsearch in the AWS Cloud.
- Webinar: Introducing Amazon Elasticsearch Service (Noon – 1 PM).
- Blog Post: New – Amazon Elasticsearch Service.
Thursday, October 29
AWS Lambda lets you run code in the cloud without provisioning or managing servers.
- Webinar: AWS Lambda Best Practices: Python, Scheduled Jobs, and More (9 – 10 AM).
- Blog Post: AWS Lambda Update – Python, VPC, Increased Function Duration, Scheduling, and More.
AWS Mobile Hub provides an integrated console that helps you build, test, and monitor your mobile apps.
- Webinar: Introducing AWS Mobile Hub (10:30 – 11:30 AM).
- Blog Post: AWS Mobile Hub – Build, Test, and Monitor Mobile Applications.
AWS Import/Export Snowball is a petabyte-scale data transport solution that uses secure appliances to transfer large amounts of data into and out of AWS.
- Webinar: Introducing AWS Import/Export Snowball (Noon – 1 PM).
- Blog Post: AWS Import/Export Snowball – Transfer 1 Petabyte Per Week Using Amazon-Owned Storage Appliances.
— Jeff;
Amazon Kinesis Firehose – Simple & Highly Scalable Data Ingestion
Two years ago we introduced Amazon Kinesis, which we now call Amazon Kinesis Streams, to allow you to build applications that collect, process, and analyze streaming data with very high throughput. We don’t want you to have to think about building and running a fleet of ingestion servers or worrying about monitoring, scaling, or reliable delivery.
Amazon Kinesis Firehose was purpose-built to make it even easier for you to load streaming data into AWS. You simply create a delivery stream, route it to an Amazon Simple Storage Service (S3) bucket and/or a Amazon Redshift table, and write records (up to 1000 KB each) to the stream. Behind the scenes, Kinesis Firehose will take care of all of the monitoring, scaling, and data management for you.
Once again (I never tire of saying this), you can spend more time focusing on your application and less time on your infrastructure.
Inside the Firehose
In order to keep things simple, Kinesis Firehose does not interpret or process the raw data in any way. You simply create a delivery stream and write data records to it. After any requested compression (client-side) and encryption (server-side), the records are written to an S3 bucket that you designate. As my colleague James Hamilton likes to say (in other contexts), “It’s that simple.” You can even control the buffer size and the buffer interval for the stream if necessary.
If your client code isolates individual logical records before sending them to Kinesis Firehose, it can add a delimiter. Otherwise, you can identify record boundaries later, once the data is in the cloud.
After your data is stored in S3, you have multiple options for analyzing and processing it. For example, you can attach an AWS Lambda function to the bucket and process the objects as they arrive. Or, you can point your existing Amazon EMR jobs at the bucket and process the freshest data, without having to make any changes to the jobs.
You can also use Kinesis Firehose to route your data to an Amazon Redshift cluster. After Kinesis Firehose stores your raw data in S3 objects, it can invoke a Redshift COPY command on each object. This command is very flexible and allows you to import and process data in multiple formats (CVS, JSON, AVRO, and so forth), isolate and store only selected columns, convert data from one type to another, and so forth.
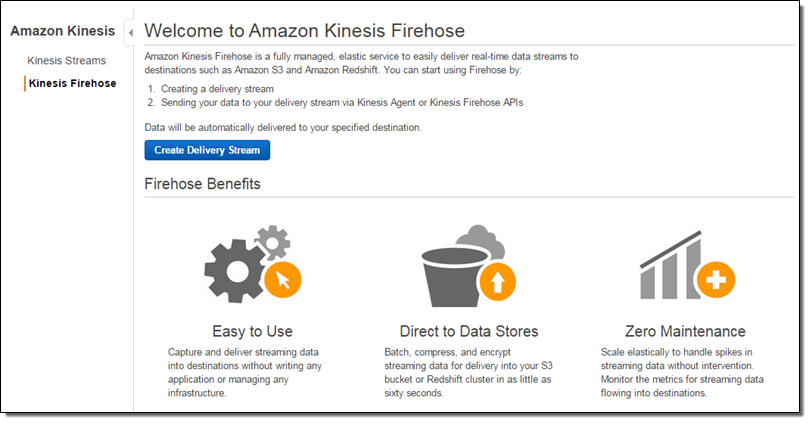
Firehose From the Console
You can do all of this from the AWS Management Console, the AWS Command Line Interface (CLI), and via the Firehose APIs.
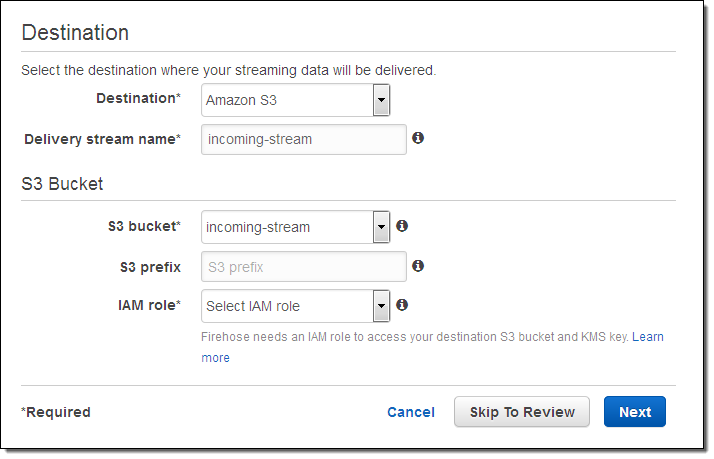
Let’s set up a delivery stream using the Kinesis Firehose Console. I simply open it up and click on Create Delivery Stream. Then I give my stream a name, pick an S3 bucket (or create a new one), and set up an IAM role so that Kinesis Firehose has permission to write to the bucket:
I can configure the latency and compression for the delivery stream. I can also choose to encrypt the data using one of my AWS Key Management Service (KMS) keys:
Once my stream is created, I can see it from the console.
Publishing to a Delivery Stream
Here is some simple Java code to publish a record (the string “some data”) to my stream:
PutRecordRequest putRecordRequest = new PutRecordRequest();
putRecordRequest.setFirehoseName("incoming-stream");

String data = "some data" + "\n"; // add \n as a record separator
Record record = new Record();
record.setData(ByteBuffer.wrap(data.getBytes(StandardCharsets.UTF_8)));

putRecordRequest.setRecord(record);
firehoseClient.putRecord(putRecordRequest);
And here’s a CLI equivalent:
$ aws firehose put-record --delivery-stream-name incoming-stream --record Data="some data\n"
We also supply an agent that runs on Linux. It can be configured to watch one more log files and to route them to Kinesis Firehose.
Monitoring Kinesis Firehose Delivery Streams
You can monitor the CloudWatch metrics for each of your delivery streams from the Console:
By the Numbers
Individual delivery streams can scale to accommodate multiple gigabytes of data per hour. By default, each stream can support 2500 calls to PutRecord or PutRecordBatch per second and you can have up to 5 streams per AWS account (both of these values are administrative limits that can be raised upon request, so just ask if you need more).
This feature is available now and you can start using it today. Pricing is based on the volume of data ingested via each Firehose.
— Jeff;
CloudWatch Logs Subscription Consumer + Elasticsearch + Kibana Dashboards
Many of the things that I blog about lately seem to involve interesting combinations of two or more AWS services and today’s post is no exception. Before I dig in, I’d like to briefly introduce all of the services that I plan to name-drop later in this post. Some of this will be review material, but I do like to make sure that every one of my posts makes sense to someone who knows little or nothing about AWS.
- Amazon Kinesis is a fully-managed service for processing real-time data streams. Read my introductory post, Amazon Kinesis – Real-Time Processing of Streaming Big Data to learn more.
- The Kinesis Connector Library helps you to connect Kinesis to other AWS and non-AWS services.
- AWS CloudFormation helps you to define, create, and manage a set of related AWS resources using a template.
- CloudWatch Logs allow you to store and monitor operating system, application, and custom log files. My post, Store and Monitor OS & Application Log Files with Amazon CloudWatch, will tell you a lot more about this feature.
- AWS Lambda runs your code (currently Node.js or Java) in response to events. It manages the compute resources for you so that you can focus on the code. Read AWS Lambda – Run Code in the Cloud to learn more. Many developers are using Lambda (often in conjunction with the new Amazon API Gateway) to build highly scalable microservices that are invoked many times per second.
- VPC Flow Logs give you access to network traffic related to a VPC, VPC subnet, or Elastic Network Interface. Once again, I have a post for this: VPC Flow Logs – Log and View Network Traffic Flows.
- Finally, AWS CloudTrail records AWS API calls for your account and delivers the log files to you. Of course, I have a post for that: AWS CloudTrail – Capture AWS API Activity.
The last three items above have an important attribute in common — they can each create voluminous streams of event data that must be efficiently stored, index, and visualized in order to be of value.
Visualize Event Data
Today I would like to show you how you can use Kinesis and a new CloudWatch Logs Subscription Consumer to do just that. The subscription consumer is a specialized Kinesis stream reader. It comes with built-in connectors for Elasticsearch and S3, and can be extended to support other destinations.
We have created a CloudFormation template that will launch an Elasticsearch cluster on EC2 (inside of a VPC created by the template), set up a log subscription consumer to route the event data in to ElasticSearch, and provide a nice set of dashboards powered by the Kibana exploration and visualization tool. We have set up default dashboards for VPC Flow Logs, Lambda, and CloudTrail; you can customize them as needed or create other new ones for your own CloudWatch Logs log groups.
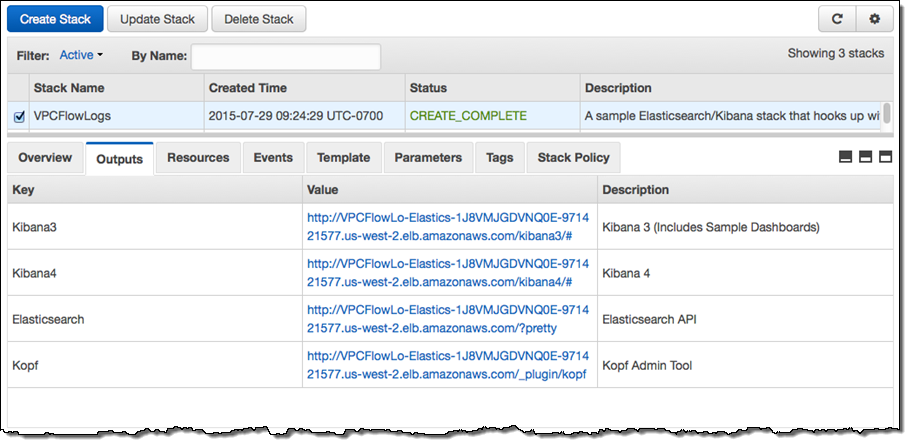
The stack takes about 10 minutes to create all of the needed resources. When it is ready, the Output tab in the CloudFormation Console will show you the URLs for the dashboards and administrative tools:
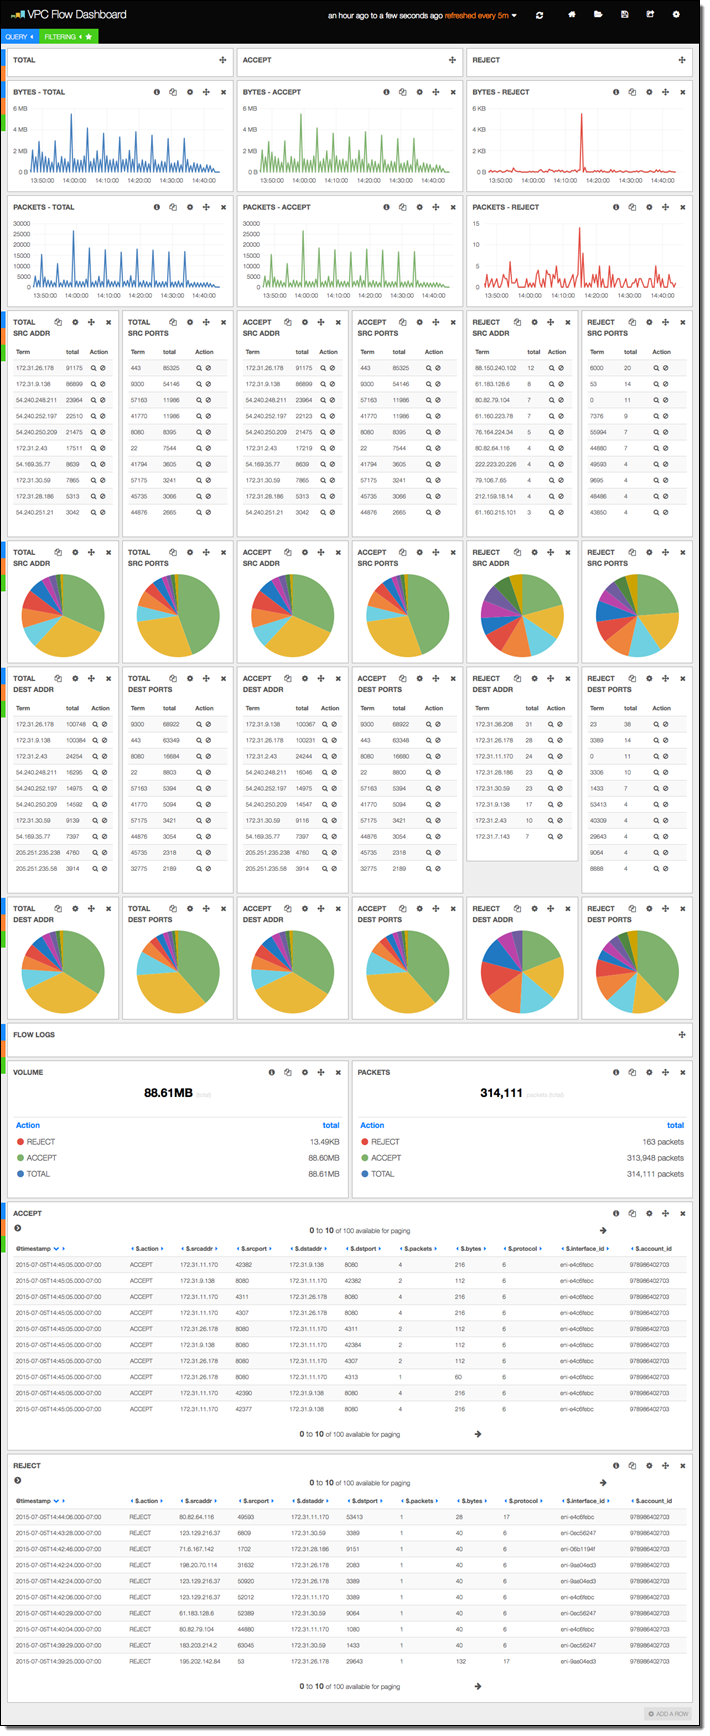
The stack includes versions 3 and 4 of Kibana, along with sample dashboards for the older version (if you want to use Kibana 4, you’ll need to do a little bit of manual configuration). The first sample dashboard shows the VPC Flow Logs. As you can see, it includes a considerable amount of information:
The next sample displays information about Lambda function invocations, augmented by data generated by the function itself:
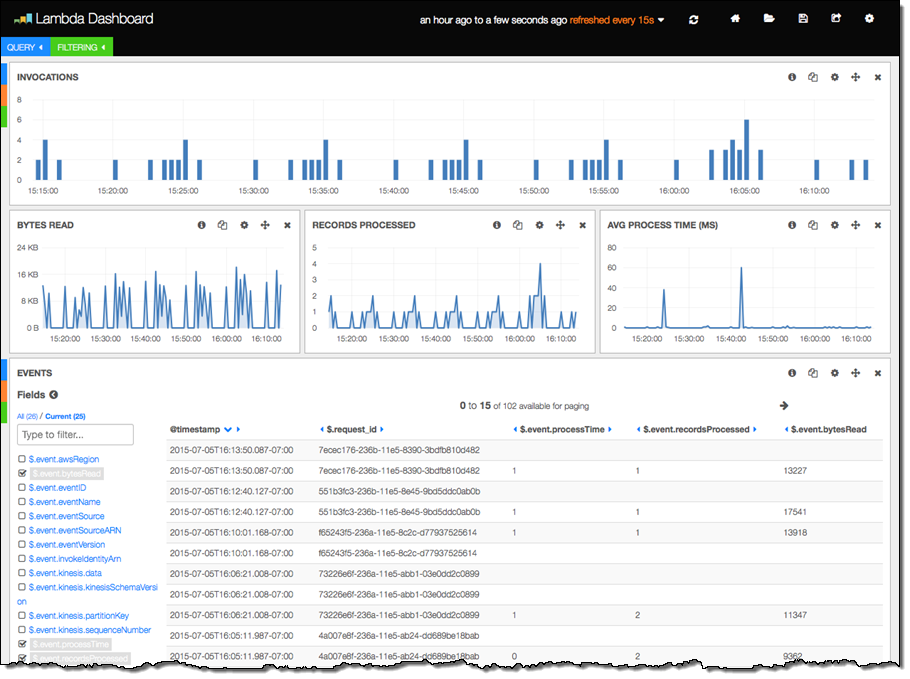
The final three columns were produced by the following code in the Lambda function. The function is processing a Kinesis stream, and logs some information about each invocation:
exports.handler = function(event, context) {
    var start = new Date().getTime();
    var bytesRead = 0;

    event.Records.forEach(function(record) {
        // Kinesis data is base64 encoded so decode here
        payload = new Buffer(record.kinesis.data, 'base64').toString('ascii');
        bytesRead += payload.length;

        // log each record
        console.log(JSON.stringify(record, null, 2));
    });

    // collect statistics on the function's activity and performance
    console.log(JSON.stringify({
        "recordsProcessed": event.Records.length,
        "processTime": new Date().getTime() - start,
        "bytesRead": bytesRead,
    }, null, 2));

    context.succeed("Successfully processed " + event.Records.length + " records.");
};
There’s a little bit of magic happening behind the scenes here! The subscription consumer noticed that the log entry was a valid JSON object and instructed Elasticsearch to index each of the values. This is cool, simple, and powerful; I’d advise you to take some time to study this design pattern and see if there are ways to use it in your own systems.
For more information on configuring and using this neat template, visit the CloudWatch Logs Subscription Consumer home page.
Consume the Consumer
You can use the CloudWatch Logs Subscription Consumer in your own applications. You can extend it to add support for other destinations by adding another connector (use the Elasticsearch and S3 connectors as examples and starting points).
— Jeff;