Category: Auto Scaling
New – Target Tracking Policies for EC2 Auto Scaling
I recently told you about DynamoDB Auto Scaling and showed you how it uses multiple CloudWatch Alarms to automate capacity management for DynamoDB tables. Behind the scenes, this feature makes use of a more general Application Auto Scaling model that we plan to put to use across several different AWS services over time.
The new Auto Scaling model includes an important new feature that we call target tracking. When you create an Auto Scaling policy that makes use of target tracking, you choose a target value for a particular CloudWatch metric. Auto Scaling then turns the appropriate knob (so to speak) to drive the metric toward the target, while also adjusting the relevant CloudWatch Alarms. Specifying your desired target, in whatever metrics-driven units make sense for your application, is generally easier and more direct than setting up ranges and thresholds manually using the original step scaling policy type. However, you can use target tracking in conjunction with step scaling in order to implement an advanced scaling strategy. For example, you could use target tracking for scale-out operations and step scaling for scale-in.
Now for EC2
Today we are adding target tracking support to EC2 Auto Scaling. You can now create scaling policies that are driven by application load balancer request counts, CPU load, network traffic, or a custom metric (the Request Count per Target metric is new, and is also part of today’s launch):
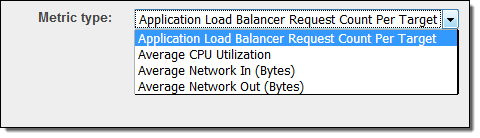
These metrics share an important property: adding additional EC2 instances will (with no changes in overall load) drive the metric down, and vice versa.
To create an Auto Scaling Group that makes use of target tracking, you simply enter a name for the policy, choose a metric, and set the desired target value:
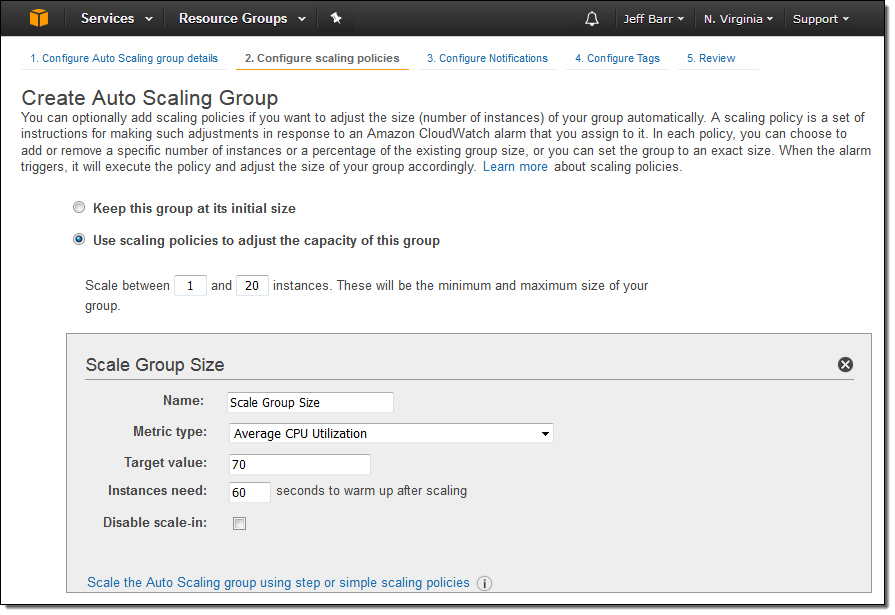
You have the option to disable the scale-in side of the policy. If you do this, you can scale-in manually or use a separate policy.
You can create target tracking policies using the AWS Management Console, AWS Command Line Interface (CLI), or the AWS SDKs.
Here are a couple of things to keep in mind as you look forward to using target tracking:
- You can track more than one target in a single Auto Scaling Group as long as each one references a distinct metric. Scaling will always choose the policy that drives the highest capacity.
- Scaling will not take place if the metric has insufficient data.
- Auto Scaling compensates for rapid, transient fluctuations in the metrics, and strives to minimize corresponding fluctuations in capacity.
- You can set up target tracking for a custom metric through the Auto Scaling API or the AWS Command Line Interface (CLI).
- In most cases you should elect to scale on metrics that are published with 1-minute frequency (also known as detailed monitoring). Using 5-minute metrics as the basis for scaling will result in a slower response time.
Now Available
This new feature is available now and you can start using it today at no extra charge. To learn more, read about Target Tracking Scaling in the Auto Scaling User Guide.
— Jeff;
New – Instance Protection for Auto Scaling
You can use Auto Scaling to scale a collection of EC2 instances up and down based on a set of conditions that you define. Scaling out helps you to maintain the desired level of performance as demand for processing power increases; scaling in reduces costs during quiet periods.
Today we are giving you additional control over the instances that are eligible to be terminated when one of your Auto Scaling groups processes a scale in action. As has been the case in the past, if you take no special action, any instance in the group can be terminated. With the new control that we are giving you today, you can protect certain instances from termination.
You might want to do this for several reasons. First, an instance might be handling a long-running work task, perhaps pulled from an SQS queue. Protecting the instance from termination will avoid wasted work. Second, the instance might serve a special purpose within the group. It could be the master node of a Hadoop cluster, or a “canary” that flags the entire group of instances as up and running.
Protecting Instances from Termination During Scale In
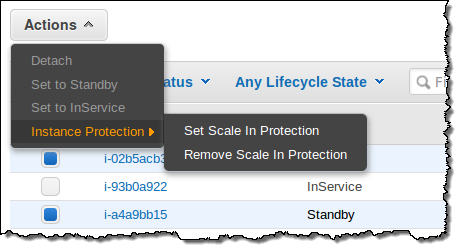
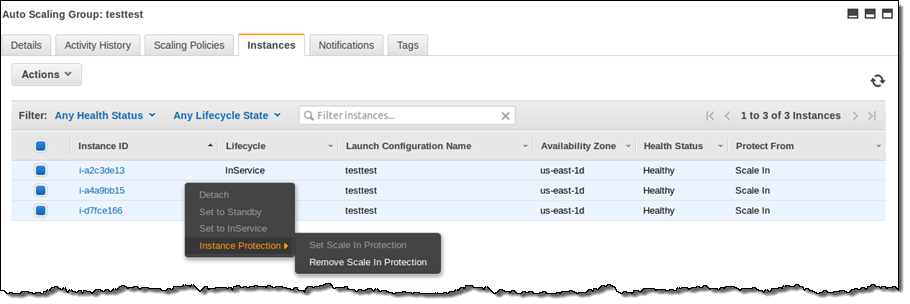
You can protect instances from termination by simply selecting them in the Auto Scaling Console and then choosing Instance Protection from the Actions menu:
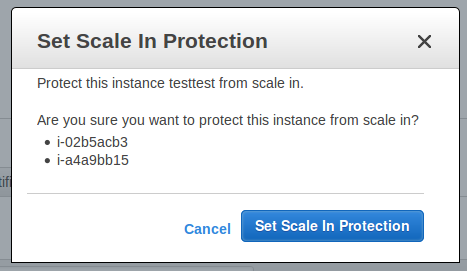
Then confirm your intent:
You can see the protection status of each instance in a group from within the Console:
You can also change the protection status of one or more instances by calling the SetInstanceProtection function. If you wanted to use this function to protect long-running, queue-driven worker processes from scale-in termination, you could set up your application as follows (this is pseudocode):
while (true)
{
  SetInstanceProtection(False);
  Work = GetNextWorkUnit();
  SetInstanceProtection(True);
  ProcessWorkUnit(Work);
  SetInstanceProtection(False);
}
In most cases, you will want to leave at least one instance in each of your auto scaling groups unprotected. If all of the instances are protected, no scale in action will be taken. To learn more, read about the Auto Scaling Lifecycle.
This new functionality is available now and you can start using it today!
— Jeff;
PS – The AWS SDKs will be updated on December 8th; you’ll be able to use the SetInstanceProtection function after the update.
Auto Scaling Update – New Scaling Policies for More Responsive Scaling
Auto Scaling helps you to build systems that respond to changes in the demand for compute power by launching additional Amazon Elastic Compute Cloud (EC2) instances or terminating existing ones.
As I was thinking about this post, I thought it would be fun to deconstruct Auto Scaling to ensure that I (and you) have a full understanding of how it works and how it makes use of other parts of AWS (in practice most of our customers use Auto Scaling to launch and terminate instances on their behalf; this is more of a look behind the scenes and an illustration of how different parts of AWS depend upon and build on each other). Here are the moving parts:
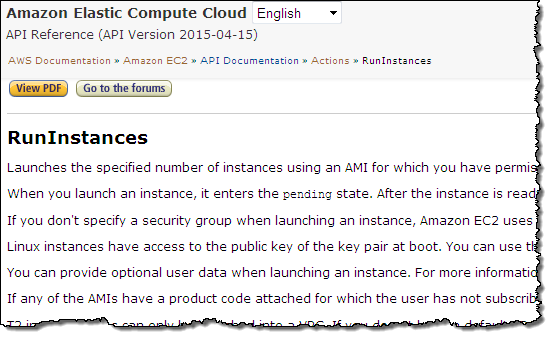
Resource Creation – In order to be able to implement Auto Scaling, we need to have the ability to launch and terminate EC2 instances as needed. Of course, AWS is API-driven and these operations are handled by the RunInstances and TerminateInstances actions, assisted by DescribeInstances:
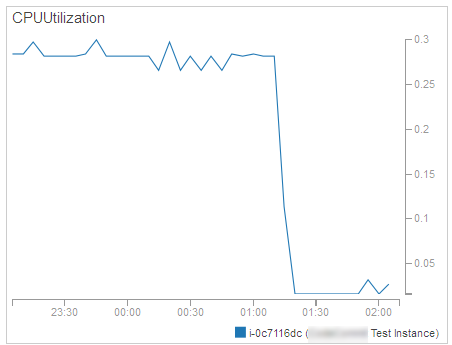
Resource Monitoring – We need to measure and track how busy (in terms of CPU utilization, network traffic, or other metrics) our instances are (both individually and collectively) in order to be able to make informed scaling decisions. This is handled by Amazon CloudWatch:
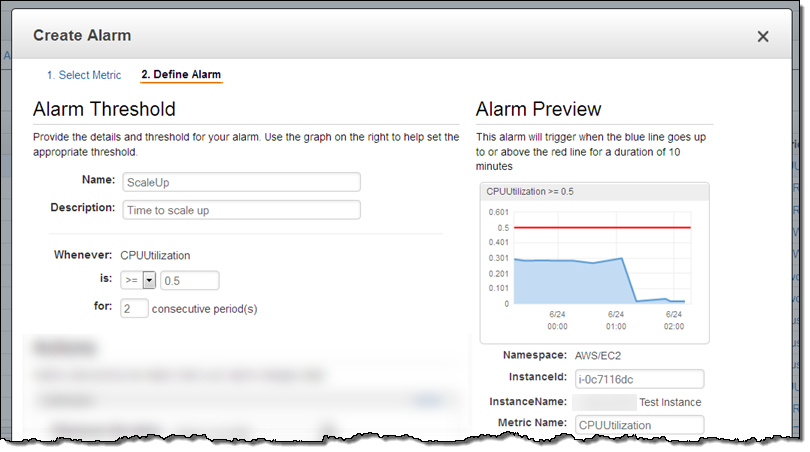
Alarms – Now that we are tracking resource utilization, we need to know when the operating conditions dictate a scale-out or scale-in operation. This is also handled by CloudWatch:
Scaling Actions – The final step is to actually take action when an alarm is raised. This is handled by Auto Scaling, as directed by a CloudWatch Alarm:
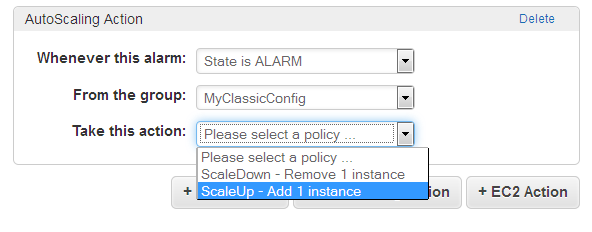 The actions are defined within a particular Auto Scaling Group, and can add or remove a specific number of instances. They can also adjust the instance count by a percentage (add 20% more instances) or set it to an absolute value.
New Scaling Policies With Steps
Today we are making Auto Scaling even more flexible with the addition of new scaling policies with steps.
Our goal is to allow you to create systems that can do an even better job of responding to rapid and dramatic changes in load. You can now define a scaling policy that will respond to the magnitude of the alarm breach in a proportionate and appropriate way. For example, if you try to keep your average CPU utilization below 50% you can have a standard response for a modest breach (50% to 60%), two more for somewhat bigger breaches (60% to 70% and 70% to 80%), and a super-aggressive one for utilization that exceeds 80%.
Here’s how I set this up for my Auto Scaling group:
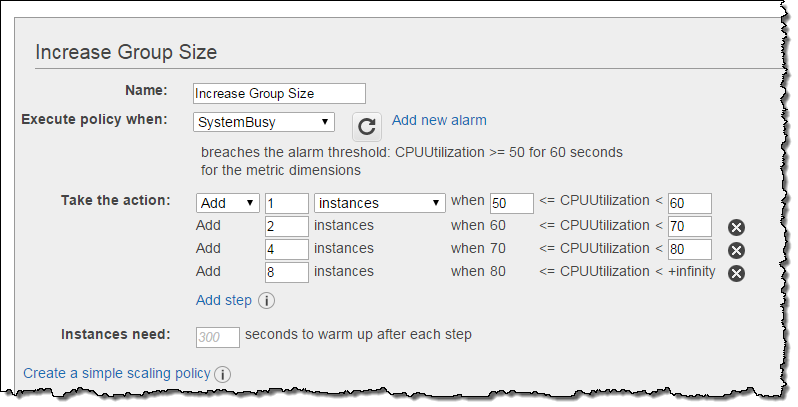
In this example I added a fixed number (1, 2, 4, or 8) of instances to the group. I could have chosen to define the policies on a percentage basis, increasing the instance count by (say) 50%, 100%, 150%, and 200% at the respective steps. The empty upper bound in the final step is effectively positive infinity. You can also define a similar set of increasingly aggressive policies for scaling down.
As you can see from the example above, you can also tell Auto Scaling how long it should take for an instance to warm up and be ready to start sharing the load. While this waiting period is in effect, Auto Scaling will include the newly launched instances when it computes the current size of the group. However, during this scaling time, the instances are not factored in to the CloudWatch metrics for the group. This avoids unnecessary scaling while the new instances prepare themselves to take on their share of the load.
Step policies continuously evaluate the alarms during a scaling activity and while unhealthy instances are being replaced with new ones. This allows for faster response to changes in demand. Let’s say the CPU load increases and the first step in the policy is activated. During the specified warm up period (300 seconds in this example), the load might continue to increase and a more aggressive response might be appropriate. Fortunately, Auto Scaling is in violent agreement with this sentiment and will switch in to high gear (and use one of the higher steps) automatically. If you create multiple step scaling policies for the same resource (perhaps based on CPU utilization and inbound network traffic) and both of them fire at approximately the same time, Auto Scaling will look at both policies and choose the one that results in the change of the highest magnitude.
You can also create these new scaling policies using the AWS Command Line Interface (CLI) or the Auto Scaling API.
This new functionality is available now and you can start using it today.
— Jeff;
Attach and Detach Elastic Load Balancers from Auto Scaling Groups
I enjoy reading the blog posts that I wrote in the early days of AWS. Way back in 2009, I wrote a post to launch Elastic Load Balancing, Auto Scaling, and Amazon CloudWatch. Here’s what I said at the time:
“As soon as you launch some EC2 instances, you want visibility into resource utilization and overall performance. You want your application to be able to scale on demand based on traffic and system load. You want to spread the incoming traffic across multiple web servers for high availability and better performance.”
All of these requirements remain. In the six years since that blog post, we have added many features to each of these services. Since this post focuses on Elastic Load Balancing and Auto Scaling, I thought I’d start with a quick recap of some of the features that we have recently added to those services.
- Elastic Load Balancing has been enhanced with tagging, connection timeout management, and support for Proxy Protocol.
- Auto Scaling has been updated to include lifecycle management, a standby state, and the ability to attach and detach instances from an auto scaling group. Earlier, we added new APIs and console support.
Many of these features were added in response to customer feedback (we love to hear from you; don’t be shy). Today’s feature is no exception!
Attach and Detach Load Balancers
You can now attach and detach elastic load balancers from auto scaling groups. This gives you additional operational flexibility. Attaching a load balancer to an auto scaling group allows the load balancer to send traffic to the EC2 instances in the group. Detaching a load balancer from a group stops it from sending traffic.
The ability to easily attach and detach load balancers from your auto scaling groups will simplify your fleet management tasks. For example, you can do blue-green deployments and upgrade SSL certificates more easily and with less downtime.
You can access this feature from the AWS Management Console, AWS Command Line Interface (CLI), AWS Tools for Windows PowerShell, and the EC2 API. Let’s take a look at the console. I have two load balancers:
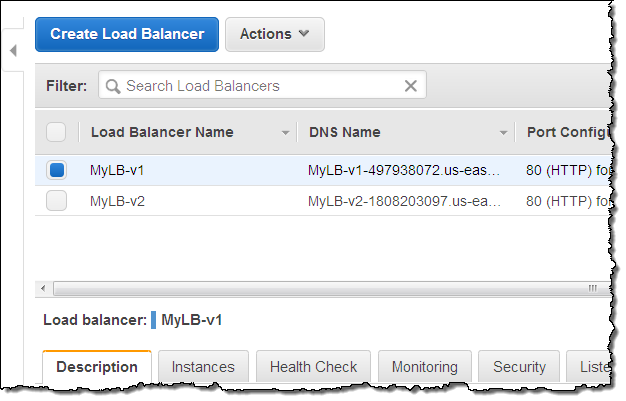
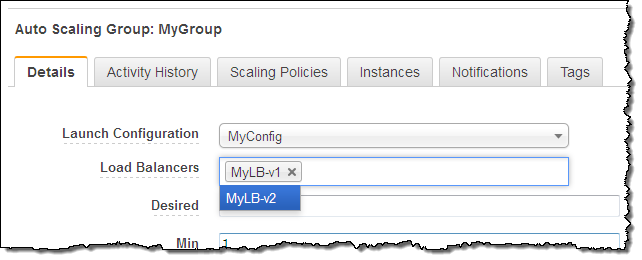
Initially, the first load balancer (MyLB-v1) is attached to my auto scaling group:
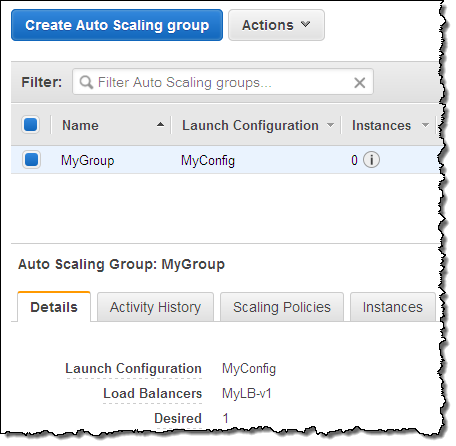
To make a change, I simply select the auto scaling group, and click on the Edit action in the menu:
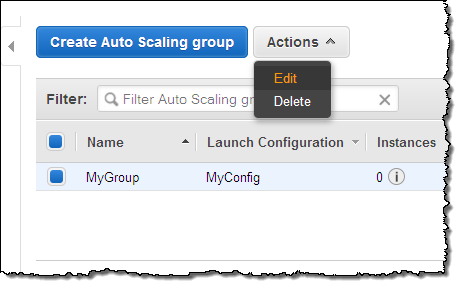
Then I make any desired changes, and click on Save:
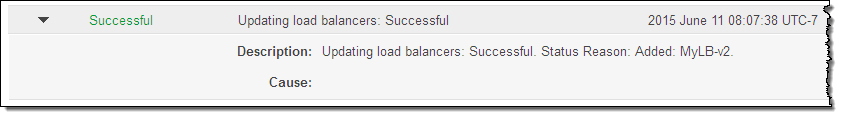
The changes take effect within a minute or so. You can check the Activity History to confirm that the change is complete:
This feature is available now and you can start using it today in all public AWS regions (support for AWS GovCloud (US) is on the way).
— Jeff;
AWS GovCloud (US) Update – Glacier, VM Import, CloudTrail, and More
I am pleased to be able to announce a set of updates and additions to AWS GovCloud (US). We are making a number of new services available including Amazon Glacier, AWS CloudTrail, and VM Import. We are also enhancing the AWS Management Console with support for Auto Scaling and the Service Limits Report. As you may know, GovCloud (US) is an isolated AWS Region designed to allow US Government agencies and customers to move sensitive workloads in to the cloud. It adheres to the U.S. International Traffic in Arms Regulations (ITAR) regulations and well as the Federal Risk and Authorization Management Program (FedRampSM). AWS GovCloud (US) has received an Agency Authorization to Operate (ATO) from the US Department of Health and Human Services (HHS) utilizing a FedRAMP accredited Third Party Assessment Organization (3PAO) for the following services: EC2, S3, EBS, VPC, and IAM.
AWS customers host a wide variety of web and enterprise applications in GovCloud (US). They also run HPC workloads and count on the cloud for storage and disaster recovery.
Let’s take a look at the new features!
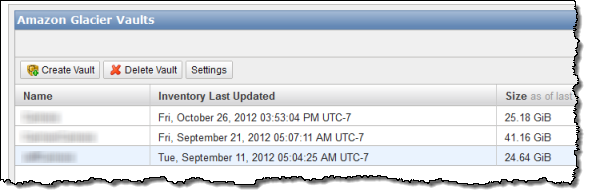
Amazon Glacier
Amazon Glacier is a secure and durable storage service designed for data archiving and online backup. With prices that start at $0.013 per gigabyte per month in this Region, you can store any amount of data and retrieve it within hours. Glacier is ideal for digital media archives, financial and health care records, long term database backups. It is also a perfect place to store data that must be retained for regulatory compliance. You can store data directly in a Glacier vault or you can make use of lifecycle rules to move data from Amazon Simple Storage Service (S3) to Glacier.
AWS CloudTrail
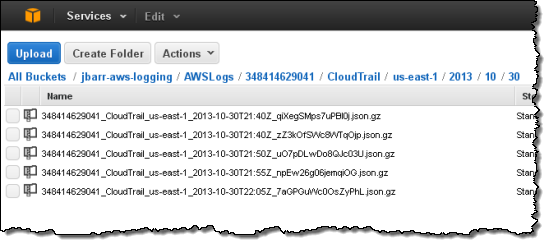
AWS CloudTrail records calls made to the AWS APIs and publishes the resulting log files to S3. The log files can be use as a compliance aid, allowing you to demonstrate that AWS resources have been managed according to rules and regulatory standards (see my blog post, AWS CloudTrail – Capture AWS API Activity, for more information). You can also use the log files for operational troubleshooting and to identity activities on AWS resources which failed due to inadequate permissions. As you can see from the blog post, you simply enable CloudTrail from the Console and point it at the S3 bucket of your choice. Events will be delivery to the bucket and stored in encrypted form, typically within 15 minutes after they take place. Within the bucket, events are organized by AWS Account Id, Region, Service Name, Date, and Time:
Our white paper, Security at Scale: Logging in AWS, will help you to understand how CloudTrail works and how to put it to use in your organization.
VM Import
VM Import allows you to import virtual machine images from your existing environment for use on Amazon Elastic Compute Cloud (EC2). This allows you to use build off of your existing investment in images that meet your IT security, configuration management, and compliance requirements.
You can import VMware ESX and VMware Workstation VMDK images, Citrix Xen VHD images and Microsoft Hyper-V VHD images for Windows Server 2003, Windows Server 2003 R2, Windows Server 2008, Windows Server 2008 R2, Windows Server 2012, Windows Server 2012 R2, Centos 5.1-6.5, Ubuntu 12.04, 12.10, 13.04, 13.10, and Debian 6.0.0-6.0.8, 7.0.0-7.2.0.
Console Updates
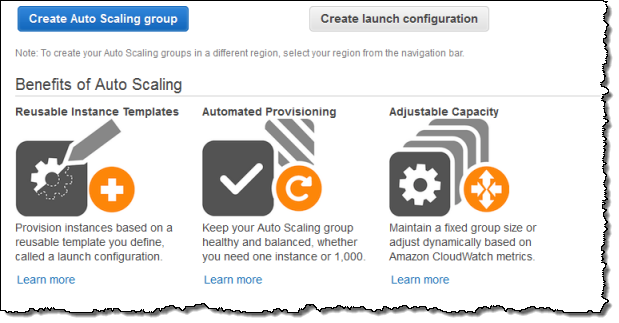
The AWS Management Console in the GovCloud Region now supports Auto Scaling and the Service Limits Report.
Auto Scaling allows you to build systems that respond to changes in demand by scaling capacity up or down as needed.
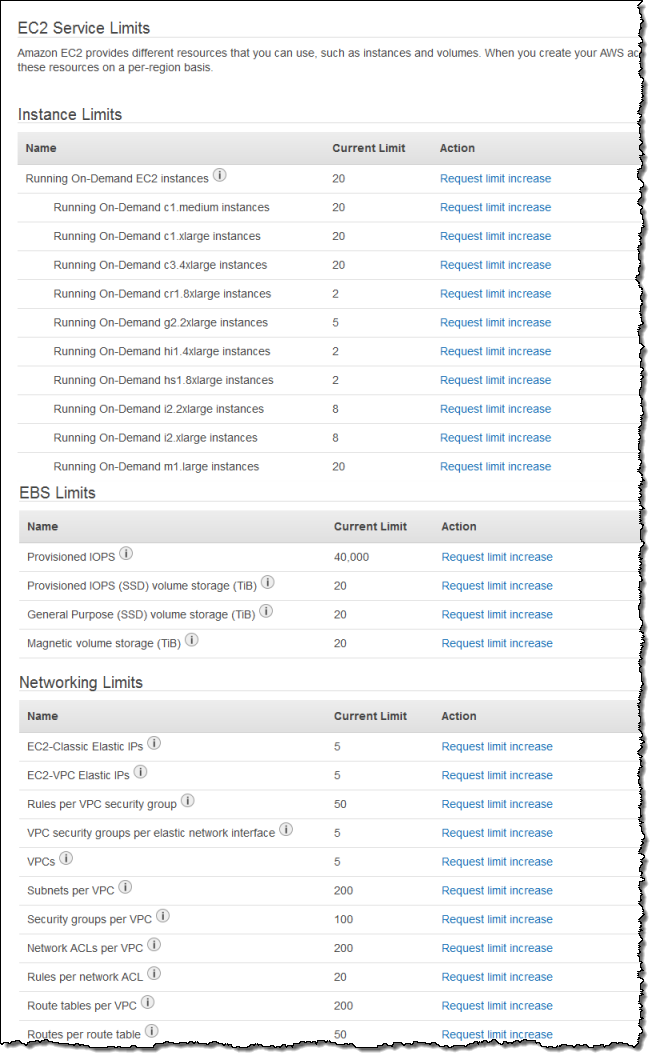
The Service Limits Report makes it easy for you to view and manage the limits associated with your AWS account. It includes links that let you make requests for increases in a particular limit with a couple of clicks:
All of these new features are operational now and are available to GovCloud users today!
— Jeff;
Rapid Auto Scaling with Amazon SQS
Earlier this month an AWS user named Andy emailed the following question to me:
We’re interested in using the number of items in our sqs queue as criteria for autoscaling our ec2 workers. The 5 minute delay is really way too long for this application, it would have to keep track of the queue in close to real time, 1 minute or less. Is this possible?
Well, Andy, that’s a great question! In fact, the SQS team asked me to write about that very topic earlier this month. Thanks for providing me with the perfect introduction to this blog post.
Defining the Problem
Before jumping in, let’s spend a few minute defining the problem that Andy faces. As you can read in the Scaling Based on Amazon SQS tutorial in the Auto Scaling documentation, you can use the number of messages stored in an SQS queue as an indicator of the amount of work that is waiting in line for eventual processing within an Auto Scaling Group comprised of a variable number of EC2 instances. Each SQS queue reports a number of metrics to CloudWatch at five minute intervals, including ApproximateNumberOfMessagesVisible. If your workload is spikey in nature, you may want to build an application that can respond more quickly to changes in the size of the queue.
You may also have an application that pulls work from multiple queues distributed across two or more AWS Regions. Since the metrics are collected on a per-queue, per-Region basis, additional work is needed in order to create a metric that accurately reflects the actual amount of pending work.
Solving the Problem
You can address either (or both) of these challenges by using a custom CloudWatch metric. The finished solution will use a pair of Auto Scaling Groups. The first Group (which I will call the Checker) will periodically check the queue depth and publish it as a custom metric. The second Group (the Worker) will do the actual processing of the messages in the queue, scaling up and down using the information provided by the custom metric.
The Checker Group exists in order to keep a single, modestly-sized EC2 instance up and running (a t2.micro will probably suffice), and to launch replacements if necessary (set the minimum and maximum number of instances to 1 for the Group). This instance periodically runs some simple code that is responsible for pulling the ApproximateNumberOfMessagesVisible metrics from one or more queues and publishing the results to a custom CloudWatch metric. Here are a couple of code snippets to get you started. The first step is to query SQS to retrieve the metric:
public static final String APPROXIMATE_NUMBER_OF_MESSAGES_ATT = "ApproximateNumberOfMessages";
public static final String NAMESPACE = "QueueDepthNamespace";

Map<string string> attributes = sqs.getQueueAttributes(queueUrl, attributeList).getAttributes();
double approximateNumOfMsg = Double.parseDouble(attributes.get(APPROXIMATE_NUMBER_OF_MESSAGES_ATT));
And the second step is to publish the metric:
MetricDatum md = new MetricDatum()
  .withMetricName(queueName + "-OneMinute-" + APPROXIMATE_NUMBER_OF_MESSAGES_ATT)
  .withUnit(StandardUnit.Count)
  .withValue(approximateNumOfMsg);

cloudWatch.putMetricData(new PutMetricDataRequest()
  .withNamespace(NAMESPACE)
  .withMetricData(md));
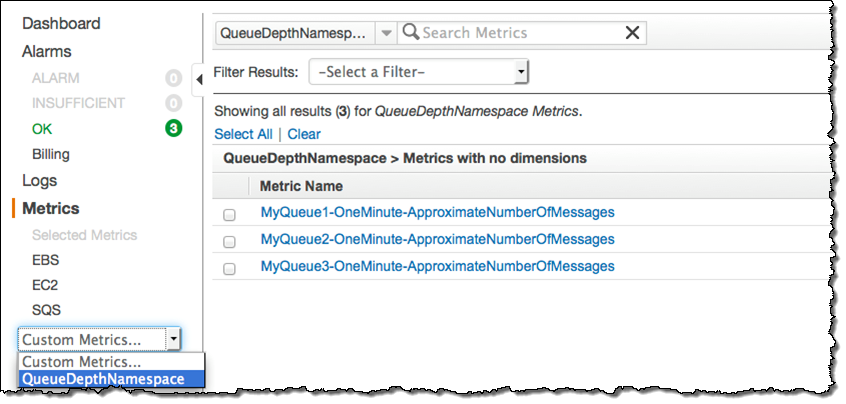
Although the queue’s metric is updated at one minute intervals, you should plan on collecting and publishing several samples per minute. This will provide enough data points to allow Auto Scaling to respond to changes more quickly and more accurately. For example, if you sample and publish every 10 seconds, each one-minute metric will reflect the average of six samples. Before choosing a sampling rate, be sure to do some calculations in order to make sure that you understand the per-call costs for the SQS and CloudWatch API functions. The metrics will be visible in the CloudWatch console:
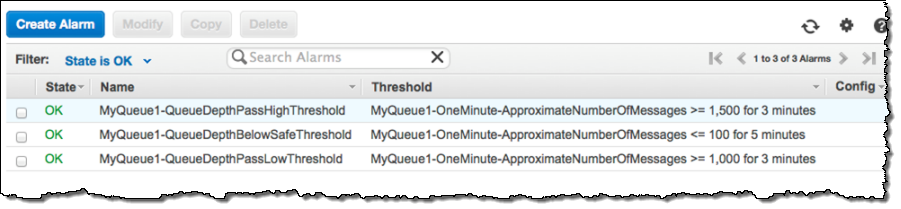
The Worker Group will vary in size in response to changes in the custom metric published by the EC2 instance running in the Checker Group. To do this, you must associate CloudWatch alarms with the custom metrics. For example, you could use three alarms, configured as follows (you’ll need to fine-tune these to the needs of your application):
- MyQueue1-QueueDepthPassLowThreshold – When MyQueue1 accumulates a message backlog of 1000 messages, increase the size of the Worker Group by one instance.
- MyQueue1-QueueDepthPassHighThreshold – When MyQueue1 accumulates a message backlog of 1500 messages, increase the size of the Worker Group by two instances.
- MyQueue1-QueueDepthBelowSafeThreshold – When the number of messages in MyQueue1 is below 100, reduce the size of the Work Group by one instance.
Here’s how these alarms would look in the console:
Learning More
To learn more, read my blog post Additional CloudWatch Metrics for Amazon SQS and Amazon SNS and the documentation on Monitoring Amazon SQS With CloudWatch.
— Jeff;
Auto Scaling Update – Lifecycle Management, Standby State, and DetachInstances
Auto Scaling is a key AWS service. You can use it to build resilient, highly scalable applications that react to changes in load by launching or terminating Amazon EC2 instances as needed, all driven by system or user-defined metrics collected and tracked by Amazon CloudWatch.
Today we are enhancing Auto Scaling with the addition of three features that give you additional control over the EC2 instances managed by each of your Auto Scaling Groups. You can now exercise additional control of the instance launch and termination process using Lifecycle Hooks. You can remove instances from an Auto Scaling Group and you can now put instances into the new Standby state for troubleshooting or maintenance.
Lifecycle Actions & Hooks
Each EC2 instance in an Auto Scaling Group goes through a defined set of states and state transitions during its lifetime. In response to a Scale Out Event, instances are launched, attached to the group, and become operational. Later, in response to a Scale In Event, instances are removed from the group and then terminated. With today’s launch we are giving you additional control of the instance lifecycle at the following times:
- After it has been launched but before it is attached to the group (Auto Scaling calls this state Pending). This is your opportunity to perform any initialization operations that are needed to fully prepare the instance. You can install and configure software, create, format, and attach EBS volumes, connect the instance to message queues, and so forth.
- After it has been detached from the group but before it has been terminated (Auto Scaling calls this state Terminating). You can do any additional work that is needed to fully decommission the instance. You can capture a final snapshot of any work in progress, move log files to long-term storage, or hold malfunctioning instances off to the side for debugging.
You can configure a set of Lifecycle actions for each of your Auto Scaling Groups. Messages will be sent to a notification target for the group (an SQS queue or an SNS topic) each time an instance enters the Pending or Terminating state. Your application is responsible for handling the messages and implementing the appropriate initialization or decommissioning operations.
After the message is sent, the instance will be in the Pending:Wait or Terminating:Wait state, as appropriate. Once the instance enters this state, your application is given 60 minutes to do the work. If the work is going to take more than 60 minutes, your application can extend the time by issuing a “heartbeat” to Auto Scaling. If the time (original or extended) expires, the instance will come out of the wait state.
After the instance has been prepared or decommissioned, your application must tell Auto Scaling that the lifecycle action is complete, and that it can move forward. This will set the state of the instance to Pending:Proceed or Terminating:Proceed.
You can create and manage your lifecycle hooks from the AWS Command Line Interface (CLI) or from the Auto Scaling API. Here are the most important functions:
PutLifecycleHook– Create or update a lifecycle hook for an Auto Scaling Group. Call this function to create a hook that acts when instances launch or terminate.CompleteLifecycleAction– Signify completion of a lifecycle action for a lifecycle hook. Call this function when your hook has successfully set or up decommissioned an instance.RecordLifecycleActionHeartbeat– Record a heartbeat for a lifecycle action. Call this function to extend the timeout for a lifecycle action.
Standby State
You can now move an instance from the InService state to the Standby state, and back again. When an instance is standing by, it is still managed by the Auto Scaling Group but it is removed from service until you set it back to the InService state. You can use this state to update, modify, or troubleshoot instances. You can check on the state of the instance after specific events, and you can set it aside in order to retrieve important logs or other data.
If there is an Elastic Load Balancer associated with the Auto Scaling Group, the transition to the standby state will deregister the instance from the Load Balancer. The transition will not take effect until traffic ceases; this may take some time if you enabled connection draining for the Load Balancer.
DetachInstances
You can now remove an instance from an Auto Scaling Group and manage it independently. The instance can remain unattached, or you can attach it to another Auto Scaling Group if you’d like. When you call the DetachInstances function, you can also request a change in the desired capacity for the group.
You can use this new functionality in a couple of different ways. You can move instances from one Auto Scaling Group to another to effect an architectural change or update. You can experiment with a mix of different EC2 instance types, adding and removing instances in order to find the best fit for your application.
If you are new to the entire Auto Scaling concept, you can use this function to do some experimentation and to gain some operational experience in short order. Create a new Launch Configuration using the CreateLaunchConfiguration and a new Auto Scaling Group using CreateAutoScalingGroup, supplying the Instance Id of an existing EC2 instance in both cases. Do your testing and then call DetachInstances to take the instance out of the Auto Scaling Group.
You can also use the new detach functionality to create an “instance factory” of sorts. Suppose your application assigns a fresh, fully-initialized EC2 instance to each user when they log in. Perhaps the application takes some time to initialize, but you don’t want your users to wait for this work to complete. You could create an Auto Scaling Group and set it up so that it always maintains several instances in reserve, based on the expected login rate. When a user logs in, you can allocate an instance, detach it from the Auto Scaling Group, and dedicate it to the user in short order. Auto Scaling will add fresh instances to the group in order to maintain the desired amount of reserve capacity.
Available Now
All three of these new features are available now and you can start using them today. They are accessible from the AWS Command Line Interface (CLI) and the Auto Scaling API.
— Jeff;
Trusted Advisor Update – New Checks and New CloudTrail Regions
AWS Trusted Advisor provides you with advice and guidance to help you to use AWS safely, securely, and economically.
Today we are making the Trusted Advisor even more useful, with support for additional service limit checks and for CloudTrail in additional Regions.
Service Limit Checks
Many AWS services are configured with per-account “soft” limits on the number of resources of a particular type. In almost every case, we can raise these limits for you on an as-needed basis; simply visit the AWS Support Center and open a case.
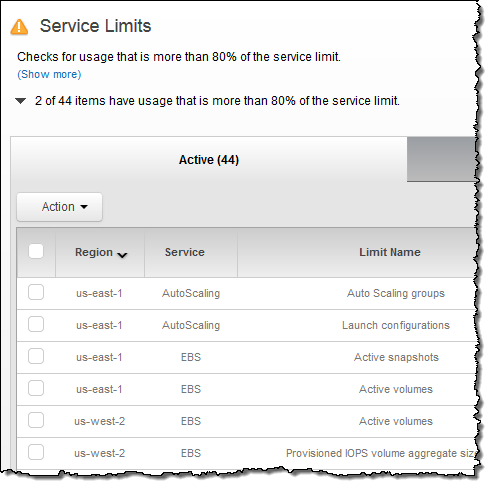
Trusted Advisor checks your current resource usage against your account limits and lets you know when it might be time to request an increase in a particular limit. Today we are adding six new limit checks, spread across the following three AWS services:
- Amazon Simple Email Service – Daily sending quota.
- Amazon Virtual Private Cloud – Elastic IP Addresses, Internet Gateways, VPCs.
- Auto Scaling – Auto Scaling Groups, Launch Configurations.
Here’s the check in action:
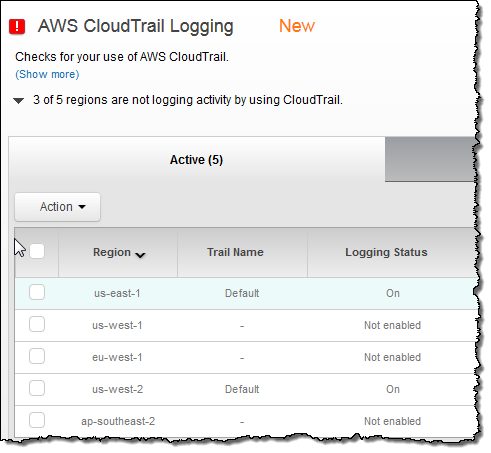
CloudTrail in More Regions
Earlier this month we expanded Amazon CloudTrail into the US West (Northern California), Europe (Ireland), and Asia Pacific (Sydney) Regions.
Trusted Advisor’s CloudTrail Logging check now verifies that you are using CloudTrail in all five Regions where CloudTrail runs:
— Jeff;
Auto Scaling API Update
We have added a pair of new API functions to Auto Scaling and we have made another pair of existing functions more powerful.
New Functions
DescribeAccountLimits tells you the maximum number of Launch Configurations and Auto Scaling Groups set for your account. If you need more of either one, simply fill out the EC2 Instance Request form and include the required number of each item in the Use Case field.
AttachInstances lets you attach one or more existing EC2 instances to an existing Auto Scaling group. This API can be useful if you need to warm up or manually prepare new instances for use.
More Power
The CreateLaunchConfiguration function can now use a running instance as a template for a new Launch Configuration. You can create a template that is an exact match (with the exception of the Availability Zone, which you need to set when you create the Auto Scaling group), or you can override any desired attributes.
The CreateAutoScalingGroup function now accepts an Instance ID as an optional parameter. If this parameter is supplied, the function uses the instance to create an Auto Scaling group and a Launch Configuration.
A Cool Use Case
You can use the new CreateAutoScalingGroup functionality and the new AttachInstances function to migrate an existing static system to an auto scaled version. This will allow you to upgrade without incurring any downtime or launching extraneous instances.
— Jeff;
AWS Console for iOS and Android Now Supports AWS OpsWorks
The AWS Console for iOS and Android now includes support for AWS OpsWorks.
You can see your OpsWorks resources — stacks, layers, instances, apps, and deployments with the newest version of the app. It also supports EC2, Elastic Load Balancing, the Relational Database Service, Auto Scaling, CloudWatch, and the Service Health Dashboard.
The Android version of the console app also gets a new native interface.
OpsWorks Support
With this new release, iOS and Android users have access to a wide variety of OpsWorks resources. Here’s what you can do:
- View and navigate your OpsWorks stacks, layers, instances, apps, and deployments.
- View the configuration details for each of these resources.
- View your CloudWatch metrics and alarms.
- View deployment details such as command, status, creation time, completion time, duration, and affected instances.
- Manage the OpsWorks instance lifecycle (e.g. reboot, stop, start), view logs, and create snaphsots of attached Volumes.
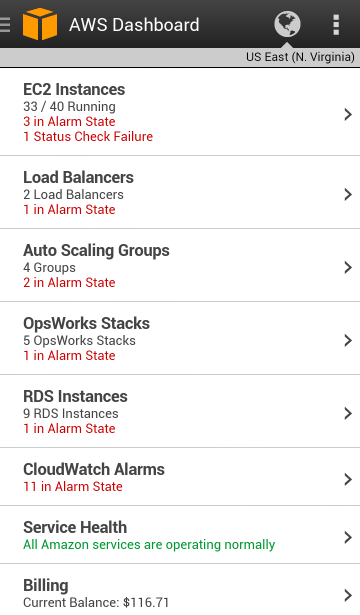
Take a Look
Here are some screen shots of the Android console app in action. The dashboard displays resource counts and overall status:
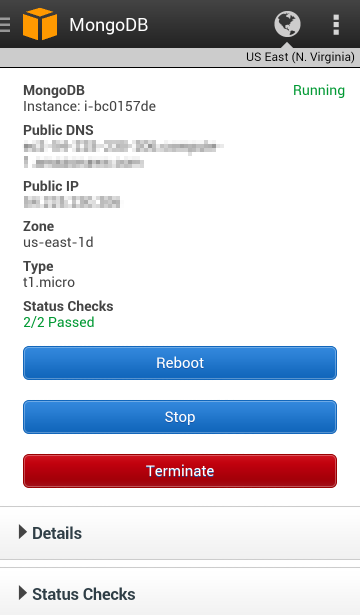
The status of each EC2 instance is visible. Instances can be rebooted, stopped, or terminated:
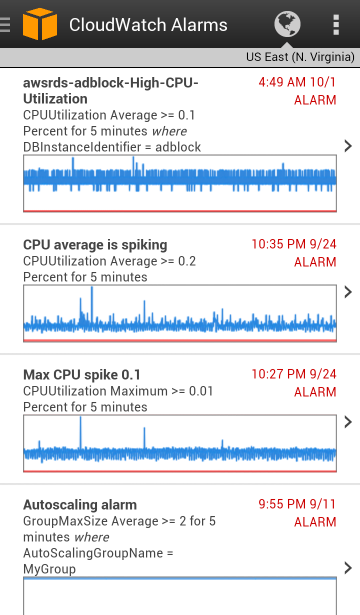
CloudWatch alarms and the associated metrics are visible:
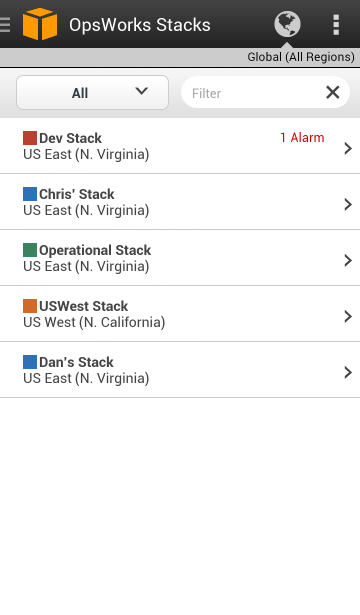
Each OpsWork stack is shown, along with any alarms:
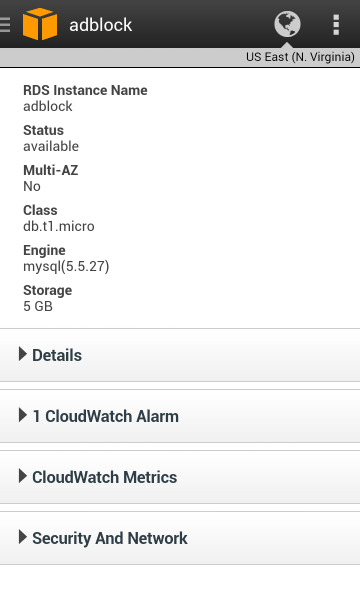
Full information is displayed for each database instance:
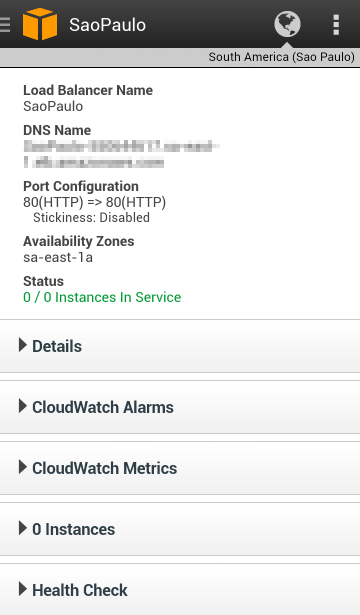
And for each Elastic Load Balancer:
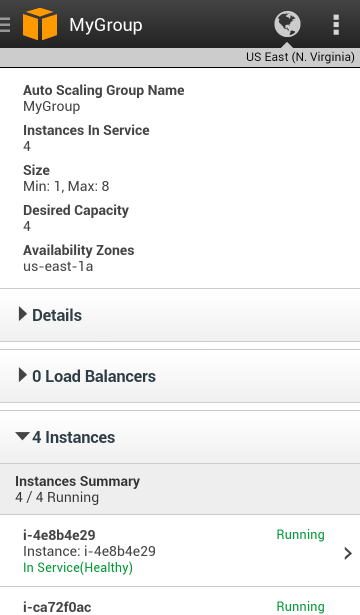
There’s also access to Auto Scaling resources:
Download Today
You can download the new version of the console app from Amazon AppStore, Google Play, or iTunes.
— Jeff;