Category: AWS Lambda
Arduino Web Editor and Cloud Platform – Powered by AWS
Last night I spoke with Luca Cipriani from Arduino to learn more about the new AWS-powered Arduino Web Editor and Arduino Cloud Platform offerings. Luca was en-route to the Bay Area Maker Faire and we had just a few minutes to speak, but that was enough time for me to learn a bit about what they have built.
If you have ever used an Arduino, you know that there are several steps involved. First you need to connect the board to your PC’s serial port using a special cable (you can also use Wi-Fi if you have the appropriate add-on “shield”), ensure that the port is properly configured, and establish basic communication. Then you need to install, configure, and launch your development environment, make sure that it can talk to your Arduino, tell it which make and model of Arduino that you are using, and select the libraries that you want to call from your code. With all of that taken care of, you are ready to write code, compile it, and then download it to the board for debugging and testing.
Arduino Code Editor
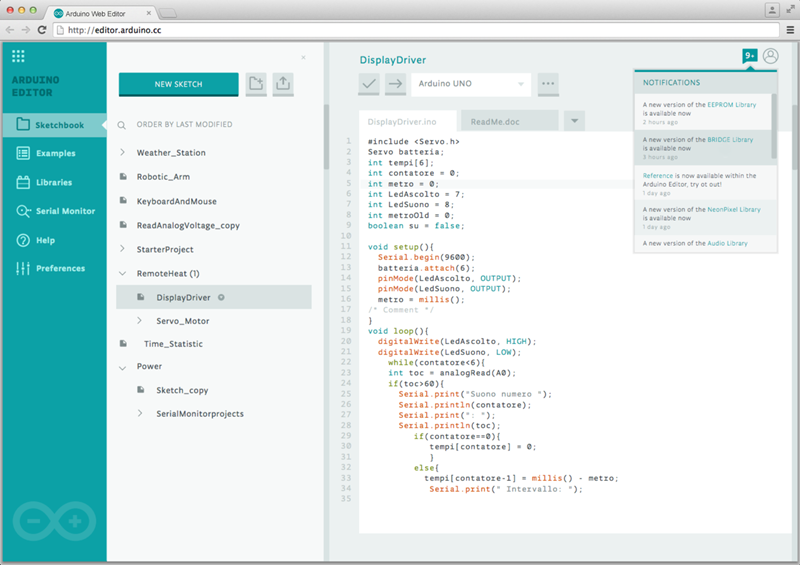
Luca told me that the Arduino Code Editor was designed to simplify and streamline the setup and development process. The editor runs within your browser and is hosted on AWS (although we did not have time to get in to the details, I understand that they made good use of AWS Lambda and several other AWS services).
You can write and modify your code, save it to the cloud and optionally share it with your colleagues and/or friends. The editor can also detect your board (using a small native plugin) and configure itself accordingly; it even makes sure that you can only write code using libraries that are compatible with your board. All of your code is compiled in the cloud and then downloaded to your board for execution.
Here’s what the editor looks like (see Sneak Peek on the New, Web-Based Arduino Create for more):
Arduino Cloud Platform
 Because Arduinos are small, easy to program, and consume very little power, they work well in IoT (Internet of Things) applications. Even better, it is easy to connect them to all sorts of sensors, displays, and actuators so that they can collect data and effect changes.
The new Arduino Cloud Platform is designed to simplify the task of building IoT applications that make use of Arduino technology. Connected devices will be able to be able to connect to the Internet, upload information derived from sensors, and effect changes upon command from the cloud. Building upon the functionality provided by AWS IoT, this new platform will allow devices to communicate with the Internet and with each other. While the final details are still under wraps, I believe that this will pave the wave for sensors to activate Lambda functions and for Lambda functions to take control of displays and actuators.
I look forward to learning more about this platform as the details become available!
— Jeff;
Machine Learning, Recommendation Systems, and Data Analysis at Cloud Academy
In today’s guest post, Alex Casalboni and Giacomo Marinangeli of Cloud Academy discuss the design and development of their new Inspire system.
— Jeff;
Our Challenge
Mixing technology and content has been our mission at Cloud Academy since the very early days. We are builders and we love technology, but we also know content is king. Serving our members with the best content and creating smart technology to automate it is what kept us up at night for a long time.
Companies are always fighting for people’s time and attention and at Cloud Academy, we face those same challenges as well. Our goal is to empower people, help them learn new Cloud skills every month, but we kept asking ourselves: “How much content is enough? How can we understand our customer’s goals and help them select the best learning paths?”
With this vision in mind about six months ago we created a project called Inspire which focuses on machine learning, recommendation systems and data analysis. Inspire solves our problem on two fronts. First, we see an incredible opportunity in improving the way we serve our content to our customers. It will allow us to provide better suggestions and create dedicated learning paths based on an individual’s skills, objectives and industries. Second, Inspire represented an incredible opportunity to improve our operations. We manage content that requires constant updates across multiple platforms with a continuously growing library of new technologies.
For instance, getting a notification to train on a new EC2 scenario that you’re using in your project can really make a difference in the way you learn new skills. By collecting data across our entire product, such as when you watch a video or when you’re completing an AWS quiz, we can gather that information to feed Inspire. Day by day, it keeps personalising your experience through different channels inside our product. The end result is a unique learning experience that will follow you throughout your entire journey and enable a customized continuous training approach based on your skills, job and goals.
Inspire: Powered by AWS
Inspire is heavily based on machine learning and AI technologies, enabled by our internal team of data scientists and engineers. Technically, this involves several machine learning models, which are trained on the huge amount of collected data. Once the Inspire models are fully trained, they need to be deployed in order to serve new predictions, at scale.
Here the challenge has been designing, deploying and managing a multi-model architecture, capable of storing our datasets, automatically training, updating and A/B testing our machine learning models, and ultimately offering a user-friendly and uniform interface to our website and mobile apps (available for iPhone and Android).
From the very beginning, we decided to focus high availability and scalability. With this in mind, we designed an (almost) serverless architecture based on AWS Lambda. Every machine learning model we build is trained offline and then deployed as an independent Lambda function.
Given the current maximum execution time of 5 minutes, we still run the training phase on a separate EC2 Spot instance, which reads the dataset from our data warehouse (hosted on Amazon RDS), but we are looking forward to migrating this step to a Lambda function as well.
We are using Amazon API Gateway to manage RESTful resources and API credentials, by mapping each resource to a specific Lambda function.
The overall architecture is logically represented in the diagram below:
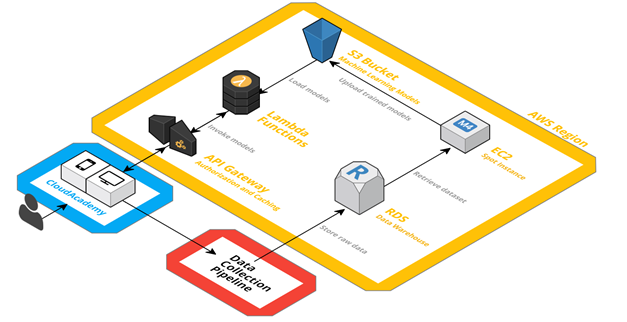
Both our website and mobile app can invoke Inspire with simple HTTPS calls through API Gateway. Each Lambda function logically represents a single model and aims at solving a specific problem. More in detail, each Lambda function loads its configuration by downloading the corresponding machine learning model from Amazon S3 (i.e. a serialized representation of it).
Behind the scenes, and without any impact on scalability or availability, an EC2 instance takes care of periodically updating these S3 objects, as outcome of the offline training phase.
Moreover, we want to A/B test and optimize our machine learning models: this is transparently handled in the Lambda function itself by means of SixPack, an open-source A/B testing framework which uses Redis.
Data Collection Pipeline
As far as data collection is concerned, we use Segment.com as data hub: with a single API call, it allows us to log events into multiple external integrations, such as Google Analytics, Mixpanel, etc. We also developed our own custom integration (via webhook) in order to persistently store the same data in our AWS-powered data warehouse, based on Amazon RDS.
Every event we send to Segment.com is forwarded to a Lambda function – passing through API Gateway – which takes care of storing real-time data into an SQS queue. We use this queue as a temporary buffer in order to avoid scalability and persistency problems, even during downtime or scheduled maintenance. The Lambda function also handles the authenticity of the received data thanks to a signature, uniquely provided by Segment.com.
Once raw data has been written onto the SQS queue, an elastic fleet of EC2 instances reads each individual event – hence removing it from the queue without conflicts – and writes it into our RDS data warehouse, after performing the required data transformations.

The serverless architecture we have chosen drastically reduces the costs and problems of our internal operations, besides providing high availability and scalability by default.
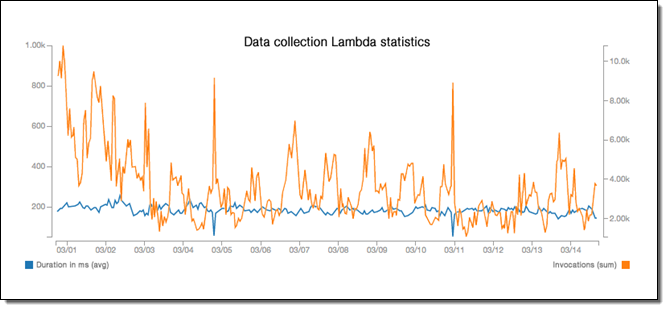
Our Lambda functions have a pretty constant average response time – even during load peaks – and the SQS temporary buffer makes sure we have a fairly unlimited time and storage tolerance before any data gets lost.
At the same time, our machine learning models won’t need to scale up in a vertical or distributed fashion since Lambda takes care of horizontal scaling. Currently, they have an incredibly low average response time of 1ms (or less):
We consider Inspire an enabler for everything we do from a product and content perspective, both for our customers and our operations. We’ve worked to make this the core of our technology, so that its contributions can quickly be adapted and integrated by everyone internally. In the near future, it will be able to independently make decisions for our content team while focusing on our customers’ need. At the end of the day, Inspire really answers our team’s doubts on which content we should prioritize, what works better and exactly how much of it we need. Our ultimate goal is to improve our customer’s learning experience by making Cloud Academy smarter by building real intelligence.
Join our Webinar
If you would like to learn more about Inspire, please join our April 27th webinar – How we Use AWS for Machine Learning and Data Collection.
— Alex Casalboni, Senior Software Engineer, Cloud Academy
— Giacomo Marinangeli, CTO, Cloud Academy
PS – Cloud Academy is hiring – check out our open positions!
Using Enhanced RDS Monitoring with Datadog
Today’s guest post comes from K Young, Director of Strategic Initiatives at Datadog!
— Jeff;
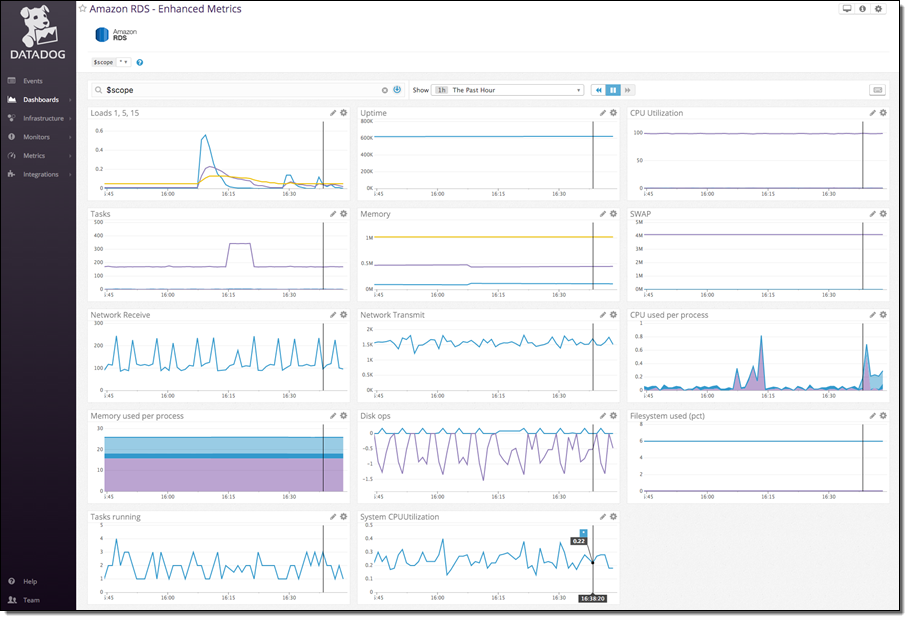
AWS recently announced enhanced monitoring for Amazon RDS instances running MySQL, MariaDB, and Aurora. Enhanced monitoring includes over 50 new CPU, memory, file system, and disk I/O metrics which can be collected on a per-instance basis as frequently as once per second.
AWS and Datadog
AWS worked closely with Datadog to help customers send this new high-resolution data to Datadog for monitoring. Datadog is an infrastructure monitoring platform that is very popular with AWS customers—you can see historical trends with full granularity and also visualize and alert on live data from any part of your stack.
With a few minutes of work your enhanced RDS metrics will immediately begin populating a pre-built, customizable dashboard in Datadog:
Connect RDS and Datadog
The first step is to send enhanced RDS metrics to CloudWatch Logs. You can enable the metrics during instance creation, or on an existing RDS instance by selecting it in the RDS Console and then choosing Instance Options → Modify:
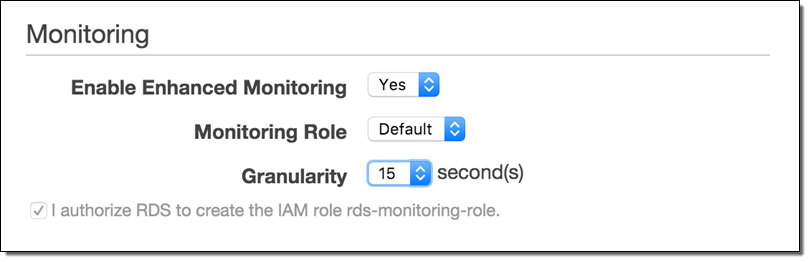
Set Granularity to 1–60 seconds; every 15 seconds is often a good choice. Once enabled, enhanced metrics will be sent to CloudWatch Logs.
The second step is to send the CloudWatch Log data to Datadog. Begin by setting up a Lambda function to process the logs and send the metrics:
- Create a role for your Lambda function. Name it something like
lambda-datadog-enhanced-rds-collectorand select AWS Lambda as the role type.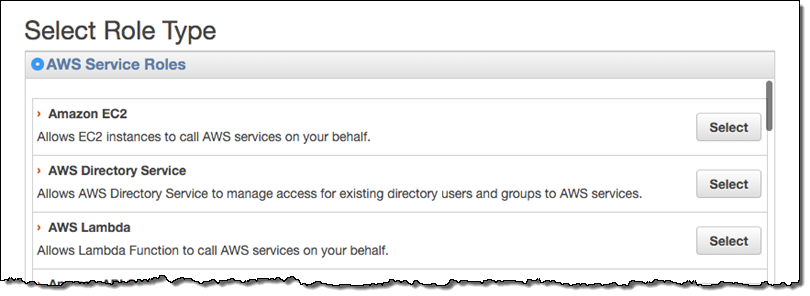
- From the Encryption Keys tab on the IAM Management Console, create a new encryption key. Enter an Alias for the key like
lambda-datadog-key. On the next page, add the appropriate administrators for the key. Next you’ll be prompted to add users to the key. Add at least two: yourself (so that you can encrypt the Datadog API key from the AWS CLI in the next step), and the role created above, e.g.lambda-datadog-enhanced-rds-collector(so that it can decrypt the API key and submit metrics to Datadog). Finish creating the key. - Encrypt the token using the AWS Command Line Interface (CLI), providing the Alias of your just-created key (e.g.
lambda-datadog-key) as well as your Datadog keys, available here. Use KMS to encrypt your key, like this:$ aws kms encrypt --key-id alias/ALIAS_KEY_NAME --plaintext '{"api_key":"DATADOG_API_KEY", "app_key":"DATADOG_APP_KEY"}'Save the output of this command; you will need it for the next step.
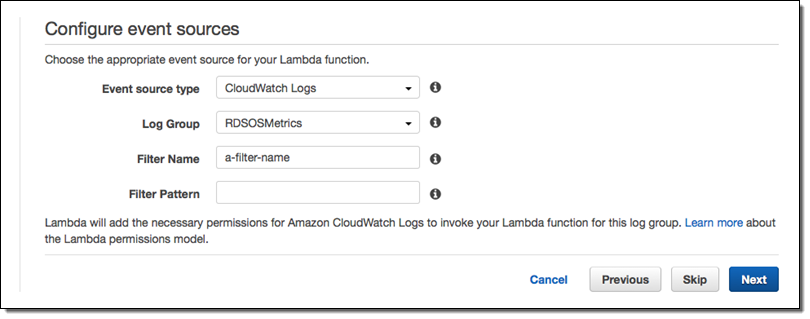
- From the Lambda Management Console, create a new Lambda Function. Filter blueprints by datadog, and select the
datadog-process-rds-metricsblueprint. - Choose RDSOSMetrics from the Log Group dropdown, enter the Filter Name of your choice, and go to the next page. If you have not yet enabled enhanced monitoring, you must do so before RDSOSMetrics will be presented an as option (see the instructions under Connect RDS and Datadog above):
- Give your function a name like
send-enhanced-rds-to-datadog. In the Lambda function code area, replace the string after KMS_ENCRYPTED_KEYS with the ciphertext blob part of the CLI command output above.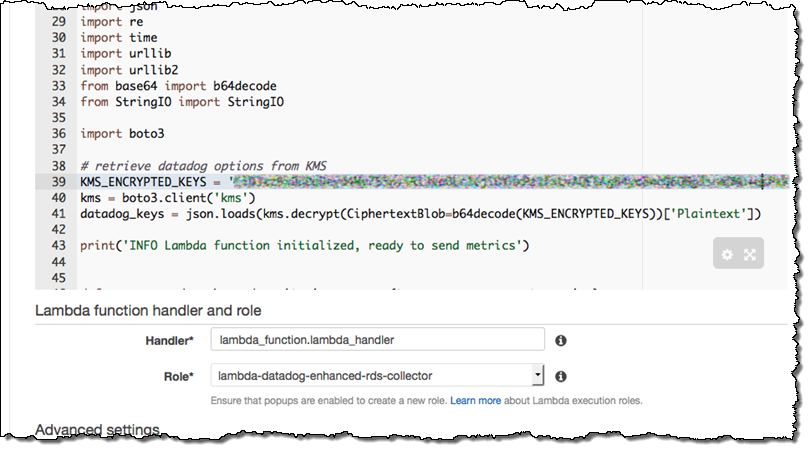
- Under Lambda function handler and role, choose the role you created in step 2, e.g.
lambda-datadog-enhanced-rds-collector. Go to the next page, select the Enable Now radio button, and create your function.
That’s It
Once you have enabled RDS in Datadog’s AWS integration tile, Datadog will immediately begin displaying your enhanced RDS metrics. Your RDS instances will be individually identifiable in Datadog via automatically-created tags of the form dbinstanceidentifier:YOUR_DB_INSTANCE_NAME, as well as any tags you added through the RDS console.
You can clone the pre-built dashboard and customize it however you want: add RDS metrics that are not displayed by default, or start correlating RDS metrics with the performance of the rest of your stack.
— K Young, Director of Strategic Initiatives
New – Notifications for AWS CodeCommit
AWS CodeCommit is a fully-managed source control service that makes it easy for you to host a secure and highly scalable private Git repository.Today we are making CodeCommit even more useful by adding support for repository triggers. You can use these triggers to integrate your existing unit tests and deployment tools into your source code management workflow. Because triggers are efficient and scalable, they are more broadly applicable than a model that is built around polling for changes. I believe that you will find these triggers to be helpful as you move toward a development methodology based on Continuous Integration and Continuous Delivery.
All About Notifications
You can create up to 10 triggers for each of your CodeCommit repositories. The triggers are activated in response to actions on the repository including code pushes, branch/tag creation, and branch/tag deletion. Triggers can be set to run for a specific branch of a repository or for all branches.
Triggers can send a notification to an Amazon Simple Notification Service (SNS) topic or can invoke a AWS Lambda function. Each trigger can also be augmented with custom data (an uninterpreted string) that you can use to distinguish the trigger from others that run for the same event. You can use triggers to subscribe to repository events through email or SMS. You can wire up SNS to SQS and queue up jobs for your CI/CD tools, or you can use SNS to activate webhooks provided by your tools. In any case, the actions you designate will be triggered by the changes in your CodeCommit repository. You can also use Lambda functions to trigger builds, check syntax, capture code complexity metrics, measure developer producitivity (less is more, of course), and so forth. My colleagues have also come up with some off-unusual ideas that you can find at the end of this post!
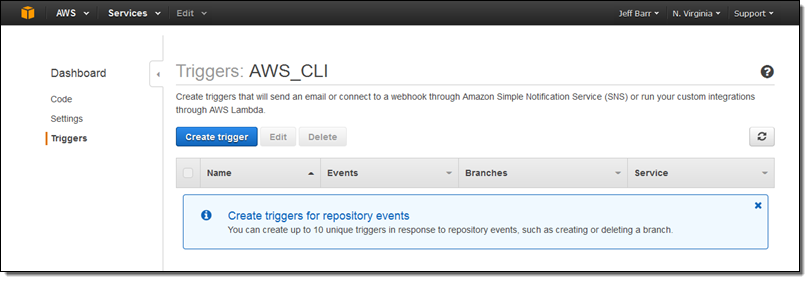
You can create, view, and manage your triggers from the AWS Management Console, AWS Command Line Interface (CLI), or via the CodeCommit API. I used the Console. The navigation column on the left now includes an entry for Triggers:
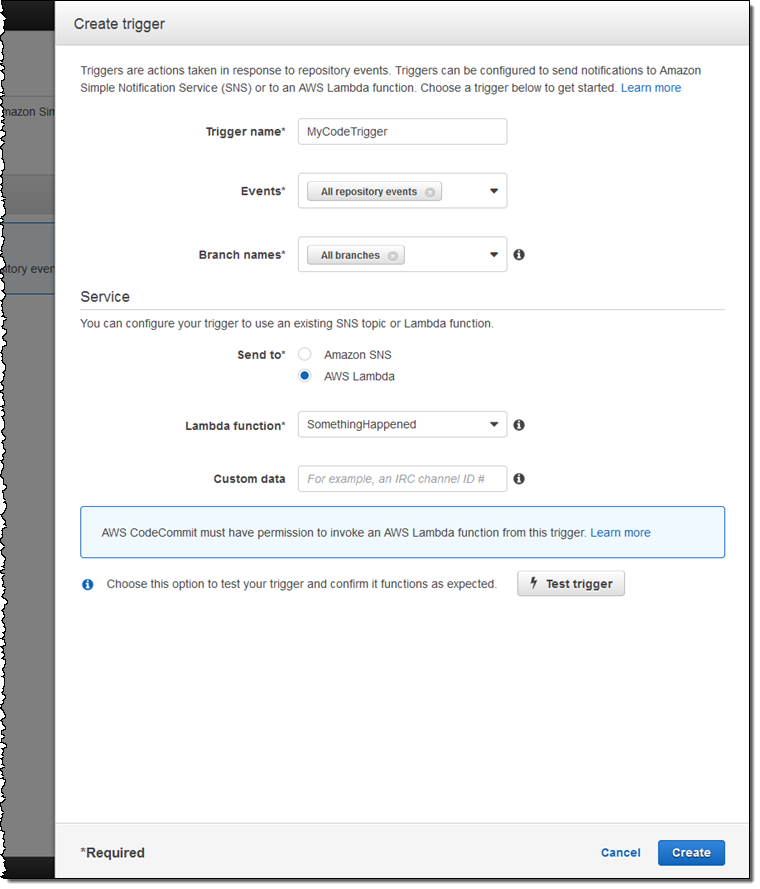
I simply click on Create Trigger to get started. Then I select the event (or events), pick the branch (or all branches), and fill in the details that are needed to publish a notification or invoke a Lambda function:
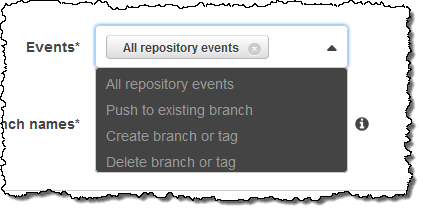
Here’s how I choose the events and branches of interest:
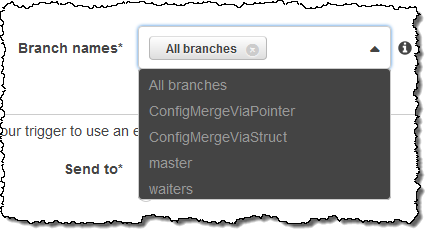
Then I point to my SNS topic or Lambda function (after ensuring that the proper permissions are in place), use Test Trigger to make sure that it all works as expected, and click on Create.
You can use Test Trigger to verify that your IAM permissions are working as expected. For example, here’s an error that I triggered on purpose:
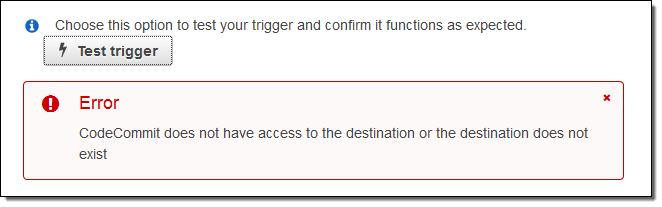
I fixed this by reading How to Allow AWS CodeCommit to run the Function in the documentation!
Available Now
This new functionality is available now and you can start using it today.To learn more, read about Managing Triggers for an AWS CodeCommit Repository.
My colleague Clare Liguori suggested some creative uses for CodeCommit triggers, above and beyond the usual integration with your CI/CD process:
- Video Deployment – Have your Lambda function check to see if a new video or a new version of an existing video has been committed, and deploy the video to YouTube.
- Party Time – Automatically throw and cater a party (using APIs for sandwiches, pizza, and beer) when you deploy a new release.
- Advertise Releases – When a new release is ready, automatically generate and run a Facebook ad and publicize the release on social media.
I am looking forward to hearing about the creative ways that you make use of these triggers within your development process. Leave me a comment and let me know!
— Jeff;
New – Access Resources in a VPC from Your Lambda Functions
A few months ago I announced that you would soon be able to access resources in a VPC from your AWS Lambda functions. I am happy to announce that this much-wanted feature is now available and that you can start using it today!
Your Lambda functions can now access Amazon Redshift data warehouses, Amazon ElastiCache clusters, Amazon Relational Database Service (RDS) instances, and service endpoints that are accessible only from within a particular VPC. In order to do this, you simply select one of your VPCs and identify the relevant subnets and security groups. Lambda uses this information to set up elastic network interfaces (ENIs) and private IP addresses (drawn from the subnet or subnets that you specified) so that your Lambda function has access to resources in the VPC.
Accessing Resources in a VPC
You can set this up when you create a new function. You can also update an existing function so that it has VPC access. You can configure this feature from the Lambda Console or from the CLI. Here’s how you set it up from the Console:
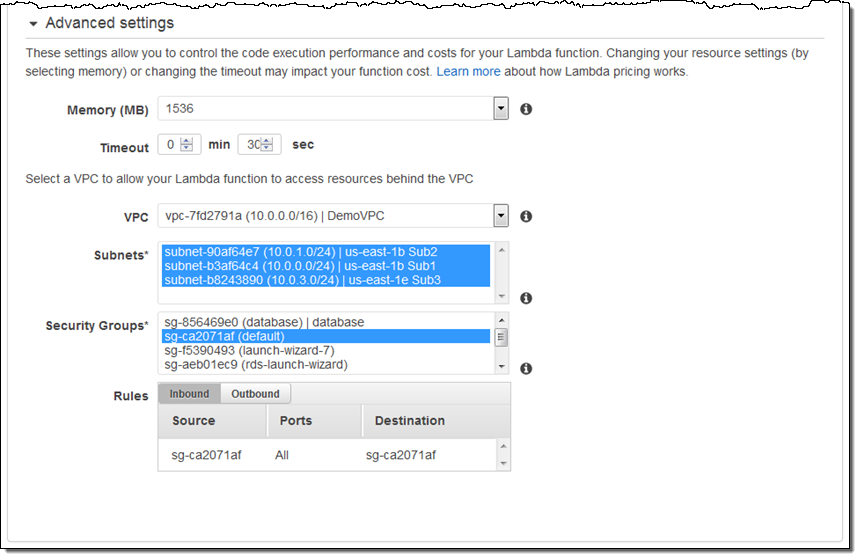
That’s all you need to do! Be sure to read Configuring a Lambda Function to Access Resources in an Amazon VPC in the Lambda documentation if you have any questions.
Things to Know
Here are a couple of things that you should know about this new feature:
ENI & IP Address Resources – Because Lambda automatically scales based on the number of events that is needs to process, your VPC must have an adequate supply of free IP addresses on the designated subnets.
Internet Access – As soon as you enable this functionality for a particular function, the function no longer has access to the Internet by default. If your function requires this type of access, you will need to set up a Managed NAT Gateway in your VPC (see New – Managed NAT (Network Address Translation) Gateway for AWS for more information) or run your own NAT (see NAT Instances).
Security Groups – The security groups that you choose for a function will control the function’s access to the resources in the subnets and on the Internet.
S3 Endpoints – You can also use this feature to access S3 endpoints within a VPC (consult New – VPC Endpoint for Amazon S3 to learn more).
Webinar – To learn more about this new feature, join our upcoming webinar, Essentials: Introducing AWS VPC Support for AWS Lambda.
— Jeff;
New – Slack Integration Blueprints for AWS Lambda
Does your operations team practice ChatOps? This brand-new term refers to the practice of conversation-driven operations using one or more “bots” that have the ability to insert notifications & status reports into the conversation and to respond to commands.
The chat environment provides real-time communication, a coherent shared view, multi-user access from web and mobile devices, access to previous messages, and so forth. Integrating bots into the conversation gives operations teams the ability to work collaboratively to understand, diagnose, and address emerging issues while simultaneously tracking changes made to the target system by way of commands directed to a bot.
New Slack Integration
In order to make it even easier for AWS customers to manage their environments in this new and innovative way, we recently launched a collection of Slack Integration Blueprints for AWS Lambda:
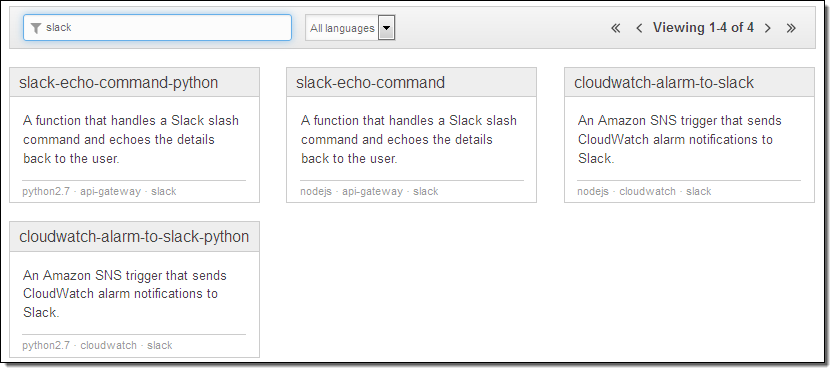
You can use these blueprints to build chat-based tools that participate in your own Slack conversations. The slack-echo- blueprints will help you to write bots that respond to commands; the cloudwatch-alarm-to-slack- blueprints will help you to write bots that emit status reports and notifications. Because you have the ability to give the bots access to any desired AWS APIs, you can interact with your AWS resources in any desired way. You can query their status, look for error conditions, change settings, or even create new resources.
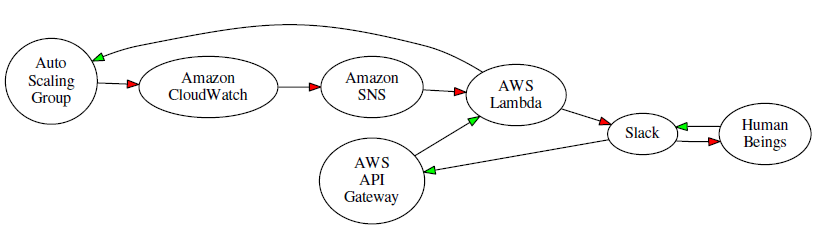
Suppose you want to monitor an Auto Scaling group using a CloudWatch alarm, and generate a message to your ChatOps team (a Slack channel) when a limit is exceeded. The team can take a closer look at the situation, and then decide to remedy the issue by scaling up. Using the new Slack integration and various AWS services, the overall flow would look like this (red arrows represent the notification; green arrows represent the response):
In order to implement a system like this you would use a Slack webhook to post messages to the channel, along with the cloudwatch-alarm-to-slack-python blueprint. Following the directions in the blueprint, you would create a AWS Key Management Service (KMS) key, use it to encrypt the URL of the webhook, and base-64 encode it before pasting it in to the code. Then you would create an IAM Role and give it permission to call the KMS Decrypt function on the key. The event handler would then send messages to the Slack channel of your choice like this:
slack_message = {
    'channel': SLACK_CHANNEL,
    'text': "%s state is now %s: %s" % (alarm_name, new_state, reason)
}

req = Request(HOOK_URL, json.dumps(slack_message))
The handler would also need to handle any exceptions raised by the request (this is all spelled out in the blueprint).
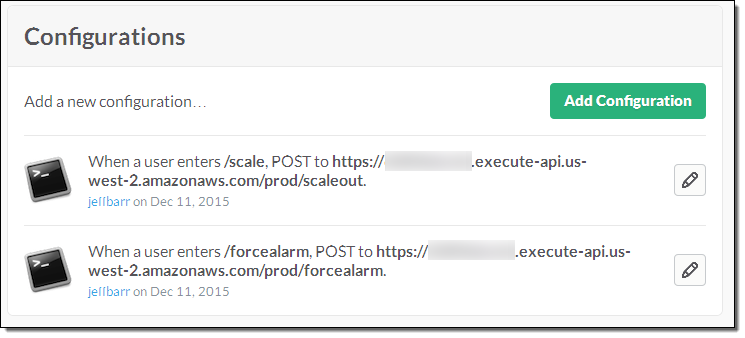
You can also create functions that implement custom Slack commands. In order to do this, you use the Amazon API Gateway to create an HTTP endpoint for each function, and then configure your Slack channel to POST to the endpoint when the command is invoked. For example, here’s the configuration for commands named /scale and /forcealarm:
The handler function has access to the user, command, channel, and command text:
def lambda_handler(event, context):
    req_body = event['body']
    params = parse_qs(req_body)

    user = params['user_name'][0]
    command = params['command'][0]
    channel = params['channel_name'][0]
    command_text = params['text'][0]
You will need to configure the endpoint with a POST method, and set the authorization to NONE. You’ll also need to map the body of the request to JSON. The comment block at the top of each of the new blueprints contains more information on this aspect of the integration.
Share your Functions
I would love to see what kinds of cool functions you come up with. Please feel free to post your work as a comment to this post.
— Jeff;
Learn About the newest AWS Services – Attend our October Webinars
If you attended AWS re:Invent, you were among the first to know about Amazon QuickSight, AWS IoT, Kinesis Firehose, and our other new offerings. Perhaps you had time to attend a session to learn more about the new service or services that were of interest to you. If you didn’t attend re:Invent or missed a session or two and are ready to learn more, I’ve got you covered. We will be running nine new-product webinars later this month. Each webinar is designed to provide you with the information that you need to have in order to be up and running as quickly as possible.
Here’s what we have for you! The webinars are free but “seating” is limited and you should definitely sign up ahead of time if you want to attend (all times are Pacific):
Tuesday, October 27
QuickSight is a fast, cloud-powered business intelligence tool. You can build visualizations, perform ad-hoc analysis, and get business insights from your data.
- Webinar: Introducing Amazon QuickSight (9 – 10 AM).
- Blog Post: Amazon QuickSight – Fast & Easy to Use Business Intelligence for Big Data at 1/10th the Cost of Traditional Solutions.
AWS IoT is a managed cloud platform that lets connected devices easily and securely interact with cloud applications and other devices.
- Webinar: Getting Started with AWS IoT (10:30 – 11:30 AM).
- Blog Post: AWS IoT – Cloud Services for Connected Devices.
Amazon Kinesis Firehose is the easiest way to load streaming data into AWS.
- Webinar: Introducing Amazon Kinesis Firehose (Noon – 1 PM).
- Blog Post: Amazon Kinesis Firehose – Simple & Highly Scalable Data Ingestion.
Wednesday, October 28
Spot Blocks allow you to launch Spot instances that will run for a finite duration (1 to 6 hours).
- Webinar: Introducing Spot Blocks (9 – 10 AM).
- Blog Post: New – EC2 Spot Blocks for Defined-Duration Workloads.
AWS WAF is a web application firewall that helps protect your web applications from common exploits.
- Webinar: Introducing AWS WAF (10:30 – 11:30 AM).
- Blog Post: New AWS WAF.
Amazon Elasticsearch Service is a managed service that makes it easy to deploy, operate, and scale Elasticsearch in the AWS Cloud.
- Webinar: Introducing Amazon Elasticsearch Service (Noon – 1 PM).
- Blog Post: New – Amazon Elasticsearch Service.
Thursday, October 29
AWS Lambda lets you run code in the cloud without provisioning or managing servers.
- Webinar: AWS Lambda Best Practices: Python, Scheduled Jobs, and More (9 – 10 AM).
- Blog Post: AWS Lambda Update – Python, VPC, Increased Function Duration, Scheduling, and More.
AWS Mobile Hub provides an integrated console that helps you build, test, and monitor your mobile apps.
- Webinar: Introducing AWS Mobile Hub (10:30 – 11:30 AM).
- Blog Post: AWS Mobile Hub – Build, Test, and Monitor Mobile Applications.
AWS Import/Export Snowball is a petabyte-scale data transport solution that uses secure appliances to transfer large amounts of data into and out of AWS.
- Webinar: Introducing AWS Import/Export Snowball (Noon – 1 PM).
- Blog Post: AWS Import/Export Snowball – Transfer 1 Petabyte Per Week Using Amazon-Owned Storage Appliances.
— Jeff;
AWS Lambda Update – Python, VPC, Increased Function Duration, Scheduling, and More
We launched AWS Lambda at re:Invent 2014 and the reception has been incredible. Developers and system architects quickly figured out that they can quickly and easily build serverless systems that need no administration and can scale to handle a very large number of requests. As a recap, Lambda functions can run in response to the following events:
- Changes to Amazon Simple Storage Service (S3) buckets – see Handling Amazon S3 Events.
- Updates to Amazon DynamoDB tables – see Processing Events from Amazon DynamoDB Streams.
- Messages arriving in Amazon Kinesis streams – see Processing Events from an Amazon Kinesis Stream.
- Notification to Amazon Simple Notification Service (SNS) topics – see Invoking Lambda Functions Using Amazon SNS Notifications.
- HTTP requests (via the Amazon API Gateway) – see Walkthrough: API Gateway and Lambda Functions.
- Evaluation of AWS CloudFormation templates – see AWS::Lambda::Function.
- Firing of Amazon Cognito events – see Amazon Cognito Events.
- Activation of an Alexa Skill – see Developing an Alexa Skill as a Lambda Function.
- Calls from Amazon Simple Workflow Service (SWF) activities – see AWS Lambda Tasks.
- Incoming email messages – see Receive and Process Incoming Email with Amazon SES.
- CloudWatch Logs – see Near Real-time Processing of Amazon CloudWatch Logs with AWS Lambda.
Over the past year we have added lots of new features to Lambda. We launched in three AWS regions (US East (Northern Virginia), US West (Oregon), and EU (Ireland)]) and added support for Asia Pacific (Tokyo) earlier this year. Lambda launched with support for functions written in Node.js; we added support for Java functions earlier this year. As you can see from the list above, we also connected Lambda to many other parts of AWS. Over on the AWS Compute Blog, you can find some great examples of how to put Lambda to use in powerful and creative ways, including (my personal favorite), Microservices Without the Servers.
New Features for re:Invent
Today we are announcing a set of features that will Lambda even more useful. Here’s a summary of what we just announced from the stage:
- VPC Support
- Python functions
- Increased function duration
- Function versioning
- Scheduled functions
As you can see, it is all about the functions! Let’s take a look at each of these new features.
Accessing Resources in a VPC From a Lambda Function
Many AWS customers host microservices within a Amazon Virtual Private Cloud and would like to be able to access them from their Lambda functions. Perhaps they run a MongoDB cluster with lookup data, or want to use Amazon ElastiCache as a stateful store for Lambda functions, but don’t want to expose these resources to the Internet.
You will soon be able to access resources of this type by setting up one or more security groups within the target VPC, configure them to accept inbound traffic from Lambda, and attach them to the target VPC subnets. Then you will need to specify the VPC, the subnets, and the security groups when your create your Lambda function (you can also add them to an existing function). You’ll also need to give your function permission (via its IAM role) to access a couple of EC2 functions related to Elastic Networking.
This feature will be available later this year. I’ll have more info (and a walk-through) when we launch it.
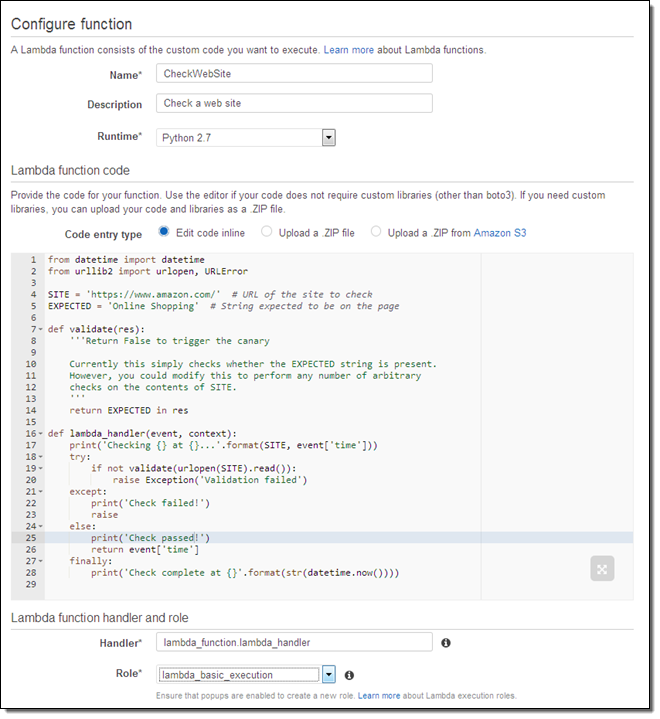
Python Functions
You can already write your Lambda functions in Node.js and Java. Today we are adding support for Python 2.7, complete with built-in access to the AWS SDK for Python. Python is easy to learn and easy to use, and you’ll be up and running in minutes. We have received many, many requests for Python support and we are very happy to be able to deliver it. You can start using Python today. Here’s what it looks like in action:
Increased Function Duration
Lambda is a great fit for Extract-Transform-Load (ETL) applications. It can easily scale up to ingest and process large volumes of data, without requiring any persistent infrastructure. In order to support this very popular use case, your Lambda functions can now run for up to 5 minutes. As has always been the case, you simply specify the desired timeout when you create the function. Your function can consult the context object to see how much more time it has available.
Here’s how you can access and log that value using Python:
print(" Remaining time (ms): " + str(context.get_remaining_time_in_millis()) + "\n")Functions that consume all of their time will be terminated, as has always been the case.
Function Versioning & Aliasing
When you start to build complex systems with Lambda, you will want to evolve them on a controlled basis. We have added a new versioning feature to simplify this important aspect of development & testing.
Each time you upload a fresh copy of the code for a particular function, Lambda will automatically create a new version and assign it a number (1, 2,3, and so forth). The Amazon Resource Name (ARN) for the function now accepts an optional version qualifier at the end (a “:” and then a version number). An ARN without a qualifier always refers to the newest version of the function for ease of use and backward compatibility. A qualified ARN such as “arn:aws:lambda:us-west-2:123456789012:function:PyFunc1:2” refers to a particular version (2, in this case).
Here are a couple of things to keep in mind as you start to think about this new feature:
- Each version of a function has its own description and configuration (language / runtime, memory size, timeout, IAM role, and so forth).
- Each version of a given function generates a unique set of CloudWatch metrics.
- The CloudWatch Logs for the function will include the function version as part of the stream name.
- Lambda will store multiple versions for each function. Each Lambda account can store up to 1.5 gigabytes of code and you can delete older versions as needed.
You can also create named aliases and assign them to specific versions of the code for a function. For example, you could initially assign “prod” to version 3, “test” to version 5, and “dev” to version 7 for a function. Then you would use the alias as part of the ARN that you use to invoke the function, like this:
- Production – “arn:aws:lambda:us-west-2:123456789012:function:PyFunc1:prod”
- Testing – “arn:aws:lambda:us-west-2:123456789012:function:PyFunc1:test”
- Development – “arn:aws:lambda:us-west-2:123456789012:function:PyFunc1:dev”
You can use ARNs with versions or aliases (which we like to call qualified ARNs) anywhere you’d use an existing non-versioned or non-aliased ARN. In fact, we recommend using them as a best practice.
This feature makes it easy to promote code between stages or to rollback to earlier versions if a problem arises. For example, you can point your prod alias to version 3 of the code, and then remap it to point to version 5 (effectively promoting it from test to production) without having to make any changes to the client applications or to the event source that triggers invocation of the function.
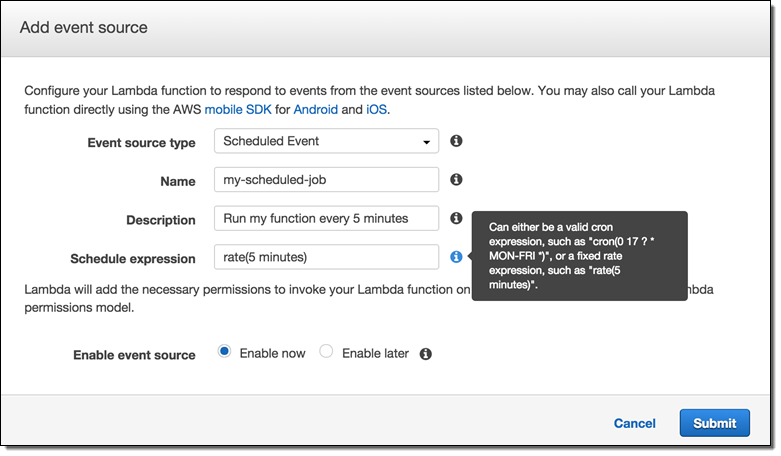
Scheduled Functions (Cron)
You can now invoke a Lambda function on a regular, scheduled basis. You can specify a fixed rate (number of minutes, hours, or days between invocations) or you can specify a Cron-like expression:
This feature is available now in the console, with API and CLI support in the works.
— Jeff;
Subscribe to AWS Public IP Address Changes via Amazon SNS
Last year we announced that the AWS Public IP Address Ranges Were Available in JSON Form. This was a quick, Friday afternoon post that turned out to be incredibly popular! Many AWS users are now polling this file on a regular basis and using it to manage their on-premises firewall rules or to track the growth of the AWS network footprint over time. If you are using AWS Direct Connect, you can use the file to update your route tables to reflect the prefixes that are advertised for Direct Connect public connections.
Today we are making it even easier for you to make use of this file. You can now subscribe to an Amazon Simple Notification Service (SNS) topic and receive notifications when the file is updated. Your code can then retrieve the file, parse it, and make any necessary updates to your local environment.
Simply subscribe to topic arn:aws:sns:us-east-1:806199016981:AmazonIpSpaceChanged and confirm the subscription in the usual way (you can use any protocol supported by SNS):

You will receive a notification that looks like this each time the IP addresses are changed:
{
  "create-time":"yyyy-mm-ddThh:mm:ss+00:00",
  "synctoken":"0123456789",
  "md5":"6a45316e8bc9463c9e926d5d37836d33",
  "url":"https://ip-ranges.amazonaws.com/ip-ranges.json"
}
You can also build a AWS Lambda function that responds to the changes:

In either case, your app will be responsible for fetching the file, parsing the JSON, and extracting the desired information. To learn more about the file, read about AWS IP Address Ranges.
If you build something useful (environment updates) and/or cool (an intriguing visualization) that you would like to share with the other readers of this blog, please feel free to leave me a comment!
— Jeff;
PS – My count shows 13,065,550 IP addresses in the EC2 range as of August 25, 2015.
Amazon S3 Update – Notification Enhancements & Bucket Metrics
We launched Amazon Simple Storage Service (S3) in the spring of 2006 with a simple blog post. Over the years we have kept the model simple and powerful while reducing prices, and adding features such as the reduced redundancy storage model, VPC endpoints, cross-region replication, and event notifications.
We launched the event notification model last year, with support for notification when objects are created via PUT, POST, Copy, or Multipart Upload. At that time the notifications applied to all of the objects in the bucket, with the promise of more control over time.
Today we are adding notification when objects are deleted, as well as with filtering on prefixes and suffixes for all types of notifications. We are also adding support for bucket-level Amazon CloudWatch metrics,
Notification Enhancements
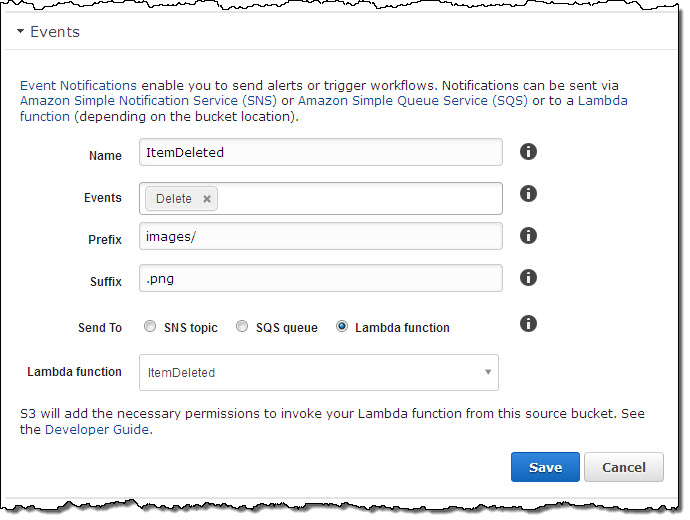
You can now arrange to be notified when an object has been deleted from an S3 bucket. Like the other types of notifications, delete notifications can be delivered to an SQS queue or an SNS topic or used to invoke an AWS Lambda function. The notification indicates that a DELETE operation has been performed on an object, and can be used to update any indexing or tracking data that you maintain for your S3 objects.
Also, you can now use prefix and suffix filters to opt in to event notifications based on object name. For example, you can choose to receive DELETE notifications for the images/ prefix and the .png suffix in a particular bucket like this:
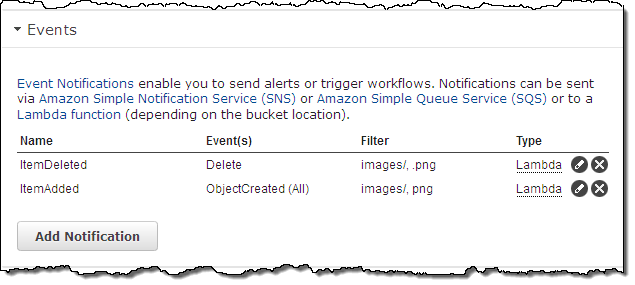
You can create and edit multiple notifications from within the Console:
CloudWatch Storage Metrics
Amazon CloudWatch tracks metrics for AWS services and for your applications and allows you to set alarms that will be triggered when a metric goes past a limit that you specify. You can now monitor and set alarms on your S3 storage usage. Available metrics include total bytes (Standard and Reduced Redundancy Storage) and total number of objects, all on a per-bucket basis. You can find the metrics in the AWS Management Console:
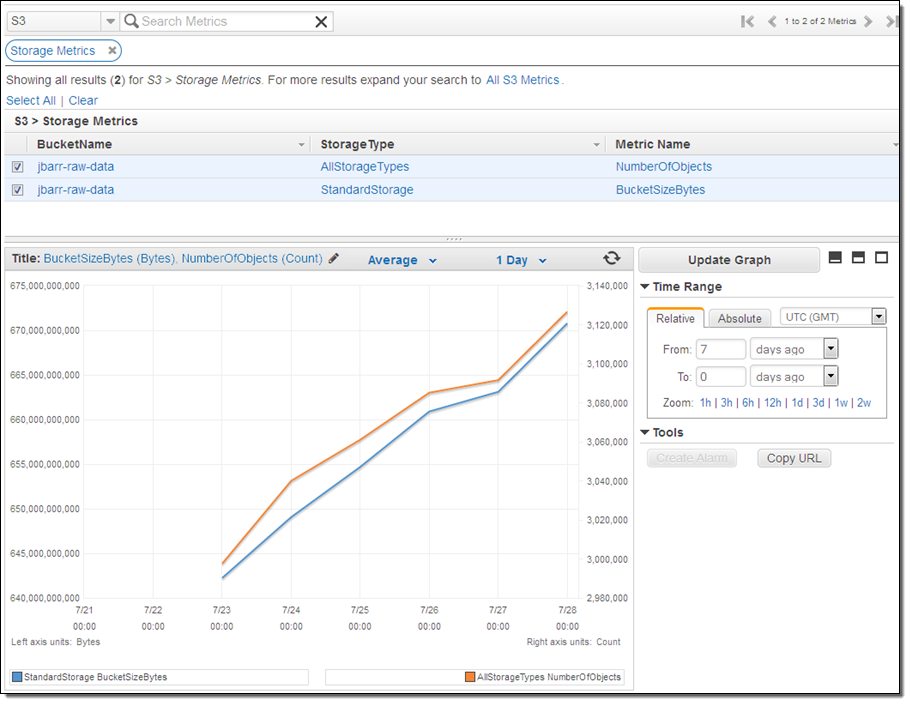
The metrics are updated daily, and will align with those in your AWS bill. These metrics do not include or apply to S3 objects that have been migrated (via a lifecycle rule) to Glacier.
Available Now
These features are available now and you can start using them today.
— Jeff;